
 Micron has released the newest addition to its portfolio of solid state drives, the M600 SATA SSD, designed for low power consumption in client computing environments and the direct successor to the M550. The M600 is built using Micron’s in-house 16nm NAND Flash and features the company’s new dynamic write acceleration, both of which will likely add to its reliability and longevity. Micron has also implemented its industry leading encryption and security features within the M600, including Opal 2.0 self-encryption, RAIN reliability technology, power loss protection and adaptive thermal monitoring.
Micron has released the newest addition to its portfolio of solid state drives, the M600 SATA SSD, designed for low power consumption in client computing environments and the direct successor to the M550. The M600 is built using Micron’s in-house 16nm NAND Flash and features the company’s new dynamic write acceleration, both of which will likely add to its reliability and longevity. Micron has also implemented its industry leading encryption and security features within the M600, including Opal 2.0 self-encryption, RAIN reliability technology, power loss protection and adaptive thermal monitoring.
Micron indicates the M600 can read data as fast as the SATA interface allows it to, with random reads up to 100,000IOPS as well as up to 560MB/s in sequential read speeds for all capacities. In addition, Micron states that the M600 will fair very well with write performance due to their dynamic write acceleration. Instead of sacrificing user capacity for a permanent cache, this technology switches NAND cells to behave like higher-grade flash (from MLC to SLC-like profile), which creates a cache that is sized according to drive demands. Micron can also move this acceleration zone around on the drive to prevent excessive wear. The result is reduced power consumption and improved write performance by up to 2.8 times over non-cached systems.
The M600 is equipped with self-encryption technology that is designed to meet government requirements and to make sure that valuable mobile data is secure even in when stolen or lost. The M600 uses the AES-256-bit hardware encryption engine so that it can actively encrypt data without a loss in performance while complying with the TCG Opal 2.0 standards and the Microsoft eDrive protocol. This makes it easy to enable using management tools or within Windows 8.
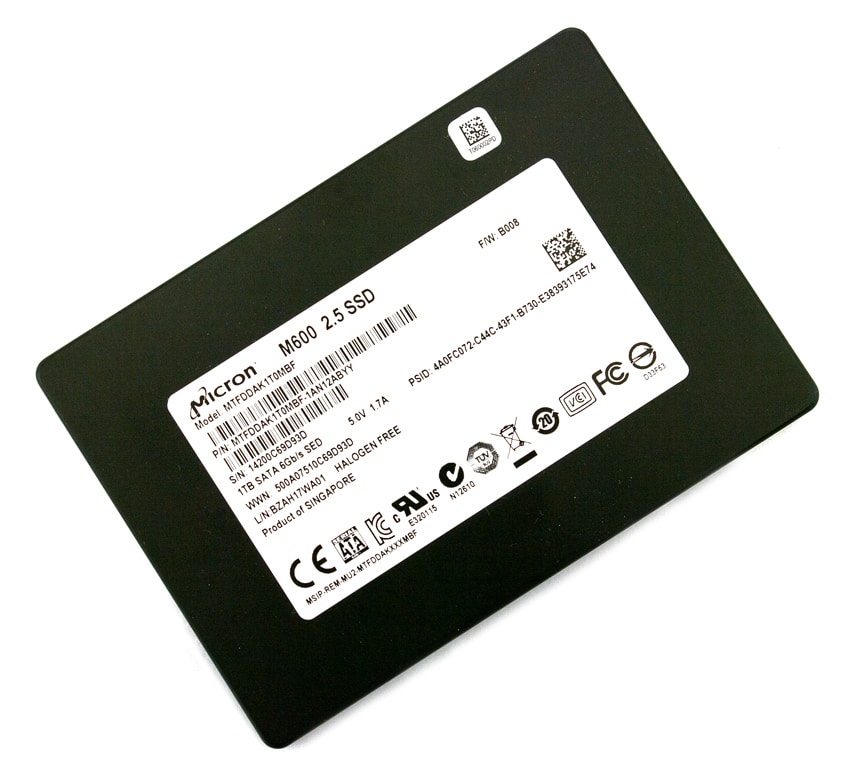
The Micron M600 comes in a variety of form factors in several capacities and form factors including 128GB, 256GB, 512GB, and 1TB in the standard 2.5″ drive and capacities up to 512Gb in the M.2 and mSATA form factors. We will be looking at the 2.5″ 256GB and 1TB units for our review.
Micron M600 Specifications
- Form factor:
- 2.5-inch
- mSATA
- M.2
- Capacities:
- 128GB, 256GB, 512GB, 1TB (2.5-inch)
- 128GB, 256GB, 512GB (mSATA, M.2)
- Interface: SATA 6Gb/s
- Sequential performance (up to):
- Read: 560MB/s
- Write: 510MB/s
- Random performance (up to):
- Read: 100,000IOPS
- Write: 88,000IOPS
- PCMark Vantage score (up to): 87,000
- Active average power consumption (TYP): 150mW
- Idle average power consumption: <100mW
- Device sleep power consumption: <2mW
- Endurance (TBW)
- 128GB: 100TB, 256GB: 200TB,
- 512GB: 300TB, 1TB: 400TB
- Operating temp: 0°C to +70°C
- Dimensions:
- 2.5-inch: 100.45mm x 69.85mm x 7mm
- mSATA: 50.80mm x 29.85mm x 3.75mm
- M.2 2280: 80mm x 22mm x 3.58mm
- M.2 2260: 60mm x 22mm x 2.3mm
- MTTF: 1.5 million hours
Design and build
The Micron M600 SSD consists of an all metal chassis, with a design that looks very different than its the previous M-class SSDs due to its black enclosure. Its 2.5-inch, 7mm SSD enclosure simply has a sticker placed on the front side with as product information label, which gives users information such as the capacity and serial number.
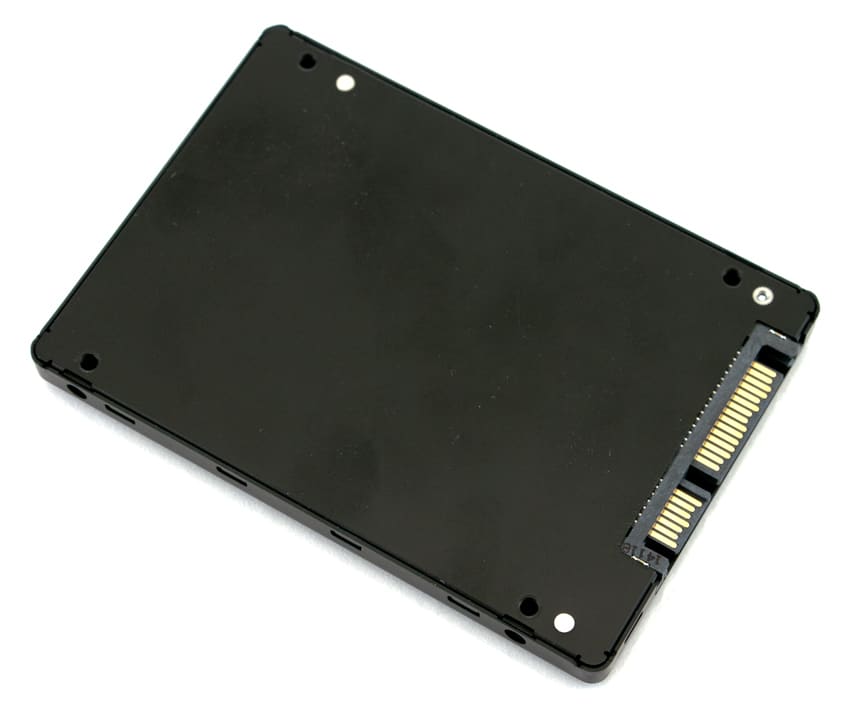
The side profiles show two screw holes on each side, allowing the drive to be mounted properly. Its slim 7mm profile allows the M600 fit into o enterprise client applications including corporate notebooks, workstations, ultra-thin tablet PCs and ultrabooks and in most any other application. The drive is also rounded out on the edges with standard SATA power and data connectors on the front.
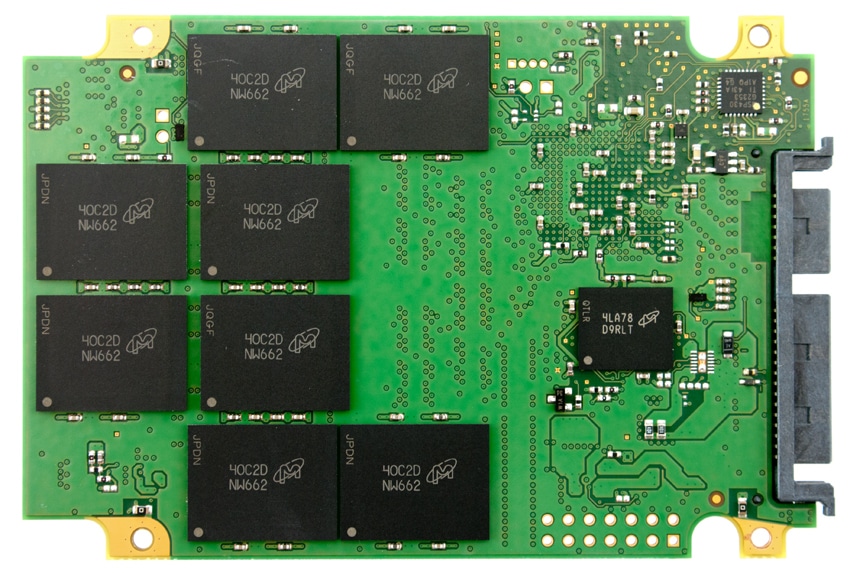
Front and center of the M600 is the Marvell 88SS9189-BLD2 controller, the same as the prior-gen M550.
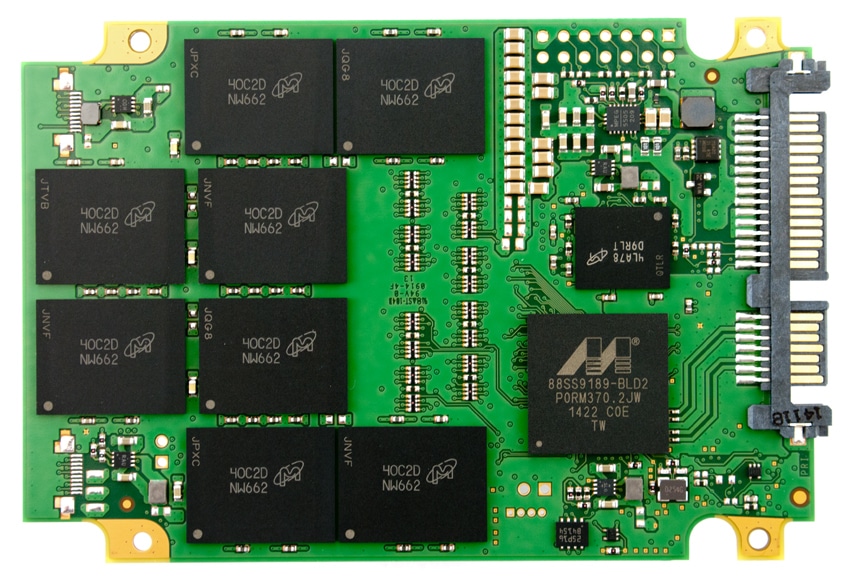
Micron uses its latest NAND technology inside the M600, which combined with firmware allows drive to swap NAND component behavior between MLC and SLC profiles on-the-fly. Micron indicates that this has potential to offer a dynamic pool of SLC-mode NAND dedicated to new data, which can increase write speeds, even for smaller capacities or when the drive has very little storage available.
Consumer Synthetic Workload Analysis
All consumer SSD benchmarks are conducted with the mid-range StorageReview Consumer Testing Platform. The comparables used for the review below include:
- Crucial MX100 (512GB, Micron 20nm MLC NAND, Marvell 88SS9189 controller, SATA)
- Micron/Crucial M550 (512GB 20nm 64Gb/128Gb MLC NAND, Marvell 88SS9189, SATA)
- OCZ Vertex 460 (240GB, Indilinx Barefoot 3 BF3-M10, Toshiba 19nm MLC Flash, SATA)
- SanDisk Extreme Pro (960GB, SanDisk 1Ynm, eX2 ABL MLC Flash, SATA)
- Samsung SSD 850 Pro (1TB, Samsung 32 layer 3D V-NANDND, Samsung MEX S4LN045X01-803 controller, SATA)
- AMD Radeon R7 (240GB, Barefoot 3 M00 controller, A19nm Toshiba MLC Flash, SATA)
- Intel SSD 730 (480GB, Intel PC29AS21CA0 controller, 20nm Intel MLC NAND, SATA)
All IOMeter figures are represented as binary figures for MB/s speeds.
In our first test, which measures 2MB sequential performance, Micron M600 1TB posted read and write speeds of 485.4MB/s and 450.4MB/s respectively, which ranked at the bottom of the pack. Its 256GB version faired much better with 503.4MB/s read and 450.3MB/s write, the former which placed at the upper part of the pack. The top performer in the read column was the Samsung drive while the Vertex had the best writes.
![]()
In our random transfer performance of the same file size, the M600 1TB showed 419.6MB/s read and 450.2MB/s taking a spot near the bottom again. The 256GB M600 model actually had the top read performance (495.7MB/s) with writes that placed near the middle of the pack (449.0MB/s).
![]()
Next, we switch to smaller 4K random transfers, where we recorded results of 8,218.3IOPS read and 19,873.8IOPS write for the M600 256GB model, good for middle of the pack. The M600 1TB model had slower results with 7,644.1IOPS read activity and 20,068IOPS write activity.
![]()
In our next test, we shift to a workload with 100% write activity that scales from 1QD to 64QD. Here, the M600 1TB model performed well taking 2nd place with its range of 18,624IOPS up to 89,029IOPS, which also topped all Crucial and Micron drives. The 256GB model ranged from 20,444.0IOPS to 72,497.5IOPS.
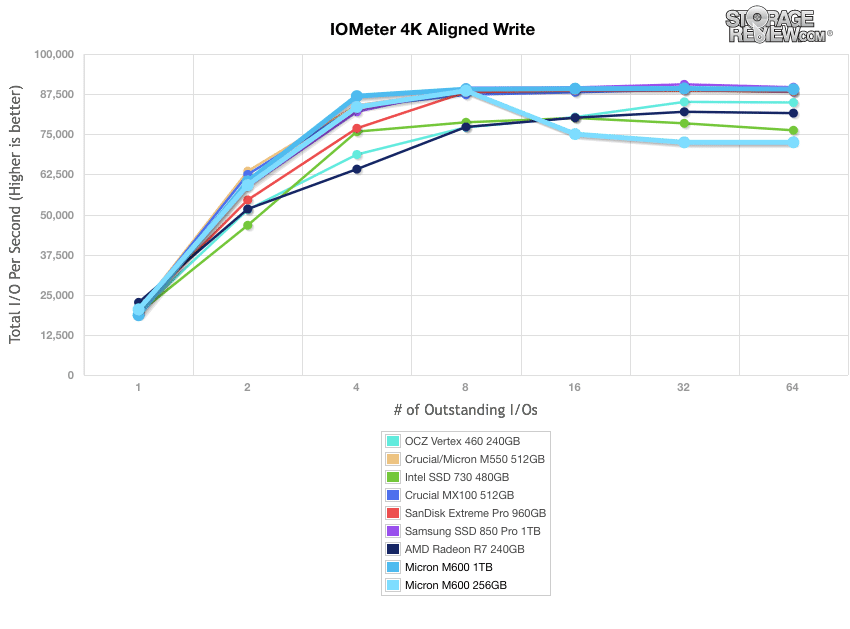
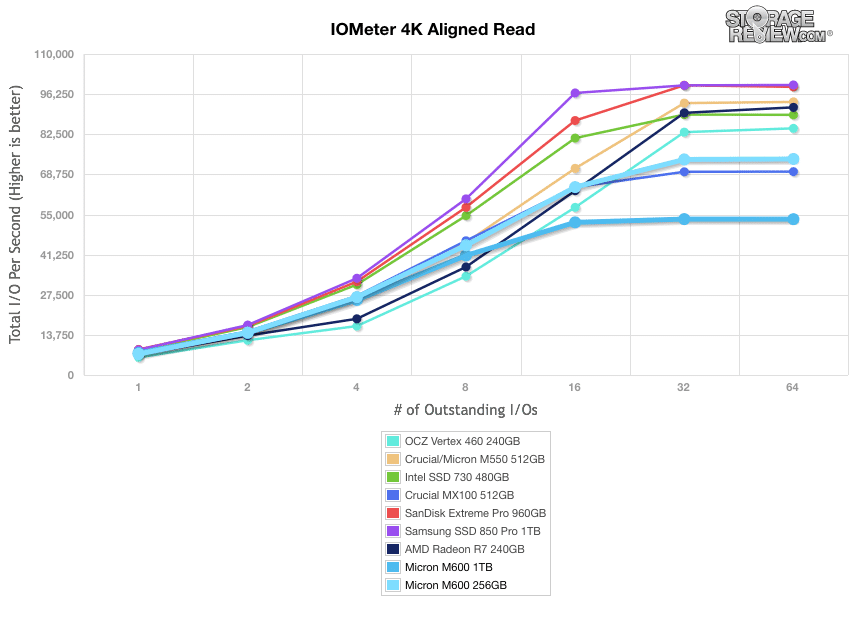
When switching to read activity, the performance of the 1TB M600 slipped significantly posting a 1QD of 7,577.7IOPS up to a 64QD IOPS of only 53,404. The 256GB model had much better results with 7,171.4IOPS at 1QD and 74,022IOPS at 64QD though only placing among the lower-middle part of the pack. The Samsung drive took the top spot here.
In our testing of the M600, we uncovered a performance anomaly in the way the SSD responds to our specific testing condition. To measure burst-specific data in our reviews, we test a 512MB section of the drive with write activity, then read that same section back in a read test. In our tests the M600 didn’t respond well to this testing condition, coming up much lower in performance than other SSDs we’ve tested in the past. Changing the test sample size, or writing to one section and reading from another seems to change the result. In communication with Micron, they’ve been able to replicate this anomaly following our testing scenario, although their own internal tests which test the drive over the full span of the drive don’t show this issue. They are investigating why changing the test portion of the SSD causes performance to vary and if a firmware fix is necessary.
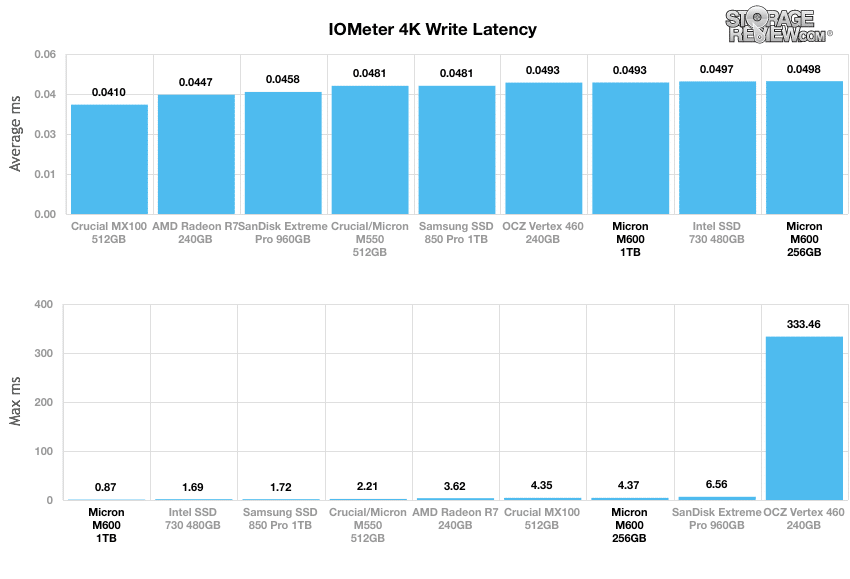
Next, we compare average write latency between each competing drive. In this test, the Micron M600 performed well for average latency with 0.0498ms for the 256GB and 0.493ms for the 1TB. The 256GB model had the best max latency score at only 0.873ms, which was significantly lower than the 2nd place Intel drive.
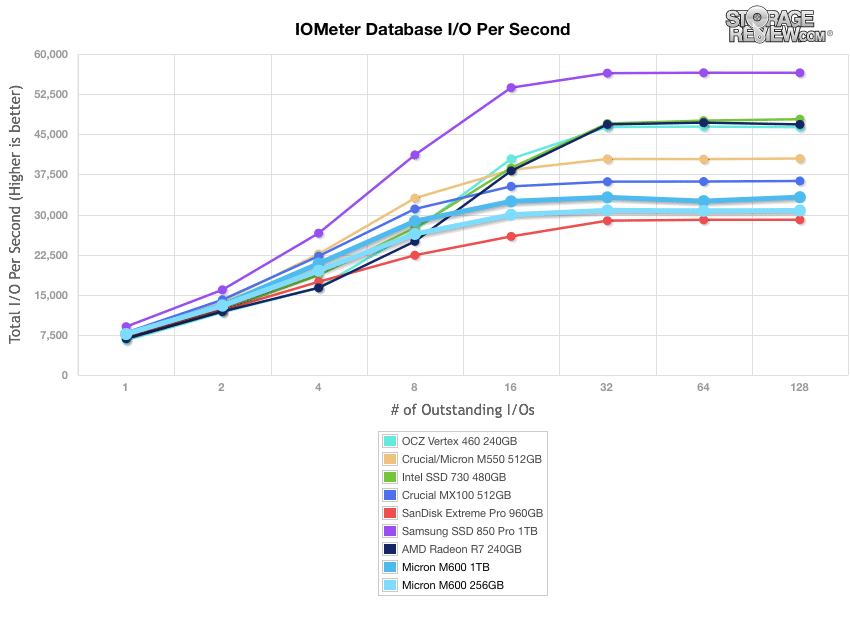
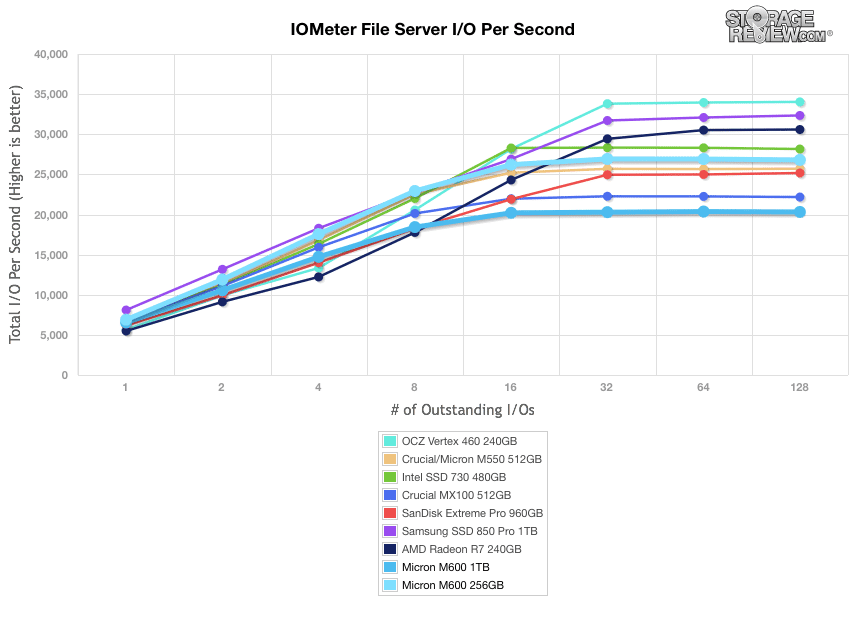
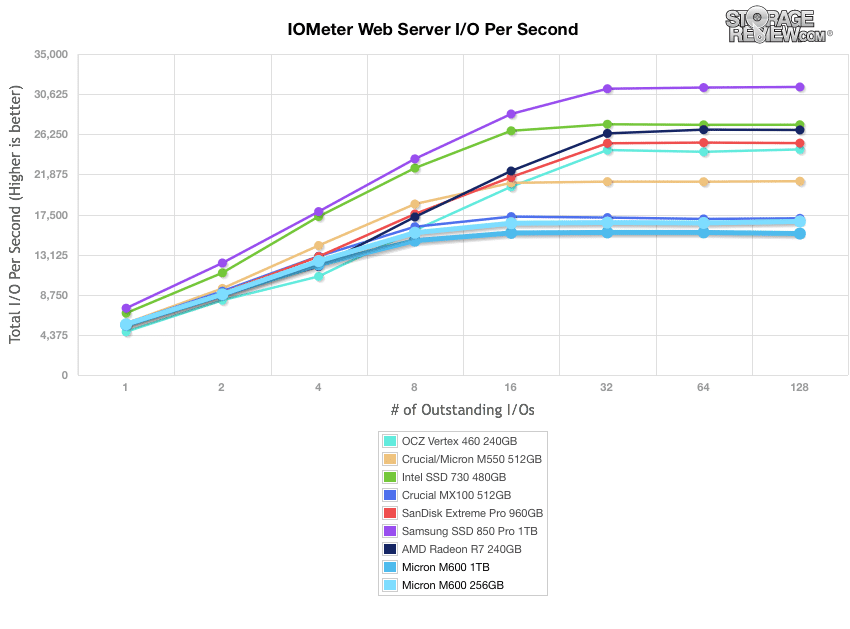
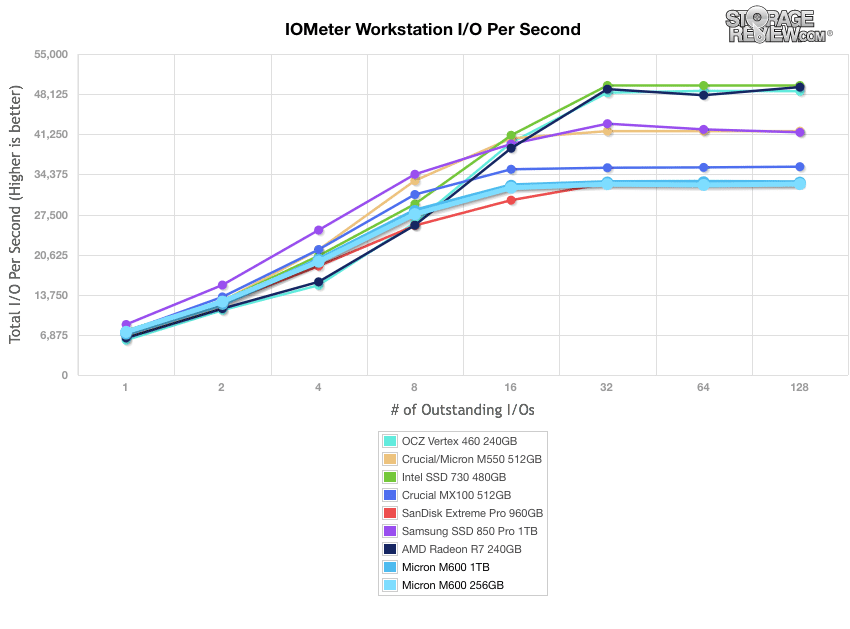
Our last series of synthetic benchmarks compare the hard drives in a series of server mixed-workloads with a queue depth of ranging from 1 to 128. Each of our server profile tests has a strong preference towards read activity, ranging from 67% read with our database profile to 100% read in our web server profile.
The first is our database profile, with a 67% read and 33% write workload mix primarily centered on 8K transfer sizes. The M600’s both capacities showed performance at the bottom of the charts. The 256GB model showed a QD1 of 7,656.1IOPS and a QD128 of 30754.8IOPS, while the 1TB model posted a QD1 of 7661.8IOPS and a QD128 of 33242.2IOPS.
In our a file server test, which has 80% read and 20% write workload spread out over multiple transfer sizes ranging from 512-byte to 64KB, the M600 posted results that placed at the bottom of the pack for the 1TB model. The 256GB version fared a bit better with middle of the pack performance.
Our web server profile is read-only with a spread of transfer sizes from 512-byte to 512KB told a similar story, with both M600 capacities ranking at the bottom of the charts.
The last profile looks at workstation activity, with a 20% write and 80% read mixture using 8K transfers. The M600 placed continued with its performance at the bottom of the pack, with the 256GB model taking last place.
Consumer Real-World Benchmarks
For the average consumer, trying to translate random 4K write speeds into an everyday situation is pretty difficult. It helps when comparing drives in every setting possible, but it doesn’t exactly work out into faster everyday usage or better game loading times. For this reason we turned to our StorageMark 2010 traces, which include HTPC, Productivity, and Gaming traces to help readers find out how a drive might rank under their conditions.
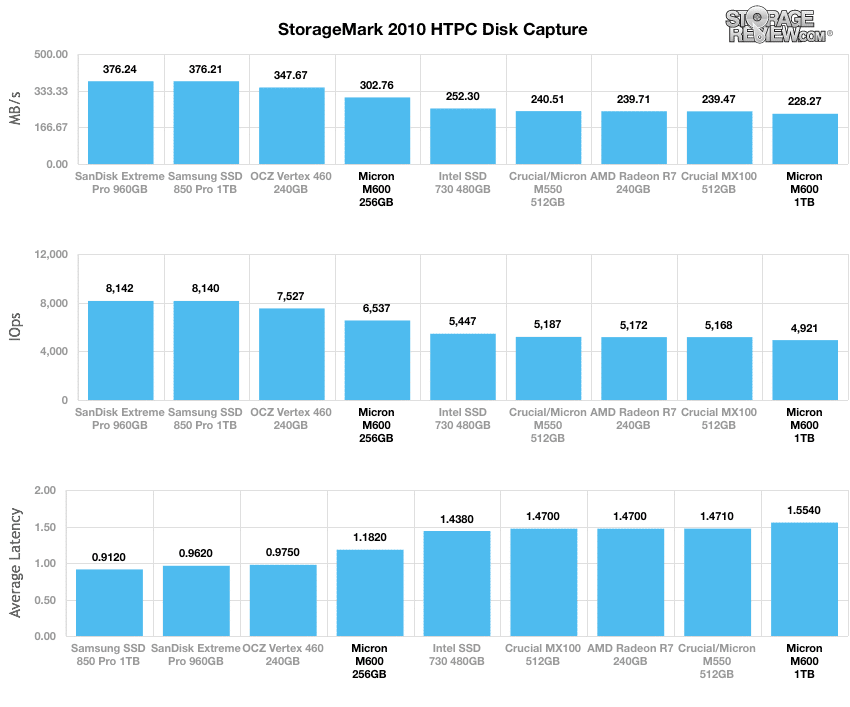
The first real-life test is our HTPC scenario. In this test we include: playing one 720p HD movie in Media Player Classic, one 480p SD movie playing in VLC, three movies downloading simultaneously through iTunes, and one 1080i HDTV stream being recorded through Windows Media Center over a 15 minute period. Higher IOps and MB/s rates with lower latency times are preferred. In this trace we recorded 2,986MB being written to the drive and 1,924MB being read.
In our HTPC profile, the Crucial M600 256GB model offered performance that ranked in the middle, with an average speed of 302.76MB/s, average latency of 1.182ms and an IOPS of 6,536 IOPS. The 1TB version placed at the very bottom.
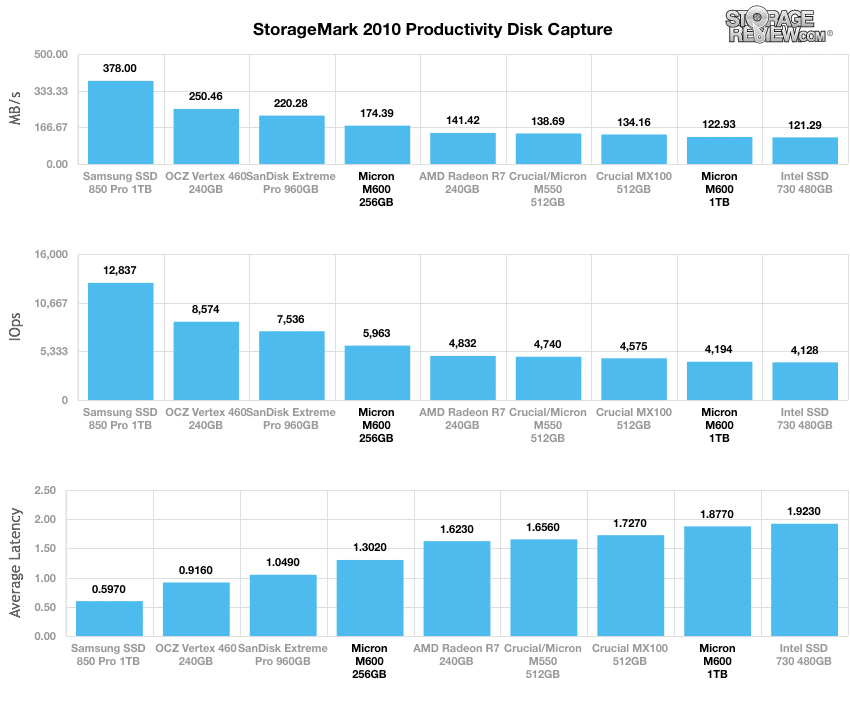
Our second real-life test covers disk activity in a productivity scenario. For all intents and purposes this test shows drive performance under normal daily activity for most users. This test includes: a three hour period operating in an office productivity environment with 32-bit Vista running Outlook 2007 connected to an Exchange server, web browsing using Chrome and IE8, editing files within Office 2007, viewing PDFs in Adobe Reader, and an hour of local music playback with two hours of additional online music via Pandora. In this trace we recorded 4,830MB being written to the drive and 2,758MB being read.
In our Productivity trace, while the M600 1TB model posted results ranking near the bottom, the 256GB version picked up the pace a bit with performance ranking in the middle of our charts posting 174.39MB/s, an IOPS of 5,962, and an average latency of 1.302ms. Its results were significantly better than its brethren, the M550 and MX100.
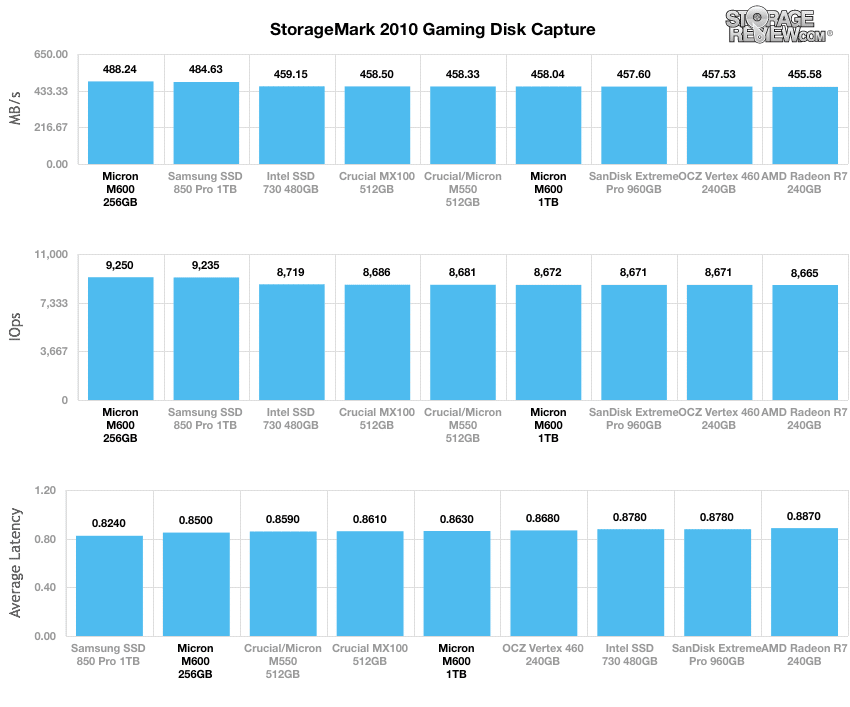
Our third real-life test covers disk activity in a gaming environment. Unlike the HTPC or Productivity trace, this one relies heavily on the read performance of a drive. To give a simple breakdown of read/write percentages, the HTPC test is 64% write, 36% read, the Productivity test is 59% write and 41% read, while the gaming trace is 6% write and 94% read. The test consists of a Windows 7 Ultimate 64-bit system pre-configured with Steam, with Grand Theft Auto 4, Left 4 Dead 2, and Mass Effect 2 already downloaded and installed. The trace captures the heavy read activity of each game loading from the start, as well as textures as the game progresses. In this trace we recorded 426MB being written to the drive and 7,235MB being read.
In our read-intensive Gaming trace, the M600 256GB model boasted an impressive speed of 488MB/s, with an IOPS and average latency of 9,249.6 and 0.85ms, which ranked at the top of the charts beating even the top-in-class Samsung SSD. The 1TB model kept pace as well.
Power Consumption
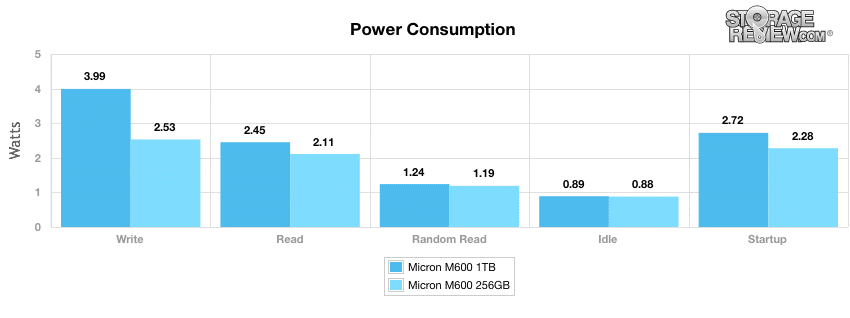
Micron quotes the M600 drives as having power consumption of 150mW for all 2.5′ capacities with DIPM enabled.
In our tests (Windows 7), we measured idle power consumption from the M600 1TB at only 0.89W, with the highest measured total at 3.99W taking place during writes. The 256GB model had a very similar idle power consumption with 0.88W. The highest consumption was also during writes, but with a much less average at only 2.53W.
Conclusion
The M600 Series of SSDs are Micron’s latest addition to portfolio of solid state drives specifically designed for enterprise client computing with a focus on low power consumption and reliability. The M600 uses Micron’s 16nm process technology–their most advanced Flash technology–and is equipped with a Marvell 9189 controller and features like encryption and dynamic write acceleration. The drives are offered in a variety of form factors to meet the needs of system builders, OEMs, upgraders and the like.
Considered reliable drives overall, the last few releases of Micron flagship M-series SSDs haven’t shown the level of improvement expected in today’s market, especially compared to leading vendor offerings. The M600 was generally underwhelming compared to the other current-generation SSDs of the same class in most of our tested categories. Ultimately the M600 SSD posted results all over the board in the two different capacities we reviewed. The 256GB model performed its best during the 2MB sequential performance benchmarks ranking right at the top of the leaderboard, though its higher capacity model was right at the bottom. The 256GB capacity was also the top performer in our gaming profile workload, which was a bit of a surprise given the rest of the scores. However, most of the other benchmarks showed underwhelming results, particularly in our mixed-workloads where both capacities placed toward the bottom in these tests.
Micron has indicated that the main draw for their new M600 drive is its new features as well as an expanded form factor portfolio for the thin and light computing space, enhanced endurance and variants for SED and Non-SED. Those features are definitely a plus and Micron heritage will win them deployments for sure. At the end of the day though the drive will probably need to win on price as the heralded write acceleration technology, firmware and new NAND didn’t show very well in our benchmarks.
Pros
- Offered in a variety of capacities and form factors
- Low power consumption
- Strong gaming performance (256GB capacity)
Cons
- Inconsistent performance results, poor mixed-workloads
- Underwhelming performance compared to current-generation competition
Bottom Line
The Micron M600 offers new features and a history of excellent support and build quality from Micron. The drive itself though doesn’t stand out from the crowd though and probably needs a significant price advantage to win in the mainstream SSD class.