
QNAP Systems is continuing to expand its QuTS hero line with the QNAP TS-h2490FU NAS. This 2U, rackmount NAS is more performance-oriented with a second-gen AMD EPYC CPU and all NVMe flash storage. Being a “hero” NAS, it is ZFS-based, that while lending itself to more enterprise features, it tends to pull overall performance down. Today we’ll look at how a ZFS-based system does with higher-performance storage after a recent review of QuTS on SATA drives.
QNAP Systems is continuing to expand its QuTS hero line with the QNAP TS-h2490FU NAS. This 2U, rackmount NAS is more performance-oriented with a second-gen AMD EPYC CPU and all NVMe flash storage. Being a “hero” NAS, it is ZFS-based, that while lending itself to more enterprise features, it tends to pull overall performance down. Today we’ll look at how a ZFS-based system does with higher-performance storage after a recent review of QuTS on SATA drives.
Speaking of components, the hardware of the QNAP TS-h2490FU including an AMD EPYC 7302P (16-core) processor, up to 256GB of DDR4 ECC memory (depending on model), and 24 NVMe SSDs. The NAS can be configured with up to four 25GbE ports. There are also five PCIe expansion slots for adding other connectivity, storage, or other accessories. This hardware, QNAP claims performance numbers of 472K IOPS read and 205K IOPS write with very low latency common with NVMe storage. With sequential work, the NAS claims 14GB/s read and 10.5GB/s write with deduplication off.
As we stated previously, QuTS hero is a combination of the app-based QTS with a 128-bit ZFS file system. QuTS hero is aimed specifically at the QNAP business line of NAS. The OS comes with inline deduplication, inline compression, and inline compaction to help better utilize storage resources. The ZFS nature of the OS allows for self-healing to better boost reliability and maintaining data integrity. While conventional RAID configurations are supported, QuTS hero also supports RAIDZ.
QNAP TS-h2490FU Specifications
| CPU | AMD EPYC 7302P 16-core 3.0 GHz processor (up to 3.3 GHz) |
| CPU Architecture | 64-bit x86 |
| Encryption Engine | (AES-NI) |
| System Memory | Up to 256GB RDIMM DDR4 ECC |
| Maximum Memory | 4 TB (16 x 256 GB) |
| Memory Slot | 16 x Long-DIMM DDR4 |
| Flash Memory | 5GB (Dual boot OS protection) |
| Drive Bay | 24 x 2.5-inch U.2 PCIe NVMe |
| Drive Compatibility | 2.5-inch U.2 NVMe Gen 3 x4 solid-state drives |
| Hot-swappable | Yes |
| SSD Cache Acceleration Support | Yes |
| 2.5 Gigabit Ethernet Port (2.5G/1G/100M) | 2 (also support 10M) |
| 25 Gigabit Ethernet Port | 4 x 25GbE SFP28 SmartNIC port |
| Jumbo Frame | Yes |
| PCIe Slot | Slot 1: PCIe Gen4 x4 Slot 2: PCIe Gen4 x8 or x4 Slot 3: PCIe Gen4 x4 Slot 4: PCIe Gen4 x8Slot 5: PCIe Gen4 x16 or x8 |
| USB 3.2 Gen 1 port | 2 |
| Form Factor | Rackmount |
| LED Indicators | HDD, Status, 10 GbE, LAN, storage expansion port status |
| Buttons | Power, Reset |
| Dimensions (HxWxD) | 3.48 × 18.94 × 20.09 inch |
| Weight (Net) | 33.51 lbs |
| Weight (Gross) | 48.19 lbs |
| Operating temperature | 0 – 35°C (32°F – 95°F) |
| Relative Humidity | 5-95% RH non-condensing, wet bulb: 27˚C (80.6˚F) |
| Power Supply Unit | 1100W PSU(x2), 200-240Vac, |
| Max Wattage: | 1100W@200-240Vac 850W@100-240Vac |
| Power Consumption: Operating Mode, Typical | 277.64 W |
| Fan | 4 x 60mm, 12VDC |
| Sound Level | 53.5 db(A) |
| System Warning | Buzzer |
QNAP TS-h2490FU Design and Build
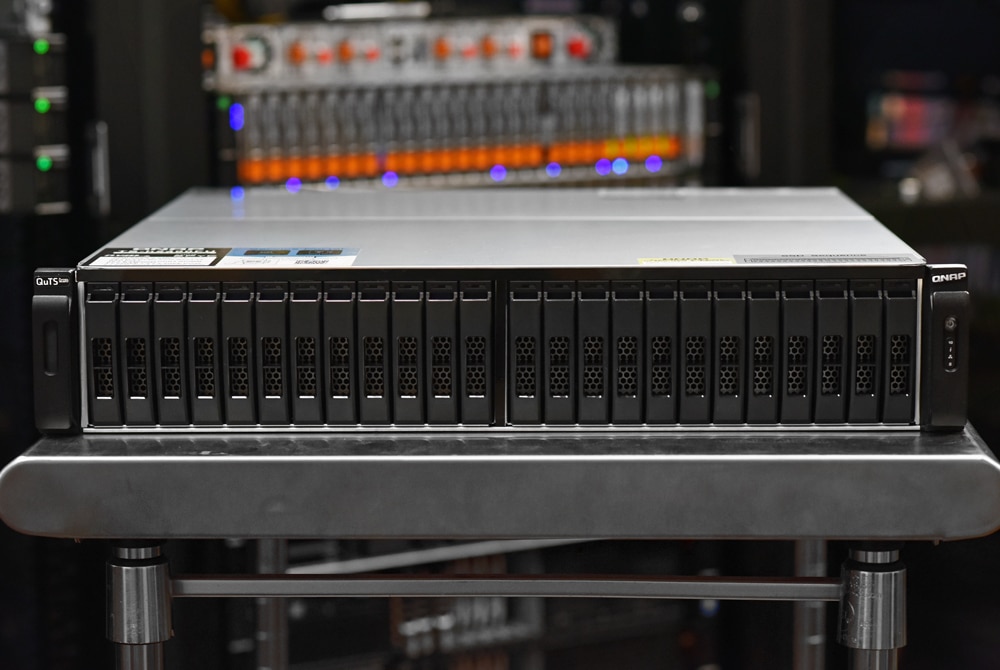
The QNAP TS-h2490FU is a 2U, rackmount NAS. Across the front of the device are the 24 2.5” drive bays. At the top of each bay are LED indicator lights. Off to the right are the power button as well as indicator LEDs for 10 Gigabit Ethernet, System staus, 2.5 Gigabit Ethernet, and the expansion unit, if used.
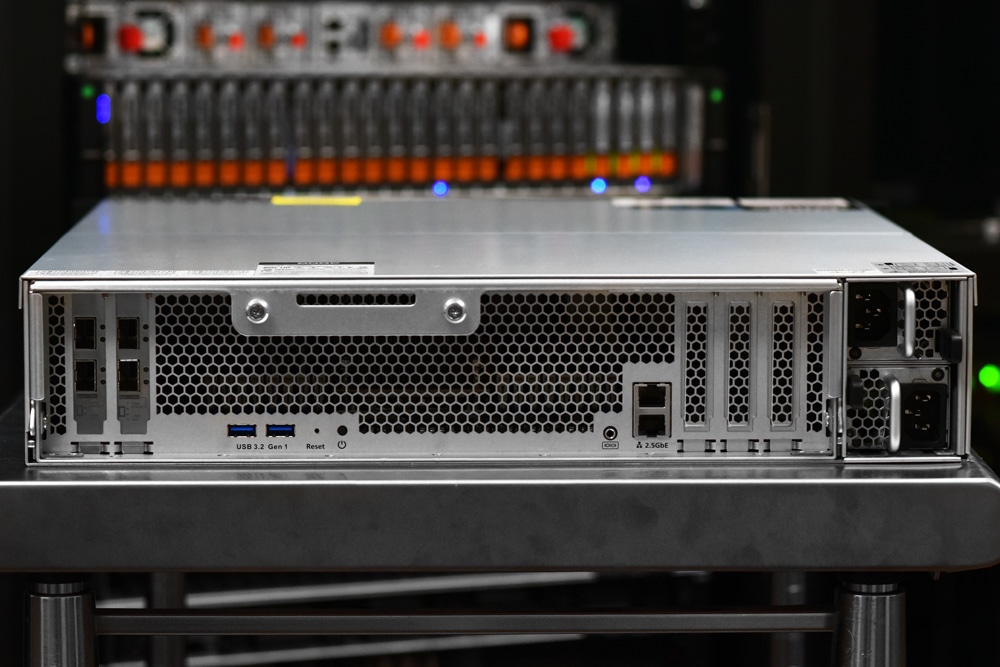
The rear of the devices is largely taken up by ventilation. Depending on the setup, on the left, there are four 25GbE SFP28 Ethernet ports. On the bottom left are two USB 3.2 Gen1 Type-A ports, a power button, and a reset button. Following along on the bottom we see a Com port, two 2.5GbE Ethernet ports, three PCIe expansion slots, and two PSUs on the right.
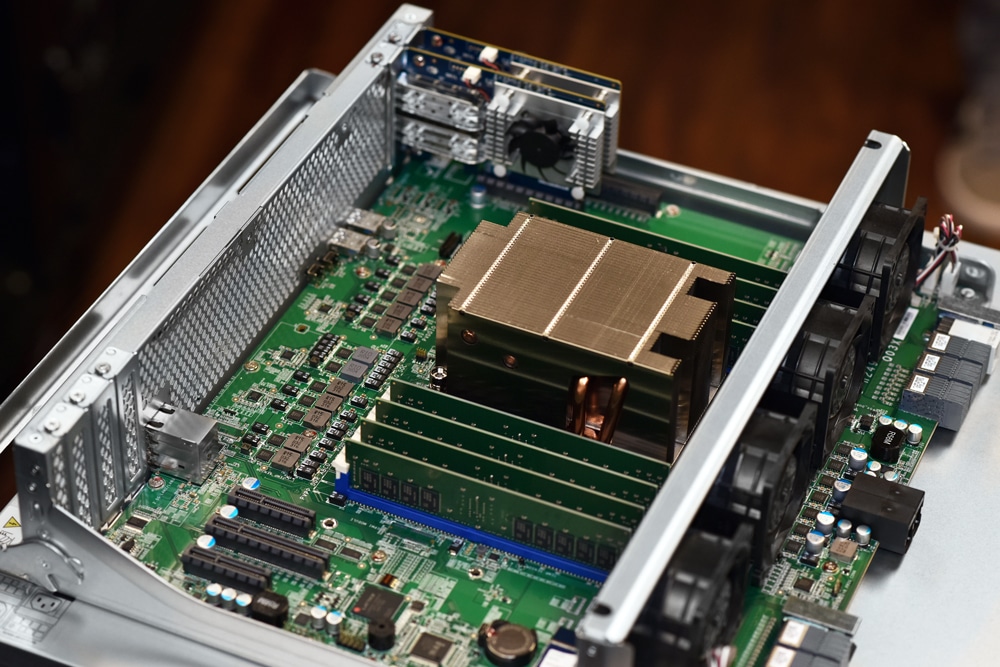
Opening up the NAS we see the AMD EPYC CPU near the rear. We can access more PCIe slots as well.
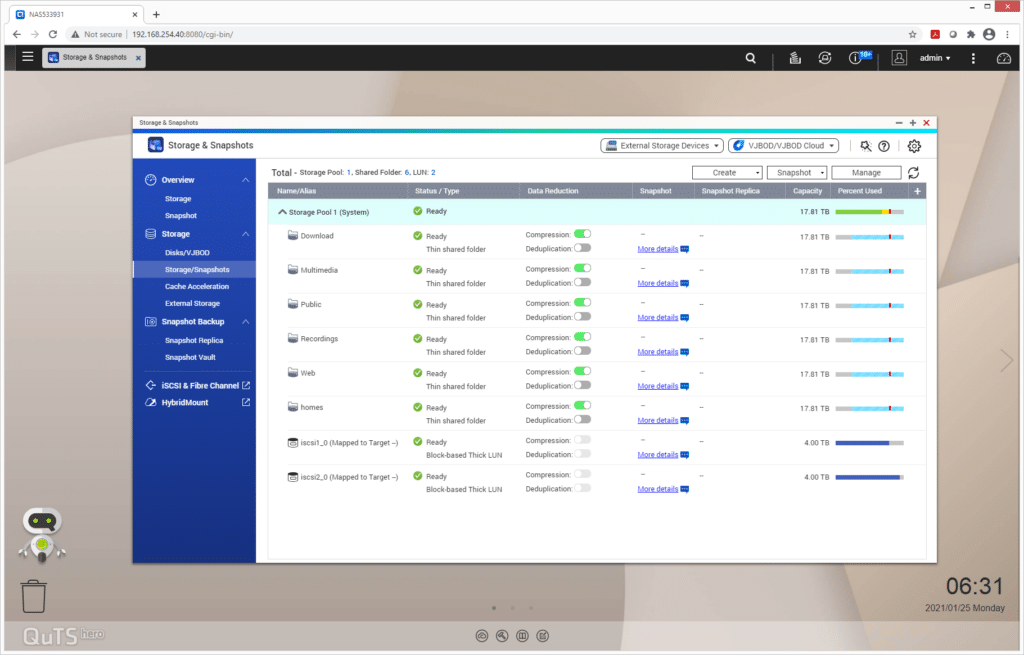
Interface
The ZFS-based QuTS hero operating system is designed specifically for QNAP’s business line of NAS solutions, highlighted by its combination of the app-based QTS with a 128-bit ZFS file system. This allows QNAP to offer flexible storage management as well as inline deduplication, inline compression, and inline compaction. This helps to provide more effective use of storage resources while promoting self-healing to increase reliability and maintain data integrity.
For example, QuTS hero supports near-limitless snapshots (up to 65,535 snapshots for iSCSI LUN) and shared folders. Moreover, its use of copy-on-write technology makes snapshots extremely fast and will not affect ongoing data transmission.
QNAP TS-h2490FU Performance
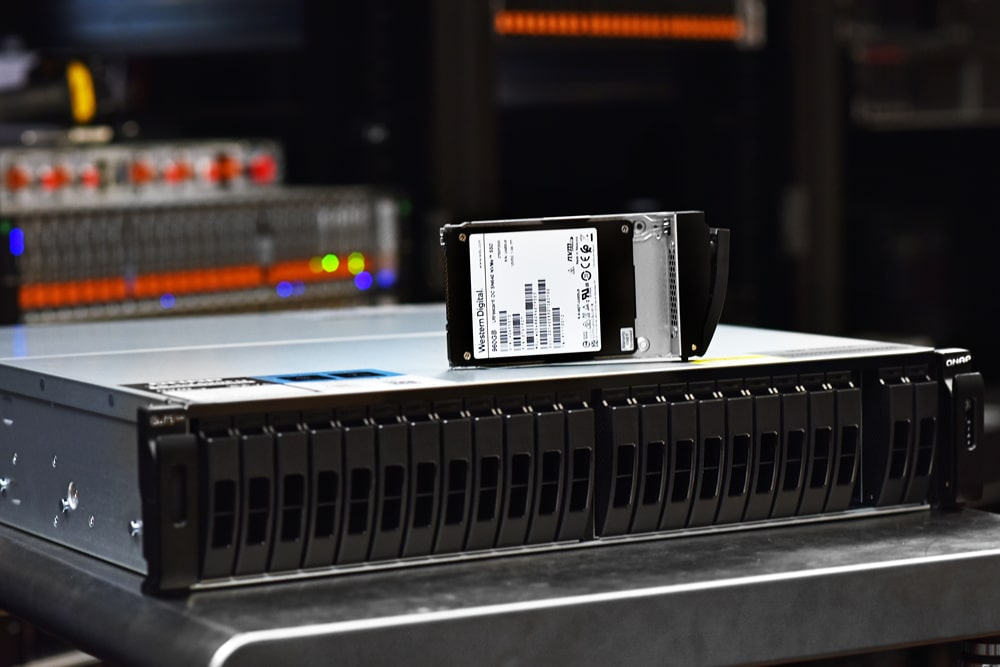
We tested the QNAP TS-h2490FU using a RAID50 configuration, populating the system with 24x WDC Ultrastar DC SN640 NVMe SSDs (960GB). In networking, we ultimately leveraged 10GbE through the four SFP+ ports in the rear. We couldn’t get the NICs to establish a 25GbE connection to our Dell Z9100 switch and fanout cables, while it did negotiate and connect when routed through 10GbE cables. In practice though while this may limit peak sequential workloads, it won’t have an impact on mixed workloads that operate well under that threshold.
SQL Server Performance
StorageReview’s Microsoft SQL Server OLTP testing protocol employs the current draft of the Transaction Processing Performance Council’s Benchmark C (TPC-C), an online transaction processing benchmark that simulates the activities found in complex application environments. The TPC-C benchmark comes closer than synthetic performance benchmarks to gauging the performance strengths and bottlenecks of storage infrastructure in database environments.
Each SQL Server VM is configured with two vDisks: 100GB volume for boot and a 500GB volume for the database and log files. From a system resource perspective, we configured each VM with 16 vCPUs, 64GB of DRAM and leveraged the LSI Logic SAS SCSI controller. While our Sysbench workloads tested previously saturated the platform in both storage I/O and capacity, the SQL test looks for latency performance.
SQL Server Testing Configuration (per VM)
- Windows Server 2012 R2
- Storage Footprint: 600GB allocated, 500GB used
- SQL Server 2014
-
- Database Size: 1,500 scale
- Virtual Client Load: 15,000
- RAM Buffer: 48GB
- Test Length: 3 hours
-
- 2.5 hours preconditioning
- 30 minutes sample period
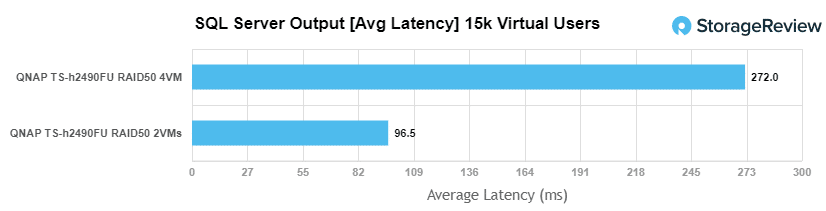
For SQL Server average latency the QNAP TS-h2490FU saw an aggregate latency of 96.5µs at 2VMs and 272µs at 4VMs.
Sysbench MySQL Performance
Our first local-storage application benchmark consists of a Percona MySQL OLTP database measured via SysBench. This test measures average TPS (Transactions Per Second), average latency, and average 99th percentile latency as well.
Each Sysbench VM is configured with three vDisks: one for boot (~92GB), one with the pre-built database (~447GB), and the third for the database under test (270GB). From a system resource perspective, we configured each VM with 16 vCPUs, 60GB of DRAM and leveraged the LSI Logic SAS SCSI controller.
Sysbench Testing Configuration (per VM)
- CentOS 6.3 64-bit
- Percona XtraDB 5.5.30-rel30.1
-
- Database Tables: 100
- Database Size: 10,000,000
- Database Threads: 32
- RAM Buffer: 24GB
- Test Length: 3 hours
-
- 2 hours preconditioning 32 threads
- 1 hour 32 threads
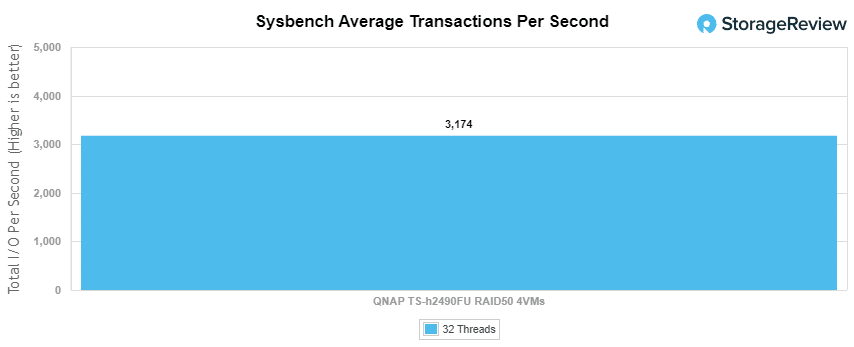
With the Sysbench OLTP, we saw an aggregate score of 3,174 TPS for 4VMs.
With Sysbench average latency, the QNAP TS-h2490FU recorded an aggregate score of 40.31µs for 4VMs.
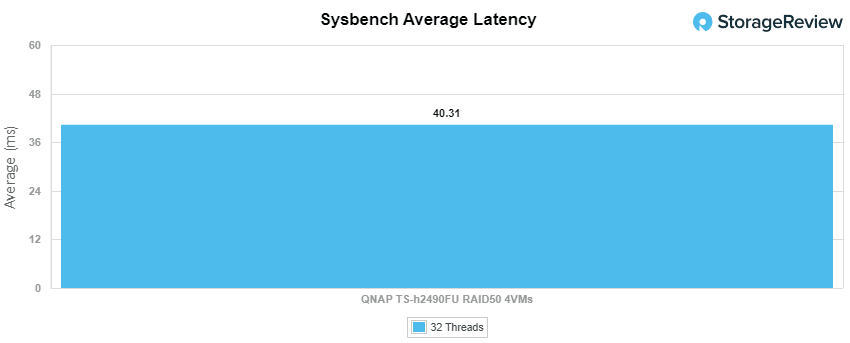
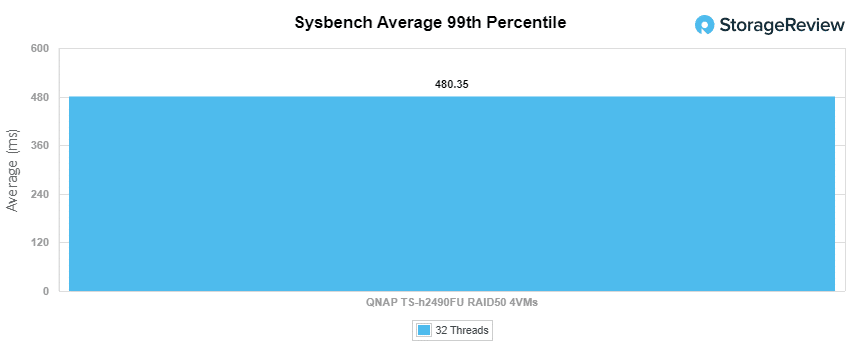
For our worst-case scenario latency (99th percentile) the QNAP TS-h2490FU had an aggregate score of 480.35µs for 4VMs.
VDBench Workload Analysis
When it comes to benchmarking storage arrays, application testing is best, and synthetic testing comes in second place. While not a perfect representation of actual workloads, synthetic tests do help to baseline storage devices with a repeatability factor that makes it easy to do apples-to-apples comparison between competing solutions.
These workloads offer a range of different testing profiles ranging from “four corners” tests, common database transfer size tests, as well as trace, captures from different VDI environments. All of these tests leverage the common vdBench workload generator, with a scripting engine to automate and capture results over a large compute testing cluster. This allows us to repeat the same workloads across a wide range of storage devices, including flash arrays and individual storage devices.
Profiles:
- 4K Random Read: 100% Read, 128 threads, 0-120% iorate
- 4K Random Write: 100% Write, 128 threads, 0-120% iorate
- 64K Sequential Read: 100% Read, 32 threads, 0-120% iorate
- 64K Sequential Write: 100% Write, 16 threads, 0-120% iorate
- Synthetic Database: SQL and Oracle
- VDI Full Clone and Linked Clone Traces
Looking at random 4K read, the QNAP TS-h2490FU peaked at 121K IOPS; however, it took a huge hit in latency at the end of the test, reaching roughly 32,233µs.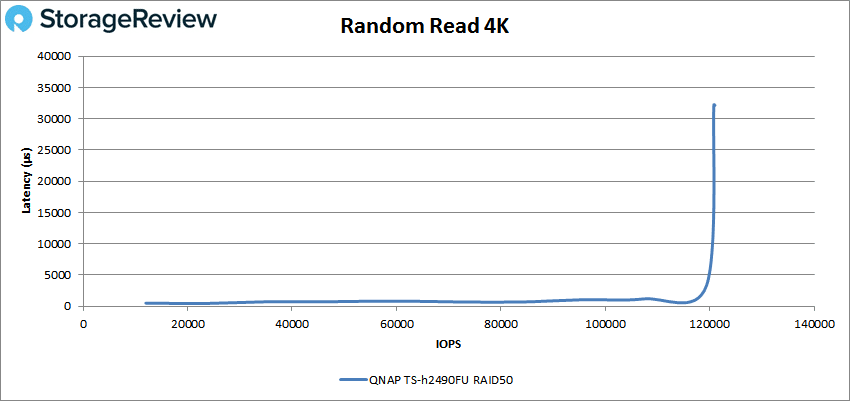
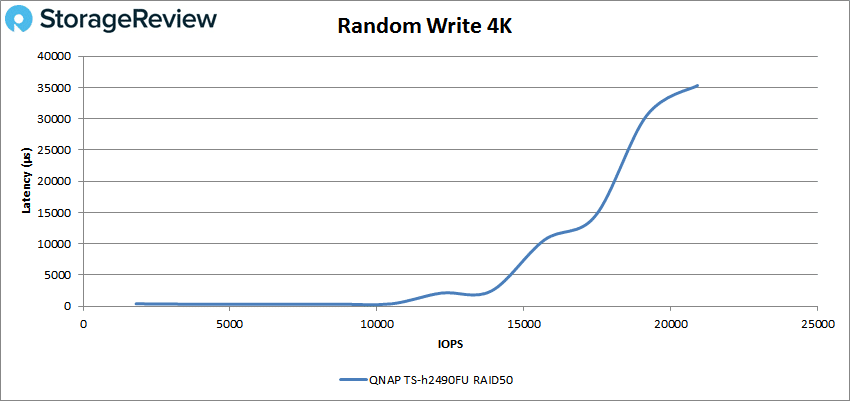
For random 4K write, the server began 18K IOPS with 407μs, remaining with this latency until a little bit after the 10K IOPS mark, where it gradually reached over 35,000µs while peaking at 20,913 IOPS.
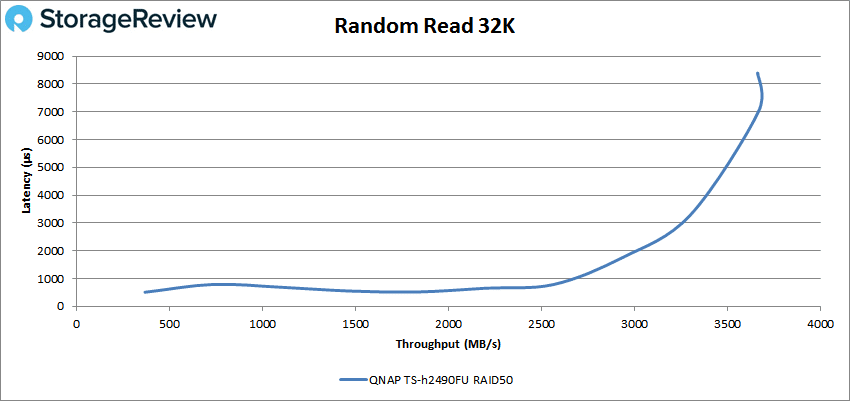
Moving on to 32K, the TS-h2490FU had a peak IOPS of 117,108 (or 3.7GB/s) at 8,395µs.
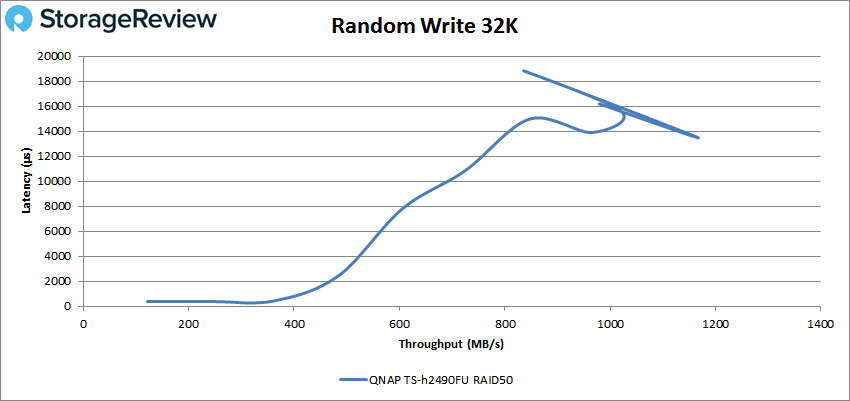
In random 32K write, the TS-h2490FU showed quite a bit of instability at the end of the test, peaking at 37,292 IOPS (or 1.2 GB/s) with a latency of 13,519µs.
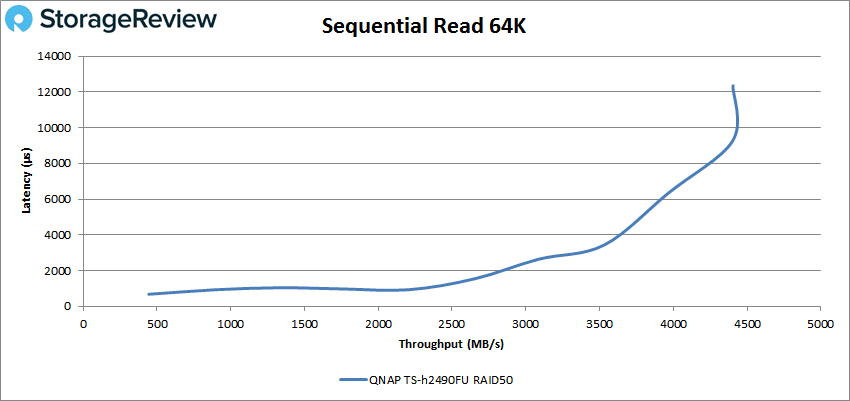
Next is sequential workloads. In 64K sequential read, the TS-h2490FU showed a peak of just under 70,450K IOPS (or 4.4GB/s) at 12,307μs.
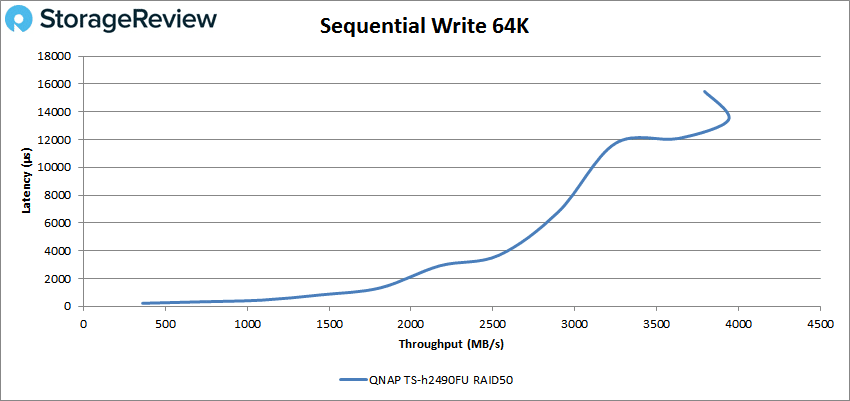
For 64K sequential write, the QNAP server began at 5,802 IOPS (362MB/s) at 218.6μs latency then peaked at roughly 62,991 IOPS or 3.94GB/s at 13,440μs latency before taking a slight hit in performance.
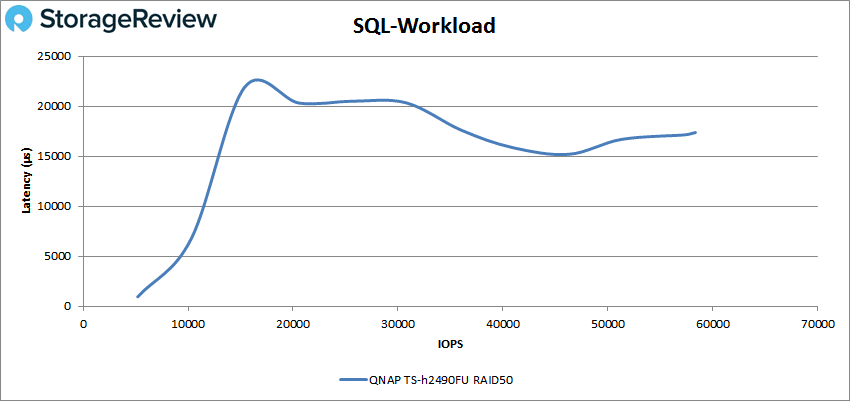
Our next set of tests are our SQL workloads: SQL, SQL 90-10, and SQL 80-20. Starting with SQL, the TS-h2490FU peaked at 58,363 IOPS with a latency of only 17,382μs.
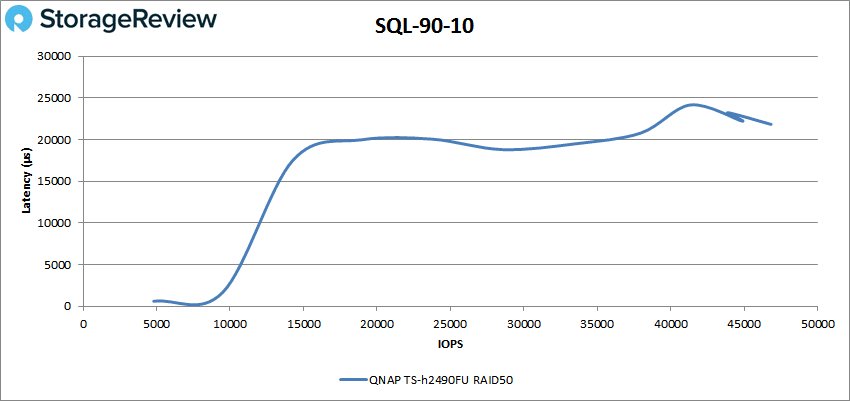
For SQL 90-10, the QNAP server started at around 4,800 IOPS with a latency of 611μs and peaked at 46,836 IOPS with a latency of 21,828μs in latency.
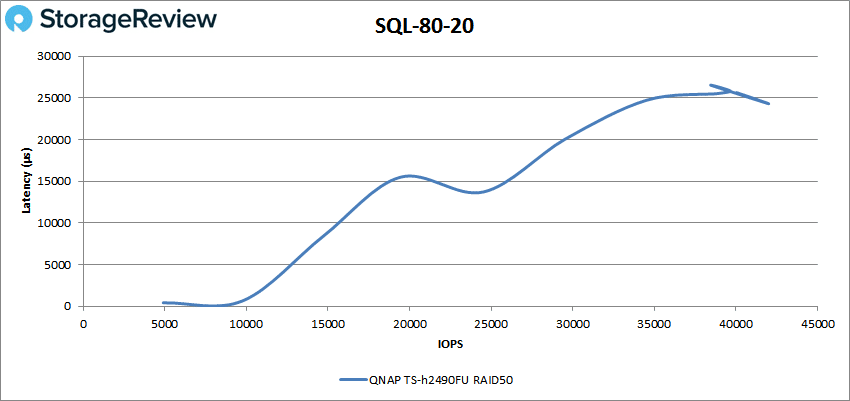
In SQL 80-20, the TS-h2490FU peaked at 41,981 IOPS with 24,321µs in latency.
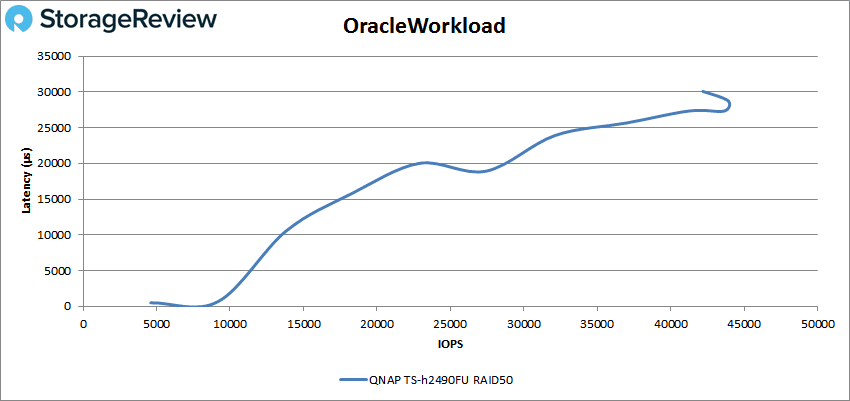
Next up are our Oracle workloads: Oracle, Oracle 90-10, and Oracle 80-20. Starting with Oracle, the TS-h2490FU peaked at 43,916 IOPS with 28,761μs in latency before taking a small hit in performance at the end.
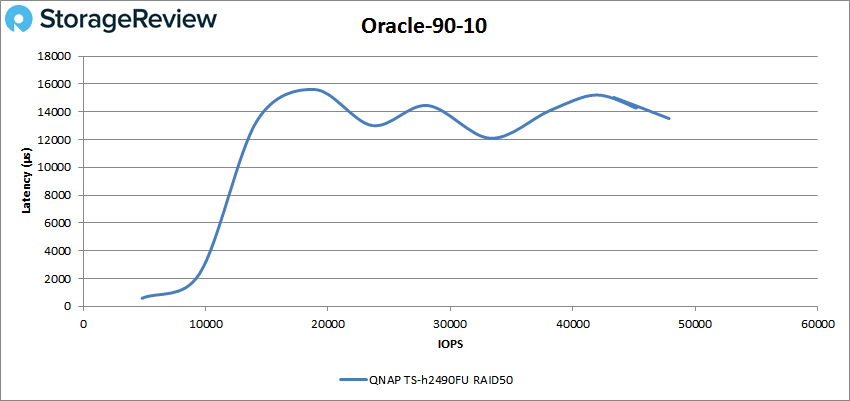
Looking at Oracle 90-10, the QNAP server started at 4,809 IOPS with a latency of 586μs and peaked at 47,872 IOPS with 13,518μs in latency.
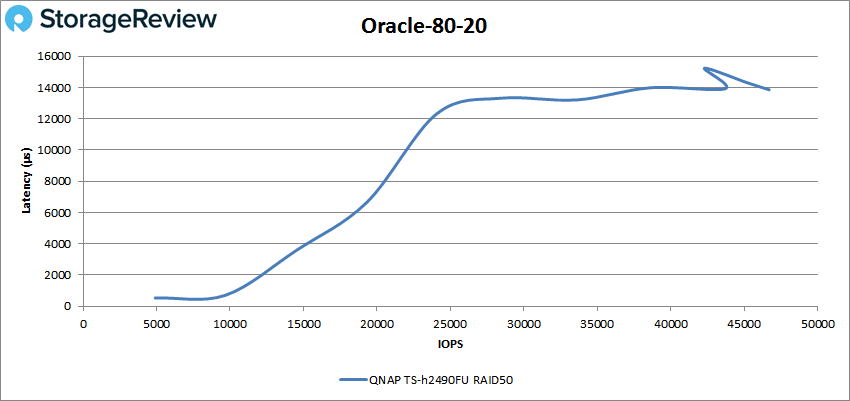
With Oracle 80-20, the TS-h2490FU began at 4,902 IOPS and a latency of 536.3µs, while peaking at 46,709 IOPS and a latency of 13,856μs.
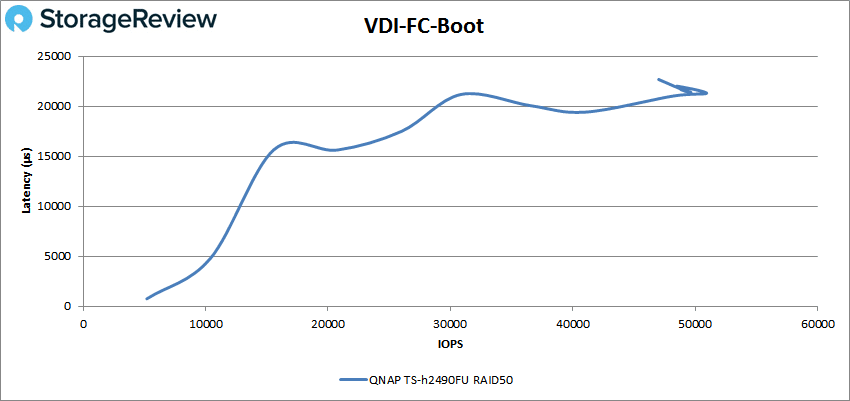
Next, we switched over to our VDI clone test (Full and Linked). Looking at VDI Full Clone (FC) Boot first, the QNAP TS-h2490FU began at 5,199 IOPS and a latency of 758.2μs while peaking at 50,938 IOPS at a latency of 21,304μs.
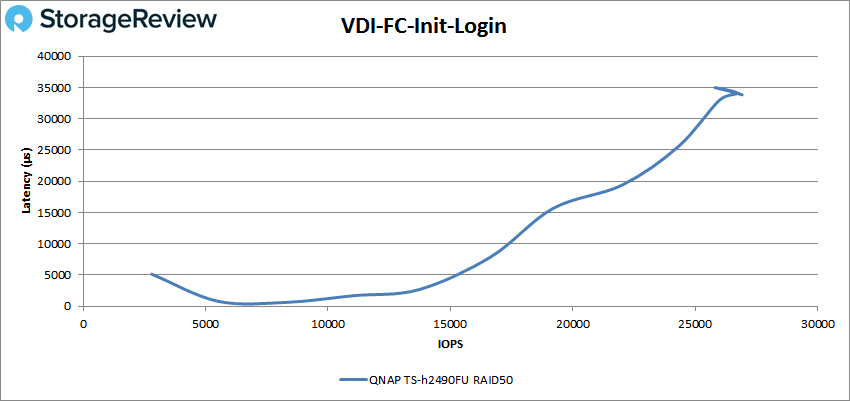
Looking at VDI FC Initial Login, the QNAP server started at 2,801 IOPS and 5,150μs latency, hitting a peak at 26,920 IOPS at 33,837μs.
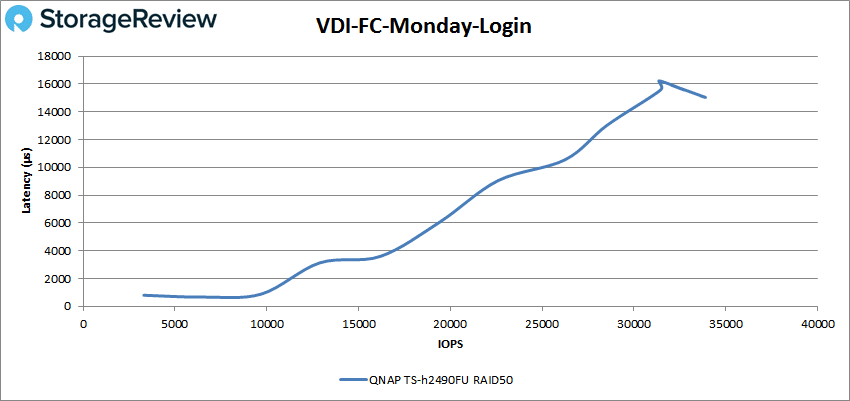
For VDI FC Monday Login, the server started at 3,303 IOPS and 802μs latency while peaking at 33,872 IOPS at 15,050μs.
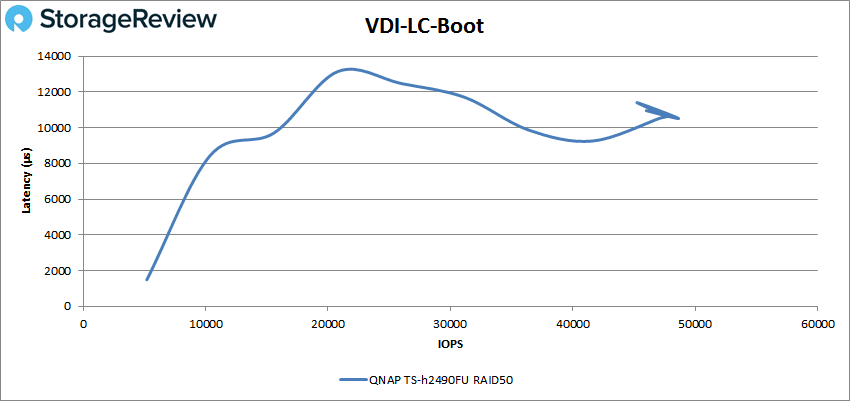
For VDI Linked Clone (LC) Boot, the TS-h2490FU began at 5,195 IOPS with 1,487μs latency, while peaking at 48,645 IOPS at 10,520μs.
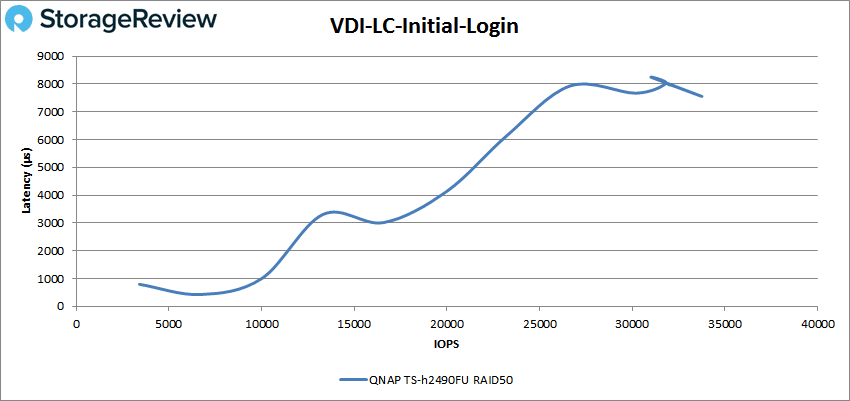
Moving on to VDI LC Initial Login, the TS-h2490FU began at 3,403 IOPS with 794.7μs latency and peaked at 33,750 IOPS at 7,556μs.
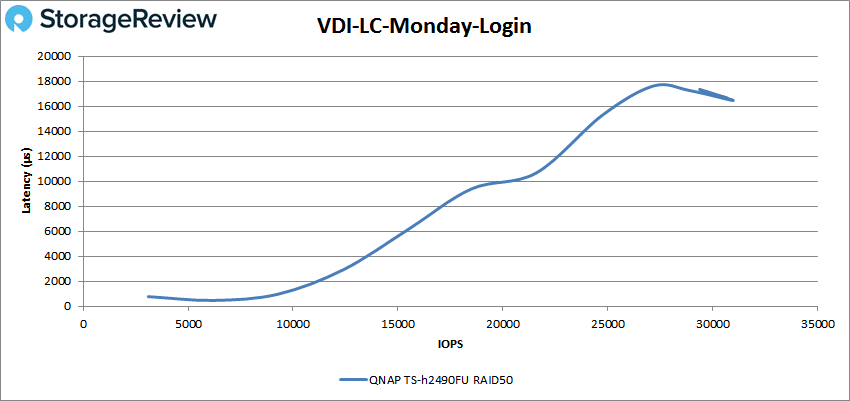
Finally, VDI LC Monday Login had the TS-h2490FU start at 3,100 IOPS and 777.6μs latency while peaking at 30,957 IOPS at 16,468μs before taking a hit in performance at the very end.
Conclusion
The QNAP TS-h2490FU is the latest addition to the company’s QuTS hero line. Sporting a 2U form factor, QNAP states that it is designed more for performance, as it is highlighted by its AMD EPYC 7302P (16-core) processor and all NVMe-flash storage. In addition, this enterprise-grade NAS uses the newer ZFS-based OS (which provides users with inline deduplication, inline compression, and inline compaction), and features up to a generous 256GB of RAM, 24 NVMe SSD bays, and onboard 25GbE SFP28 and 2.5GbE RJ45 connectivity. Users can also leverage the five PCIe expansion slots to further expand the capabilities of the TS-h2490FU, including additional connectivity, storage, and other accessories.
For performance, we ran our Enterprise Synthetic Workload Analysis and tested the TS-h2490FU in a RAID50 configuration, populating the system with 24x 960GB WD Ultrastar DC SN640 NVMe SSDs. First up is was our Application Workload Analysis, where we saw an aggregate of 96.5µs at 2VMs and 272µs at 4VMs for SQL Server average latency. With Sysbench, we saw transactional aggregate scores for 4VMs give us 3,174 TPS, while average latency and worst-case scenarios aggregate scores recorded 40.31µs and 480.34µs, respectively.
Looking at our VDBench Workload Analysis, the TS-h2490FU showed peak highlights that include 121K IOPS 4K read, 18K IOPS for 4K write, 117,108 for 32K read, 86,918 IOPS for 37,292 IOPS write during our random tests, while sequential performance hit 4.4GB/s for 64K read, and 3.94GB/s for 64k sequential write.
With our SQL workloads, the QNAP sever saw peaks of 58,363 IOPS, 46,836 IOPS for 90-10, and 41,98 IOPS for 80-20. Looking at Oracle, we saw peaks of 43,916 IOPS, 47,872 IOPS with 90-10, and 46,709 IOPS for 80-20. Next, we transitioned to our VDI clone test starting with Full Clone, where the QNAP server recorded peaks of 50,938 IOPS in boot, 26,920 IOPS in Initial Login, and 33,872 IOPS for Monday Login. For Linked Clone, we saw 48,645 IOPS for boot, 33,750 IOPS for Initial Login, and 30,957 IOPS for Monday Login.
Overall, the performance was somewhat uneven at times for a 24 NVMe storage configuration, as the TS-h2490FU seemed to have a bit of trouble reaching higher numbers during our tests. With the assortment of 24 NVMe SSDs, we had expected to see higher random transfer numbers and mixed workloads, but this is an area where we’ve seen limitations from ZFS-based platforms in the past. That said, it’s nice to see a QNAP system that supports an all-NVMe build and it’s certainly a good direction for the company (we at StorageReview definitely prefer NVMe as a primary system). In addition, ZFS and QuTS hero allow QNAP to deliver more data integrity and more enterprise-style features, including advanced block-based data reduction technologies and efficient snapshots.
Engage with StorageReview
Newsletter | YouTube | Podcast iTunes/Spotify | Instagram | Twitter | Facebook | RSS Feed