

The Microsoft Surface Laptop Ultra for Business is the first Surface laptop built on NVIDIA silicon, and the first RTX Spark system to get a review from us. Our unit carries the full chip: a 20-core Grace Arm CPU, a 6,144-core Blackwell RTX GPU, and 128GB of LPDDR5X unified memory, with the user able to allocate up to 96GB to the GPU. Microsoft’s consumer store lists configurations ranging from $2,599.99 for the 18-core, 24GB, 512GB SSD model up to $5,899.99 for the 20-core, 128GB, 1TB model. Pricing for our business configuration was not available at the time of this review.
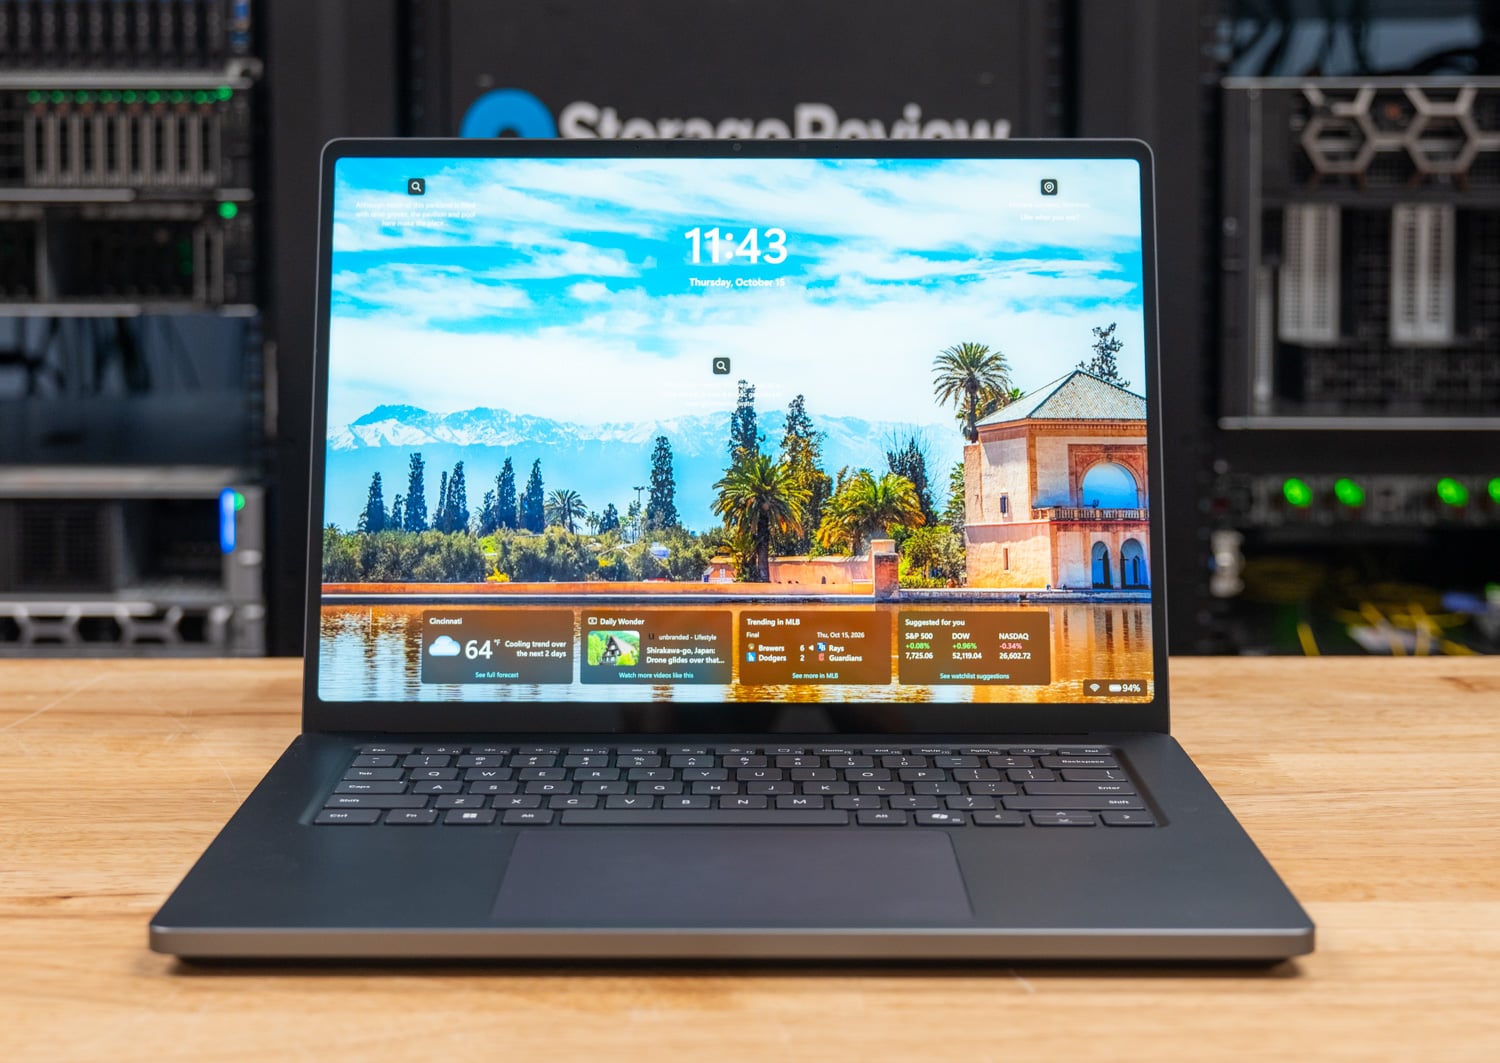
This review covers what the N1X does on a benchmark bench: local AI, CPU, memory, gaming, thermals, and storage, against four current x64 notebooks spanning Intel Panther Lake and Arrow Lake H, AMD Strix Point, and NVIDIA’s RTX 5090 and RTX PRO 2000 laptop GPUs. Design, display, keyboard, battery life, and the rest of the hardware impressions are held for a follow-up once the lab finishes with the chassis, so what follows is the platform and the numbers.
The 20-core N1X won nearly every multi-threaded CPU test in the group, usually by 30 percent or more, and it lets the user hand the NVIDIA GPU 64GB of memory, more than any NVIDIA laptop GPU before it, which is what runs a 35B-parameter model at a usable speed. That said, a sustained all-core double-precision solve cut this laptop’s power three times in one evening, after an earlier review unit failed the same way and had to be replaced, so the thermals section is more critical than usual.
Puntos Clave
- 64GB of GPU memory, adjustable up to 96GB, changes what runs: gpt-oss:20b and Qwen3.6-35B-A3B both load and generate at 58 to 89 tokens per second; the Blade 16’s RTX 5090 is 2.3x faster on anything that fits in 24GB and sits out the larger models.
- The fastest multi-core CPU in the group: 6,963 in Cinebench 2026 multi-core, 34 percent ahead of the Razer Blade 16 and 47 percent ahead of the Dell Pro Precision 5 16S, with LLVM compiling in 206 seconds against 327 for the next-fastest system.
- 122GB/s of memory bandwidth, at a latency cost: STREAM Triad reached 122,114MB/s, 48 percent more than the Precision 5 16S, while memory latency of 251 ns and core-to-core latency of 172 ns were the worst in the group and show up in single-threaded work.
- One workload cuts the power: the all-core OpenBLAS LU solve at N=20000 powered the unit off three times on October 14, at 95 C after the chip had held 98 C for 31 minutes in other tests. Two Surface Laptop Ultra units have now failed identically; the log evidence points at power delivery or firmware protection, not heat.
- Windows on Arm caps random I/O: the Gen5 SK hynix drive reads 14.1GB/s sequentially and 1.67M IOPS from the raw device, but through NTFS and BitLocker 4K random I/O stops near 300K IOPS, under half the x64 systems.
The RTX Spark N1X Platform
RTX Spark is NVIDIA’s name for the Windows PC family built on the N1X superchip, the laptop and compact desktop sibling of the GB10 in Chispa DGX. We covered the family at Computex in June y conectar launch details at pre-order last week, so this section covers what matters for understanding the results.

NVIDIA offers two laptop N1X variants; the top bin pairs a 20-core Grace CPU with a 6,144-core Blackwell RTX GPU and up to 128GB of LPDDR5X; the second pairs an 18-core CPU with a 5,120-core GPU and tops out at 64GB. Both carry a 45 to 80W TDP covering CPU and GPU together, against 140W for the desktop N1X and the GB10. Our Surface has the 20-core CPU, which Windows reports as 10 faster cores and 10 efficiency cores with no SMT.
The memory is what sets the platform apart from every x64 laptop in this review, because one 128GB pool of LPDDR5-9400 serves both halves of the chip over NVLink-C2C, and on a 256-bit interface 9,400 MT/s works out to about 300GB/s of theoretical bandwidth. Windows presents it like a discrete card, with a fixed dedicated allocation and a shared pool.
On our unit, we set the split to 64/64: the suite measured 62.5GB of GPU-usable memory, which qualifies the laptop for both of our local AI model tiers. The LPDDR5X amount is user-adjustable through the NVIDIA app, though it’s obviously limited by the total amount chosen when you buy the system. So a 32GB or 48GB Surface will not see the same results in AI benchmarking if you can’t fit that same larger model into memory.
The GPU is Blackwell with fifth-generation Tensor Cores and fourth-generation RT cores, one ninth-generation NVENC and one sixth-generation NVDEC, and NVIDIA’s usual “up to 1 petaflop” of FP4 compute, which Microsoft’s footnotes describe as theoretical FP4 TOPS with sparsity. Every NVIDIA-side test in this review ran on CUDA through native Arm64 builds of llama.cpp and Ollama, with the driver as shipped, version 32.0.16.1742.
Windows is the other important half of the platform. The Surface runs Windows 11 Pro 26H1 on Arm64, so x64 applications run through Prism emulation, and we built our entire client suite with native Arm64 binaries so that the CPU results compare silicon, not translation layers. Where a native Arm64 port is immature, or an x64 build is the only option, we indicate that in the results, because those cases determine several of the rows below.
Microsoft Surface Laptop Ultra for Business Specifications

| Especificación | Microsoft Surface Laptop Ultra for Business |
|---|---|
| Descripción general de la plataforma | |
| Procesador | NVIDIA RTX Spark N1X, 20-core Grace CPU with 6,144-core Blackwell RTX GPU (as tested) NVIDIA RTX Spark N1X, 18-core Grace CPU with 5,120-core Blackwell RTX GPU |
| NPU | NPU de NVIDIA |
| Salud Cerebral | 24GB, 32GB, 48GB, 64GB, or 128GB LPDDR5X unified memory 128GB LPDDR5-9400, 64/64GB firmware split (as tested) |
| Almacenaje | Removable SSD: 512GB (PCIe Gen4), 1TB or 2TB (PCIe Gen5) 1TB SK hynix HFS001TFM9X189N, Gen5 x4 (as tested) |
| Sistema operativo | Windows 11 Pro (Arm64); Windows 11 Home on the 24GB configuration |
| Pantalla y E/S | |
| Mostrar | 15-inch PixelSense Ultra touchscreen, 3270 x 2180, up to 120Hz, 100% DCI-P3, Dolby Vision IQ 1,000 nits SDR (typical), 2,000 nits HDR peak (Microsoft figures) |
| Puertos | 2x USB-C / USB4 1x USB-C / USB4 with Magnetic Connect 1x HDMI 2.1b 1 puertos USB-A 3.1 lector de tarjetas SD toma de auriculares 3.5mm |
| Conectividad | Wi-Fi 7 (MediaTek MT7925), Bluetooth |
| Cámara | 1080p Full HD |
| Poder y físico | |
| Battery Life (Microsoft claims) | Up to 15 hours local video playback Up to 12 hours active web usage (preproduction 20-core, 64GB, 1TB unit at 150 nits) |
| Carga | USB-C; fast charging with a 115W or higher Surface or USB-C PD supply |
| Peso | 4.41 libras (2.0 kg) |
| Color | Platinum, Nightfall |
| Seguridad y precios | |
| Seguridad | Secured-core PC, Windows Hello, device encryption (BitLocker XTS-AES-128 on our unit) |
| Price (Microsoft consumer store) | $2,599.99 (18-core, 24GB, 512GB) to $5,899.99 (20-core, 128GB, 1TB, as tested) |


Configuración de prueba y metodología
Our review unit runs the RTX Spark N1X with its 6,144-core Blackwell GPU, 128GB of LPDDR5-9400 split 64/64 between system and GPU, and a 1TB SK hynix Gen5 SSD on Windows 11 Pro 26H1 (Arm64), with benchmarks tested on the Best performance power mode and plugged in. Battery life testing will be added later with the rest of the hardware impressions.

Every system in this comparison went through sr-client 1.2, our scripted Windows client benchmark suite, on its full run and Peak profile. Each system was tested on its factory Windows image with the OEM’s drivers and utilities, set to the vendor’s top performance mode and plugged in. The suite applies the same lab settings: Windows power mode at Best performance, display at 50 percent brightness, all sleep and display-off timers disabled, and Windows Firewall and UAC prompts off. The run is unattended from start to finish; each result is the median of repeated passes, and the suite reruns a test whose spread exceeds 2 percent before accepting it.
The suite was written with native Arm64 and x64 binaries for every open-source workload so that the Surface competes on silicon.
| Sistema | CPU | Salud Cerebral | GPU used for GPU and AI tests | SSD | OS and performance mode |
|---|---|---|---|---|---|
| Microsoft Surface Laptop Ultra | NVIDIA RTX Spark N1X, 20C / 20T | 128GB LPDDR5-9400 (64/64 split) | 6,144-core Blackwell RTX (integrated, 62.5GB usable) | SK hynix HFS001TFM9X 1TB, Gen5 x4 | Windows 11 Pro 26H1 (Arm64), Best performance |
| Dell Pro Precision 5 16S | Intel Core Ultra X9 388H, 16C / 16T | 64GB LPDDR5-8533 | Intel Arc Pro B390 (integrated) | SK hynix PCB01 1TB, Gen5 x4 | Windows 11 Pro 25H2 (x64), Dell Optimizer Ultra Performance |
| Dell Pro 7 14 | AMD Ryzen AI 9 HX PRO 470, 12C / 24T | 64GB LPDDR5-8000 | AMD Radeon 890M (integrated, 32GB VGM) | Samsung BM9C1a 1TB, Gen4 x4 | Windows 11 Pro 25H2 (x64), Dell thermal profile Performance |
| Razer Hoja 16 | AMD Ryzen AI 9 HX 370, 12C / 24T | 32GB LPDDR5-8000 | NVIDIA GeForce RTX 5090 Laptop GPU, 24GB | Samsung MZVL22T0 2TB, Gen4 x4 | Windows 11 Home 25H2 (x64), Razer Synapse Performance |
| Dell Pro Max 14 Premium | Intel Core Ultra 9 285H, 16C / 16T | 64GB LPDDR5-8400 | NVIDIA RTX PRO 2000 Blackwell Laptop GPU, 8GB | SK hynix PC811 2TB | Windows 11 Pro 25H2 (x64), Dell Optimizer Ultra Performance |
Three labels recur in the tables, and the difference between the first two matters for reading the AI section. DNF means the test started on that system and did not finish, or was skipped after a failure, which in this review applies to the Surface’s OpenBLAS run and the Dell Pro 7 14’s agentic MLPerf scenarios.
Not run means the suite declined to start a test because the hardware does not qualify, most often because a model exceeds the GPU memory the system can offer; the Dell Pro Max 14 Premium’s 7.7GB of usable GPU memory keeps it out of every model-load and agent test, and the Blade 16’s 24GB keeps it below our tier M models. N/A means the test does not apply, such as SMT single-core on a chip without SMT.
Local AI Performance
Local AI on these notebooks comes down to two questions: how fast the GPU can run a model, and whether the model fits at all. The Blade 16’s RTX 5090 answers the first better than anything else here, generating tokens at about 2.3x the Surface’s rate on every model that fits in its 24GB. The Surface answers the second, because with 64GB of its unified memory handed to the GPU, it’s the only system that runs our tier M models at a usable speed.
The Pro Max 14’s 8GB RTX PRO 2000 keeps up with the Surface on small models and is too small for the larger ones, and the two integrated-GPU x64 systems run everything, albeit slowly.
MLPerf Client v2.0
MLPerf Client runs Llama 3.1 8B and Phi-4-mini through five prompt categories (content generation, creative writing, summarization, structured text, and code analysis) and reports time to first token and the token rate after the first token as a geometric mean across them. Each system uses its vendor’s GPU path: Intel OpenVINO on the Precision 5 16S, AMD’s Windows ML with DirectML on the Pro 7 14, and llama.cpp with CUDA on the three NVIDIA systems, so the engines differ and the rows compare platforms as delivered.

| MLPerf Client v2.0 | Surface Laptop Ultra | Dell Pro Precision 5 16S | Dell Pro 7 14 | Razer Hoja 16 | Dell Pro Max 14 Premium |
|---|---|---|---|---|---|
| Llama 3.1 8B, time to first token, geomean (s, lower is better) | 0.284 | 0.214 | 3.140 | 0.149 | 0.439 |
| Phi-4-mini, time to first token, geomean (s, lower is better) | 0.127 | 0.181 | 1.954 | 0.074 | 0.212 |
| Data Analyst Agent, end-to-end (s, lower is better) | 52.6 | 84.7 | DNF | 27.8 | 61.8 |
| Data Analyst Agent, token rate (tok/s) | 48.9 | 25.6 | DNF | 108.3 | 45.4 |
| SWE Agent, end-to-end (s, lower is better) | 46.0 | 65.6 | DNF | 24.6 | 52.6 |
| SWE Agent, token rate (tok/s) | 46.4 | 25.0 | DNF | 102.5 | 42.8 |
The Blade 16 generated Llama 3.1 8B at 128.8 tok/s and Phi-4-mini at 222.7 tok/s, 2.3x the Surface’s 56.4 and 97.5. The Pro Max 14’s RTX PRO 2000, with a fraction of the 5090’s bandwidth, still came within 5 percent of the Surface on Llama 3.1 and under 12 percent on Phi-4-mini, which suggests N1X’s integrated GPU is paced like a small discrete card on models this size.
Of the integrated x64 GPUs, the Precision 5 16S’s Arc Pro B390 produced a quick first token on Llama 3.1 but at half the Surface’s token rate, and the Pro 7 14’s DirectML path was slowest and spent 3.1 seconds on the first token.
MLPerf’s agentic scenarios run Llama 3.1 8B as a software engineering agent and a data analyst agent, each calling tools across multiple turns. The Blade 16 completed both in under 28 seconds, half the Surface’s time and under a third of the Precision 5 16S’s. The Pro 7 14 did not finish either scenario: DirectML ran out of memory on the agentic prompts even with 32GB reserved for the GPU, which is a failure in the run and is marked DNF for that reason.
Cargando modelo
This test times a local model from SSD to its first generated token in Ollama, cold (file cache flushed) and warm (file already in memory), and reports how fast the SSD was read while it happened. Tier S uses gpt-oss:20b (12.8GB) on systems with at least 16GB of GPU-usable memory; tier M adds Qwen3.6-35B-A3B (21.1GB) on systems with about 40GB or more. The swap test loads Qwen3.6, switches to gpt-oss, and times the return to Qwen3.6.

| Model loading (memory mapping on) | Surface Laptop Ultra | Dell Pro Precision 5 16S | Dell Pro 7 14 | Razer Hoja 16 | Dell Pro Max 14 Premium |
|---|---|---|---|---|---|
| gpt-oss:20b, read throughput during cold load (MB/s) | 3,080 | 3,251 | 1,246 | 3,874 | Not run (7.7GB GPU memory) |
| Qwen3.6-35B-A3B, reload after model swap (s, lower is better) | 5.01 | 13.38 | 22.38 | Not run (24GB VRAM, below tier M) | Not run (7.7GB GPU memory) |
Cold loads are a storage test, and the two Gen5 systems led them: the Precision 5 16S brought gpt-oss:20b to its first token in 5.98 seconds and the Surface in 6.57. The Surface won every warm and tier M row, and its 5.0-second return to Qwen3.6 after a swap, against 13.4 seconds on the Precision, is the advantage of keeping both models resident in 64GB of GPU memory. The Blade 16 read the model file fastest at 3.9GB/s but reached first token later, because the weights have to cross PCIe into VRAM, while unified memory systems have them in place as soon as they are read.
The rows the Blade 16 and Pro Max 14 are missing are a memory question. The Blade 16 does not qualify for tier M with 24GB of VRAM, and the Pro Max 14’s 7.7GB of usable GPU memory qualifies for no tier at all, so the suite never started those tests on them. The Pro 7 14’s SSD, whose write problem the storage section covers, read at only 1.2GB/s here and took 13.7 seconds cold.
Agente de codificación
Codex CLI drives a local model served by Ollama through a fixed coding task in a pinned repository; a run succeeds when the repository’s 11 tests pass. We report the median wall time of three runs, how many succeeded, and the generation rate. The agent-beside-user test runs the agent and Speedometer together and reports how much each slows down compared to doing it alone, which is the question that matters if the agent is working while you are.

| Codex CLI coding agent | Surface Laptop Ultra | Dell Pro Precision 5 16S | Dell Pro 7 14 | Razer Hoja 16 | Dell Pro Max 14 Premium |
|---|---|---|---|---|---|
| Tier S, gpt-oss:20b 64K: wall time (s, lower is better) | 191.8 | 584.2 | 376.0 | 64.4 | Not run (7.7GB GPU memory) |
| Tier S: successes (of 3) | 3 | 3 | 2 | 2 | Not run |
| Tier M, gpt-oss:20b 128K: wall time (s, lower is better) | 87.5 | 276.1 | 585.4 | Not run (below tier M) | Not run |
| Tier M, gpt-oss:20b 128K: successes (of 3) | 2 | 2 | 3 | Not run | Not run |
| Tier M, Qwen3.6-35B-A3B 64K: wall time (s, lower is better) | 88.6 | 351.7 | 678.2 | Not run (below tier M) | Not run |
| Tier M, Qwen3.6-35B-A3B 64K: successes (of 3) | 3 | 3 | 3 | Not run | Not run |
| Speedometer beside the agent (score) | 18.1 | 26.6 | 19.2 | 36.3 | Not run |
| Speedometer slowdown beside the agent (x, lower is better) | 1.92 | 1.61 | 1.92 | 1.06 | Not run |
| Agent slowdown beside Speedometer (x, lower is better) | 1.10 | 1.00 | 1.11 | 1.05 | Not run |
The Blade 16 finished the tier S task in 64 seconds at 137.9 tok/s, three times faster than the Surface and nine times faster than the Precision 5 16S, though it passed two of three runs to the Surface’s and Precision’s three. In tier M, the Surface completed both tasks in under 90 seconds, three to four times quicker than the Precision 5 16S and seven to eight times quicker than the Pro 7 14, which needed 10 to 11 minutes per task. Wall time also depends on how many tool calls the model makes, so the generation rate is the cleaner hardware number.
The concurrency test is where a discrete GPU shines. With the agent running, the Blade 16’s browser score fell 6 percent because the model lives on the RTX 5090 and leaves the CPU alone. On the Surface, where the agent shares the integrated GPU and the memory bus with everything else, Speedometer nearly halved, from 34.7 to 18.1, and the Pro 7 14 lost the same share. The agent itself barely noticed the browser on any system.
Generación aumentada de recuperación
Our RAG test embeds 20,963 SQuAD v1.1 passages with nomic-embed-text, retrieves the top five passages for each of 2,000 questions, and answers them with Phi-4-mini, scoring exact match and F1 against the reference answers. The same small models run on every system, so this is a pure speed comparison.

| RAG | Surface Laptop Ultra | Dell Pro Precision 5 16S | Dell Pro 7 14 | Razer Hoja 16 | Dell Pro Max 14 Premium |
|---|---|---|---|---|---|
| Ingest wall time, 20,963 passages (s, lower is better) | 189.8 | 271.7 | 425.9 | 131.0 | 153.9 |
| Retrieval query time, p50 (ms, lower is better) | 23.4 | 22.2 | 31.3 | 20.9 | 21.6 |
| Answer, Phi-4-mini time to first token, p50 (s, lower is better) | 0.161 | 0.855 | 1.527 | 0.109 | 0.260 |
| Answer, prompt processing (tok/s) | 6,955 | 2,151 | 863 | 11,560 | 4,031 |
| Question to answer, p50 (s, lower is better) | 0.235 | 0.997 | 1.688 | 0.159 | 0.341 |
| Answer F1 (%) | 73.97 | 74.24 | 74.36 | 74.47 | 74.40 |
The Blade 16 ingested the corpus in 131 seconds and answered a typical question in 0.16 seconds, six times faster than the Precision 5 16S. The Pro Max 14 placed second in ingest at 154 seconds, ahead of the Surface’s 190, because 8GB is plenty for an embedding model and Phi-4-mini. Accuracy was identical within half a point of F1 on every system, as it should be with the same models at temperature 0, so the only thing that separates these notebooks in RAG is how long you wait.
Rendimiento de CPU
Two platforms define the CPU results, because the Surface’s 20-core N1X wins nearly every multi-threaded test, often by 30 percent or more, while the Core Ultra X9 388H in the Dell Pro Precision 5 16S is the fastest x64 CPU on a single thread and leads the Python, browser, and OpenBLAS work. Between them, the Razer Blade 16’s Ryzen AI 9 HX 370 takes Stockfish and GROMACS and holds second place in most rendering and build tests, and the Dell Pro 7 14 and Dell Pro Max 14 Premium trail in all-core work.
Cinebench 2026 and Sustained Load
Cinebench 2026 renders a scene with Maxon’s Redshift engine on the CPU and scores single-core, SMT single-core (two threads on one physical core), and multi-core throughput. We follow it with a sustained loop that repeats the multi-core run for about 30 minutes and compares the steady-state score to the first pass, which shows how much a notebook gives back once it heat-soaks.

The Surface scored 6,963 multi-core, 34 percent ahead of the Blade 16 and 47 percent ahead of the Precision 5 16S, and edged the Precision for the single-core lead at 558.5 to 534.8. SMT single-core applies only to the two AMD chips, where the second thread adds 33 percent on the Pro 7 14 and 38 percent on the Blade 16.
The sustained loop separates the field more than the raw scores do. The Surface finished its ten passes at 7,016, 1 percent above where it started, with the CPU pinned at 98 C and 3.28GHz the whole time; the Blade 16 held steady as well. The Pro 7 14 and Pro Max 14 gave up about 2 percent, and the Precision 5 16S dropped 6.2 percent after roughly 10 minutes and stayed there.
| Cinebench 2026 (points, higher is better) | Surface Laptop Ultra | Dell Pro Precision 5 16S | Dell Pro 7 14 | Razer Hoja 16 | Dell Pro Max 14 Premium |
|---|---|---|---|---|---|
| Núcleo simple | 558.5 | 534.8 | 464.4 | 480.0 | 482.6 |
| SMT single core | N/A | N/A | 617.1 | 661.3 | N/A |
| Multi core | 6,963 | 4,739 | 4,028 | 5,179 | 4,160 |
| Sustained loop, first pass | 6,938 | 4,765 | 4,040 | 5,162 | 4,314 |
| Sustained loop, steady state | 7,016 | 4,468 | 3,976 | 5,206 | 4,228 |
| Steady state / first pass | 1.011 | 0.938 | 0.984 | 1.009 | 0.980 |
7-Zip
7-Zip’s built-in benchmark reports LZMA compression and decompression throughput in giga-instructions per second, once on every thread and once pinned to a single core.

The Surface led the all-thread test at 151.0 GIPS, 20 percent ahead of the Blade 16, with its compression rating of 156.9 GIPS 35 percent clear of the next system. The Precision 5 16S led on one thread at 9.8 GIPS.
The Surface’s 7.16 GIPS single-thread figure needs a caveat. On this unit, a core held under load for several minutes drops into a slower state about 20 percent below its initial pace and stays there until the load ends; 7-Zip’s single-thread passes run long enough to trigger it, at 47 to 67 C, so heat is not the cause. The same state carries into the PyPerformance and Stockfish single-thread runs that follow in the suite’s order.
| 7-Zip, one thread (GIPS, higher is better) | Surface Laptop Ultra | Dell Pro Precision 5 16S | Dell Pro 7 14 | Razer Hoja 16 | Dell Pro Max 14 Premium |
|---|---|---|---|---|---|
| Total | 7.16 | 9.80 | 9.01 | 9.24 | 8.84 |
| Comprimir | 4.62 | 8.71 | 6.72 | 7.28 | 7.02 |
| Descomprimir | 9.70 | 10.88 | 11.31 | 11.20 | 10.73 |
Batidora de vaso - Blender
Blender 4.5 renders the three standard benchmark scenes (Monster, Junkshop, and Classroom) with Cycles on the CPU and reports samples per minute.

The order held across all three scenes: Surface, then Blade 16, then Precision 5 16S. The Surface’s margin over the Blade 16 was 47 percent in Monster at 207.6 samples per minute and narrowed to 18 percent in Classroom, the heaviest scene, where it reached 93.2. The Pro 7 14 and Pro Max 14 traded the last two places.
HandBrake
HandBrake encodes 60 seconds of the 4K60 Big Buck Bunny clip in software with x265 (HEVC, medium preset, quality 22) and SVT-AV1 (preset 8, quality 30), reporting frames per second.

The two encoders tell opposite stories about the Surface. Its x265 result of 41.7 fps led the group by 25 percent, but its native Arm64 SVT-AV1 build managed 15.4 fps, roughly a fifth of what the x64 systems produced. The cores that led x265 cannot be five times slower in silicon, so the gap sits in SVT-AV1’s Arm64 code path, and it is the clearest example in our suite of software deciding a result. Among the x64 systems, the Precision 5 16S led SVT-AV1 at 80.8 fps, with the Pro Max 14 and Blade 16 within 5 percent.
LLVM Build
This test compiles the full LLVM 21.1.4 tree with Clang and Ninja at the default job count. It is the longest all-core workload in the suite and leans on memory and storage as well as the CPU.

The Surface compiled LLVM in 206.4 seconds, 37 percent faster than the Blade 16’s 327.0. The Precision 5 16S figure of 340.1 seconds comes from a retest with Smart App Control turned off, because that feature blocked the tool on the first attempt. The Pro 7 14 was slowest at 410.5 seconds.
Stockfish, primesieve, Python, and the Browser
Stockfish’s built-in bench reports chess search speed in millions of nodes per second. primesieve counts the primes below 10^12 on all threads and below 10^11 on one thread, timed in seconds. PyPerformance runs three CPython benchmarks (go, nbody, and regex_compile) pinned to one core and reports the mean time per iteration, and Speedometer 3.1 measures web application responsiveness in Microsoft Edge.
| Prueba | Surface Laptop Ultra | Dell Pro Precision 5 16S | Dell Pro 7 14 | Razer Hoja 16 | Dell Pro Max 14 Premium |
|---|---|---|---|---|---|
| Stockfish bench, all threads (Mnps, higher is better) | 15.51 | 14.81 | 14.71 | 17.96 | 12.01 |
| Stockfish bench, one thread (Mnps, higher is better) | 1.33 | 1.86 | 1.94 | 2.04 | 1.70 |
| primesieve 1e12, all threads (s, lower is better) | 9.82 | 11.31 | 14.80 | 10.60 | 14.30 |
| primesieve 1e11, one thread (s, lower is better) | 12.03 | 9.56 | 6.66 | 6.67 | 9.82 |
| PyPerformance go (ms, lower is better) | 123.9 | 69.2 | 75.9 | 75.2 | 74.1 |
| PyPerformance nbody (ms, lower is better) | 89.8 | 53.2 | 62.3 | 60.8 | 61.3 |
| PyPerformance regex_compile (ms, lower is better) | 94.1 | 65.1 | 71.1 | 69.7 | 69.8 |
| Speedometer 3.1, Edge (score, higher is better) | 34.7 | 42.7 | 36.8 | 38.4 | 42.0 |
Stockfish is one of the few all-core tests the Surface did not win; the Blade 16 led both runs and finished 16 percent ahead on all threads, and the Surface’s one-thread figure carries the slow-core caveat from 7-Zip. primesieve split the other way, with the Surface fastest on all threads at 9.82 seconds and the two AMD CPUs about 30 percent quicker than the Intel systems on one thread.
The Precision 5 16S swept the Python and browser rows, and the Pro Max 14 was within 2 percent of it in Speedometer. The Surface finished last in all four. Its PyPerformance runs follow 7-Zip on the same pinned core and inherit the slow state, and Speedometer runs Edge’s Arm64 build against x64 builds on the others, so these rows measure the Surface’s firmware and software as much as its cores. Single-threaded results on this platform, taken together, sit 15 to 30 percent behind the x64 field even where the slow-core state does not apply, and the memory latency figures below explain part of that.
GROMACS and OpenBLAS
GROMACS runs the benchMEM molecular dynamics case on all cores in four rank-and-thread layouts and reports nanoseconds of simulated time per day; the headline is the best layout. Our OpenBLAS test runs an HPL-style double-precision LU solve at three problem sizes and a DGEMM matrix multiply, each on all cores and again on the top core class alone, and it is the heaviest sustained floating-point load in the suite.
| Prueba | Surface Laptop Ultra | Dell Pro Precision 5 16S | Dell Pro 7 14 | Razer Hoja 16 | Dell Pro Max 14 Premium |
|---|---|---|---|---|---|
| GROMACS benchMEM, best layout (ns/day, higher is better) | 17.29 | 24.87 | 21.58 | 26.41 | 22.74 |
| GROMACS, 1 thread per rank (ns/day) | 17.21 | 25.01 | 21.58 | 26.59 | 0.84 |
| GROMACS, 2 threads per rank (ns/day) | 16.80 | 24.02 | 21.22 | 24.83 | 22.88 |
| OpenBLAS DGEMM M=8000, all cores (GFLOPS, higher is better) | DNF | 527.4 | 358.6 | 455.4 | 367.5 |
| OpenBLAS DGEMM M=8000, top core class (GFLOPS) | DNF | 262.1 | 228.0 | 252.4 | 266.0 |
| OpenBLAS LU N=10000, all cores (GFLOPS) | DNF | 435.3 | 384.3 | 400.9 | 194.2 |
| OpenBLAS LU N=20000, all cores (GFLOPS) | DNF | 503.8 | 375.6 | 454.4 | 327.5 |
| OpenBLAS LU N=40000, all cores (GFLOPS) | DNF | 459.6 | 397.6 | 498.5 | 394.1 |
| OpenBLAS LU N=40000, top core class (GFLOPS) | DNF | 255.2 | 221.9 | 250.9 | 271.6 |
The Blade 16 led every GROMACS layout at 26.4 ns/day, with the Precision 5 16S 6 percent behind. The Surface, dominant elsewhere, was slowest at 17.3 ns/day because GROMACS’s Arm64 build lacks the AVX2 kernels the x64 systems use. The Pro Max 14’s 0.84 ns/day in the one-thread-per-rank layout is a pathological case that spent nearly all its time in inter-rank communication; its best layout, 22.7 ns/day, is the number to compare.
The Surface has no OpenBLAS results. The all-core N=20000 LU solve cut the system’s power three times, and across two notebook samples, so we skipped the step on the final run to let the other 29 complete; the thermals section covers the issue. Among the x64 systems, the Precision 5 16S led all-core DGEMM at 527 GFLOPS and the two smaller LU solves; the Blade 16 took the largest solve, and the Pro Max 14 was fastest on its top core class alone, while adding its efficiency cores dragged its N=10000 result to 194 GFLOPS.
Memory Bandwidth and Latency
STREAM measures sustained memory bandwidth. Memory latency uses a 1GB buffer on 4KiB pages, and core-to-core latency measures the round trip between every pair of cores.

| Latency (ns, lower is better) | Surface Laptop Ultra | Dell Pro Precision 5 16S | Dell Pro 7 14 | Razer Hoja 16 | Dell Pro Max 14 Premium |
|---|---|---|---|---|---|
| Memory latency, 4KiB pages | 251.1 | 115.5 | 146.7 | 129.6 | 170.7 |
| Core-to-core, mean | 171.6 | 88.2 | 49.7 | 57.0 | 58.3 |
| Core-to-core, max | 362.6 | 129.4 | 74.6 | 95.9 | 153.1 |
The Surface’s LPDDR5-9400 delivered 122,114MB/s in STREAM Triad and 130,516MB/s in Copy, 48 percent more than the Precision 5 16S and about 2.6x the two AMD systems, and that bandwidth is a large part of why the N1X wins the rendering and compile tests. The cost is latency: 251 ns to memory and 172 ns on average between cores, both the worst in the group by a wide margin, which is where its single-threaded and latency-sensitive results come from. The Precision 5 16S had the lowest memory latency at 116 ns, and the Pro 7 14 had the tightest core-to-core mesh at 50 ns.
Gaming and GPU Encoding
SuperTuxKart is the only game in this release of the suite, and at 1080p it’s light enough that the result says as much about the CPU and driver as the GPU. It runs its built-in benchmark at 1920×1080 fullscreen on Ultra settings with vsync off, pinned to the discrete GPU where there is one, and reports an average frame rate plus the game’s own typical, mostly stable, and steady figures, which describe progressively lower points on the frame-time distribution. On the Surface, we ran the x64 build under Prism emulation.

The Surface averaged 235.9 fps natively and 264.6 fps running the x64 build under emulation, ahead of the Blade 16’s 200 fps. At these frame rates, the RTX 5090 is nowhere near its limit; the Blade 16 is bounded by its CPU and OpenGL driver, and it runs in hybrid mode with the display attached to the Radeon 890M, which adds a copy per frame.
The more telling result is among the Dells, where the Precision 5 16S’s integrated Arc Pro B390 averaged 166.8 fps against 150.8 for the Pro Max 14’s discrete RTX PRO 2000, and the Pro Max 14 had the lowest steady figure in the group at 53 fps. A heavier title would separate the 5090 from everything else here,.
FFmpeg encodes the same 4K60 clip to HEVC at 8Mb/s with each vendor’s hardware encoder (Intel QSV, AMD AMF, or NVIDIA NVENC), and separately through Windows Media Foundation.
| Hardware HEVC encode (fps, higher is better) | Surface Laptop Ultra | Dell Pro Precision 5 16S | Dell Pro 7 14 | Razer Hoja 16 | Dell Pro Max 14 Premium |
|---|---|---|---|---|---|
| GPU vendor encoder, HEVC 8Mb/s | 135 (NVENC) | 128 (QSV) | 137 (AMF) | 132 (NVENC) | N/A (driver older than the FFmpeg build requires) |
| Media Foundation encoder, HEVC 8Mb/s | 55 | N/A (no HEVC MF encoder found) | 110 | N/A (hybrid graphics) | N/A (hybrid graphics) |
The fixed-function encoders are close to interchangeable at this bitrate, 128 to 137 fps across QSV, AMF, and NVENC, with the Surface’s single ninth-generation NVENC at 135. The Pro Max 14 has no result because NVENC refused to open on its driver, 597.16, which is older than the 617.42 on the other two NVIDIA systems. Media Foundation produced numbers only on the Pro 7 14 and Surface; it found no HEVC encoder on the Precision 5 16S, and we skipped the two hybrid-graphics systems because they pick their own adapter and cannot be held to the discrete GPU.
Thermals and the OpenBLAS Power-Off
The Surface averaged 92 to 97 C through its longest workloads and finished the 30-minute sustained loop 1 percent faster than it started; the Blade 16 peaked at 98 to 99 C with the same outcome. The one system that steps down, the Precision 5 16S, does so on a timer. The Surface’s OpenBLAS DNF, despite the temperatures around it, was not a graceful thermal slowdown: the system lost power outright under the heaviest floating-point load in the suite.

What We Could Monitor
sr-client samples sensors every few seconds through LibreHardwareMonitor and Windows performance counters and summarizes each test’s window, and coverage varies more than we would like across current platforms. The two Intel systems report no CPU temperature at all to LibreHardwareMonitor, which leaves the suite pausing at a fixed interval between tests.
CPU Temperature and Clocks by Workload
| Workload (CPU max / mean, C) | Surface Laptop Ultra | Dell Pro Precision 5 16S | Dell Pro 7 14 | Razer Hoja 16 | Dell Pro Max 14 Premium |
|---|---|---|---|---|---|
| Cinebench 2026 | 98 / 88 | Sin sensor | 83 / 74 | 96 / 78 | Sin sensor |
| 7-Zip | 98 / 65 | Sin sensor | 75 / 70 | 99 / 84 | Sin sensor |
| Pescado de seco | 98 / 96 | Sin sensor | 69 / 68 | 92 / 90 | Sin sensor |
| Batidora de vaso - Blender | 98 / 93 | Sin sensor | 76 / 70 | 95 / 87 | Sin sensor |
| HandBrake | 98 / 84 | Sin sensor | 82 / 72 | 92 / 86 | Sin sensor |
| LLVM build | 98 / 92 | Sin sensor | 74 / 68 | 98 / 93 | Sin sensor |
| GROMACS | 98 / 96 | Sin sensor | 71 / 70 | 97 / 94 | Sin sensor |
| AbrirBLAS | DNF | Sin sensor | 83 / 78 | 91 / 87 | Sin sensor |
| STREAM | 98 / 92 | Sin sensor | 69 / 66 | 75 / 71 | Sin sensor |
| SuperTuxKart | 90 / 80 | Sin sensor | 69 / 64 | 89 / 83 | Sin sensor |
| MLPerf Client | 93 / 77 | Sin sensor | 71 / 67 | 97 / 76 | Sin sensor |
| Coding agent | 86 / 78 | Sin sensor | 78 / 68 | 91 / 84 | Sin sensor |
The Surface hit 97 to 98 C in every heavy all-core test, and its means in Stockfish, GROMACS, and Blender stayed above 93 C, which suggests it spends most of those tests pinned at its limit. Even STREAM, a memory test, took it to 98 C. The Blade 16 ran nearly as hot, peaking at 98 to 99 C in 7-Zip and the LLVM build, but its means were 5 to 10 C lower in most tests. The Pro 7 14 was the cool one, peaking at 89 C across the whole run, which fits both its lower clocks and its lower all-core scores.
| Workload (mean CPU clock, MHz) | Surface Laptop Ultra | Dell Pro Precision 5 16S | Dell Pro 7 14 | Razer Hoja 16 | Dell Pro Max 14 Premium |
|---|---|---|---|---|---|
| Cinebench 2026 | 2,952 | 3,792 | 3,879 | 4,158 | 3,734 |
| 7-Zip | 2,405 | 3,936 | 3,767 | 4,014 | 3,710 |
| Batidora de vaso - Blender | 3,174 | 3,665 | 3,086 | 3,729 | 3,469 |
| LLVM build | 3,160 | 3,631 | 3,043 | 3,697 | 3,379 |
| GROMACS | 3,325 | 3,525 | 3,023 | 3,874 | 3,458 |
| STREAM | 3,255 | 4,014 | 3,590 | 3,684 | 4,057 |
| MLPerf Client | 2,165 | 2,632 | 3,036 | 3,593 | 3,861 |
| Sustained loop, steady state | 3,276 | 3,294 | 2,914 | 3,742 | 3,393 |
Clocks mean different things on different architectures, so read down a column for how a chip’s clocks move from light to heavy work. The Surface settled at 3.2 to 3.3GHz for all-core work, the speed it can hold at 98 C, and its 20 cores at that clock still outrun 12 or 16 x64 cores at higher ones. The Blade 16 held the highest clocks in nearly every test and stayed above 3.6GHz in its hottest ones, which is how it leads Stockfish and GROMACS on the same silicon family as the Pro 7 14, which fell to 2.8 to 3.1GHz under sustained all-core load.
The sustained loop is the clearest view of each firmware’s strategy. The Surface held 98 C for all ten passes and finished 1 percent above its first; the Blade 16 did the same at 94 C. Neither chassis has thermal reserve left at that point, but neither needs it, because their firmware holds clocks steady at the limit.
The Precision 5 16S is the only system that steps down, and it does so the same way every time: after 10 to 14 minutes, the score falls about 6 percent and stays there, and its second full run repeated the drop to three decimal places (0.938 against 0.939). A drop that lands on the same minute in two runs looks like a long-duration power limit in Dell’s firmware, not a cooling system losing ground.
The Surface is not the only RTX Spark laptop we have running hot. Other N1X notebooks in the lab also sit in the mid to high 90s under all-core load and, so far, none of them has faulted. Our working theory, which we cannot prove, is that NVIDIA set the N1X’s laptop power and thermal targets close enough to the edge that it is up to each OEM’s cooling and firmware to hold the line, and this is where the Surface differs from the others. Thermals are something to watch as we work through these reviews, because cooling design is going to separate these platforms.

Running Hot and the OpenBLAS Power-Off
Our Surface Laptop Ultra lost power three times, every time as the all-core OpenBLAS LU solve moved to the N=20000 problem on 20 threads. We skipped OpenBLAS on its final run so the other 29 tests could complete, which is why it reads DNF in the CPU section. This is the second unit to fail this way: the first review unit hung in the same workload, came back with a OLED display defect at the exhaust edge and a CPU fault we could reproduce on command, and was replaced.
| Eventos | What was running | Last reading before the loss | Después |
|---|---|---|---|
| Alrededor de las 20:06 | Full run, 26-openblas: both N=10000 LU sets done (319.7 and 368.1 GFLOPS), then N=20000 on 20 threads | CPU 95.7 C, 3.2GHz (53 C at the step start) | Off until powered on at 21:11 |
| Alrededor de las 21:30 | Repro, pass 1: 12 N=10000 solves passed, N=20000 on 20 threads started 21:30:13 | Hottest zone 95.2 C, 3.1GHz | Rebooted by itself at 21:31 |
| Alrededor de las 21:35 | Repro, pass 1: same sequence, N=20000 on 20 threads started 21:35:10 | Hottest zone 95.5 C, 3.2GHz | De regreso a las 22:05 |
Our initial thought was that a notebook running at 98 C cooked itself; that does not appear to be the real issue. The Surface dropped from 95.2 to 95.7 C after holding 98 C for 31 minutes in the sustained loop and 12 minutes in Cinebench without a fault. Windows saw a hard power cut, not a shutdown: each restart logged Kernel-Power 41 with bugcheck code 0 and no power-button press, and there was no crash dump, no fatal hardware error record, and no thermal shutdown event, which a thermal trip would normally leave.
The timing is repeatable to the second: both repros lost power on the first pass, 42 to 46 seconds after the load began and 14 to 16 seconds into the N=20000 solve, and every solve before the loss passed the HPL residual check, so the hardware was computing correctly right up to the cut.
A platform counter also peaked at the same value both times: the PSYS thermal zone is not a temperature, but it climbs steadily under load from roughly 1,000 to 1,200 at idle and read 4,419 and 4,406 at the two repro losses. The first Surface went down at a much lower PSYS reading of 2,808, so this is a lead for the platform’s firmware owners, not a threshold.
The fault is not deterministic either, because after the first restart, the full run’s retry of the step passed all eight configurations up to N=40000, at 336 and 370 GFLOPS for the N=20000 and N=40000 solves on 20 threads, so three of four attempts on this unit lost power. Both units were on AC; this one had its battery at 100 percent before and after.
Two Surface Laptop Ultra units failing identically, on different memory splits (96/32 on the first, 64/64 on this one), points to this model’s power delivery, cooling design, or firmware protection under sustained all-core FP64 load, not a single bad unit. We have reported the behavior and will update this review if a fix is delivered.
Reproducing the Power-Off
Our repro ran six N=10000 LU solves on 20 threads, six more on 10 threads, and then N=20000 on 20 threads. OpenBLAS ships a LINPACK benchmark (benchmark/linpack.c) that does the same work: it fills a random N x N matrix, factors it with dgetrf, solves it with dgetrs, and reports MFlops per size, so anyone can repeat the sequence without our suite.
Two details matter on Windows on Arm, starting with thread count: the official Windows on Arm OpenBLAS release caps itself at 12 threads, so it cannot load all 20 cores; the library has to be built from the 0.3.34 source with a higher limit. And the benchmark’s Windows timer compiles only under a MinGW-style toolchain, so build it in MSYS2’s CLANGARM64 shell. From the unpacked OpenBLAS 0.3.34 source:
pacman -S --needed mingw-w64-clang-aarch64-clang mingw-w64-clang-aarch64-cmake mingw-w64-clang-aarch64-ninja
cmake -S . -B build -G Ninja -DCMAKE_BUILD_TYPE=Release -DTARGET=NEOVERSEN1 -DNUM_THREADS=256 -DNOFORTRAN=1 -DC_LAPACK=1 -DBUILD_BENCHMARKS=ON -DBUILD_TESTING=OFF
cmake --build build --target benchmark_linpack_DOUBLE
Then, plugged in with Windows set to Best performance, this sequence repeats the run that preceded each power loss. On our Surface, it cut the power during the final N=20000 solve.
cd build
OPENBLAS_LOOPS=6 OPENBLAS_NUM_THREADS=20 ./benchmark_linpack_DOUBLE.exe 10000 10000 1
OPENBLAS_LOOPS=6 OPENBLAS_NUM_THREADS=10 ./benchmark_linpack_DOUBLE.exe 10000 10000 1
OPENBLAS_NUM_THREADS=20 ./benchmark_linpack_DOUBLE.exe 20000 20000 1
The two OPENBLAS_LOOPS=6 runs warm the system with twelve N=10000 solves, matching our repro, and the last command starts the N=20000 solve on all 20 cores, where our Surface lost power 14 to 16 seconds in.
Rendimiento de almacenamiento
The storage results sort the five SSDs into three groups. The Surface’s Gen5 SK hynix drive set the sequential records at 14.1GB/s read and 11.5GB/s write; the Precision 5 16S, Pro Max 14, and Blade 16 delivered 650K to 780K IOPS of 4K random I/O through the file system; and the Pro 7 14’s Samsung BM9C1a read like a normal Gen4 drive but wrote at about 120MB/s, a result tied to teh drive being QLC.
fio Four Corners
Our client storage test runs fio against a file on the boot volume, through NTFS and BitLocker exactly as the system shipped, so the results include whatever the OS and encryption cost. It measures 128K sequential reads and writes at QD32, and 4K random reads and writes at QD32 across 4, 8, and 16 jobs, reporting the best of the three. Each corner runs on a 5GB footprint and again on 25GB to check whether the result survives once the working set outgrows the drive’s fastest cache; the 25GB rows are the ones to compare.


| fio, 5GB footprint | Surface Laptop Ultra | Dell Pro Precision 5 16S | Dell Pro 7 14 | Razer Hoja 16 | Dell Pro Max 14 Premium |
|---|---|---|---|---|---|
| Sequential read 128K QD32 (MB/s) | 14,175 | 10,275 | 3,747 | 7,099 | 7,025 |
| Sequential write 128K QD32 (MB/s) | 11,475 | 8,909 | 123 | 5,248 | 6,645 |
| Random read 4K QD32, peak (IOPS) | 307,738 | 778,080 | 363,988 | 700,883 | 756,704 |
| Random write 4K QD32, peak (IOPS) | 284,680 | 676,963 | 25,465 | 651,651 | 697,110 |
The two Gen5 drives own the sequential rows. The Surface reached 14,134MB/s read and 11,461MB/s write on the 25GB footprint, and the Precision 5 16S followed at 9,216MB/s and 9,009MB/s, while the three Gen4 systems clustered at 7.0 to 7.1GB/s read. Random I/O reorders the group: the Precision 5 16S, Pro Max 14, and Blade 16 all landed between 648K and 780K IOPS in both directions, while the Surface stalled near 300K IOPS reading and writing, under half the x64 systems despite the faster drive.
The raw-device rows show where the ceiling comes from: repeating the 4K random read directly against the physical disk, bypassing NTFS and BitLocker, the Surface’s SSD delivered 1,670,736 IOPS, 5.6x its file-system result, so the 300K ceiling is set by the Windows on Arm storage path and not by the drive. The likeliest cost is BitLocker’s software XTS-AES-128 with Memory Integrity enabled, which held the CPU at 57 percent during the 4-job set.
The x64 systems lose less but still leave IOPS on the table: the Pro Max 14 by 1.94x, the Precision 5 16S by 1.57x, and the Blade 16 by 1.43x. Only the Pro 7 14 saw no difference.
Storage Latency and Model-Load Ceiling
fio’s completion latencies on the 25GB footprint, in microseconds, and the drive ceiling the AI model-load test uses as its upper bound: a DiskSpd 1MB sequential read of a model file.
| Prueba | Surface Laptop Ultra | Dell Pro Precision 5 16S | Dell Pro 7 14 | Razer Hoja 16 | Dell Pro Max 14 Premium |
|---|---|---|---|---|---|
| Sequential read 128K, p99 (µs, lower is better) | 391 | 971 | 2,179 | 1,384 | 873 |
| Sequential write 128K, p99 (µs, lower is better) | 766 | 3,490 | 120,062 | 889 | 1,036 |
| Random read 4K, 16 jobs, mean (µs, lower is better) | 1,839 | 368 | 1,410 | 472 | 635 |
| Random write 4K, 16 jobs, mean (µs, lower is better) | 1,984 | 444 | 23,703 | 470 | 636 |
| Raw random read 4K QD32, peak, 25GB (IOPS) | 1,670,736 | 1,224,270 | 361,344 | 993,050 | 1,472,021 |
| Model-load drive ceiling, DiskSpd 1M sequential read (MB/s) | 10,588 | 11,402 | 1,689 | 6,246 | Not run (model-load test did not qualify) |
The Surface had the tightest sequential tails, and the Precision 5 16S had the lowest average 4K latency in both directions. The Surface’s 16-job random sets also carried a tail we have not seen on the x64 systems: p99.99 latency of 4.8 seconds reading and 5.6 seconds writing against means of 1.8 and 2.3 ms, so about one I/O in 10,000 waits seconds through the Windows on Arm path. We have left the Surface’s 4K p99 values out of the table because they came in below their own means, which cannot be right, and we want to confirm how fio reports percentiles on Arm64 before printing them.
Conclusión
The RTX Spark N1X in the Surface Laptop Ultra for Business is the strongest multi-threaded CPU we have ever seen in a notebook, and it pairs that with 122GB/s of memory bandwidth and a 64GB GPU allocation, adjustable to 96GB, that puts more memory behind an NVIDIA GPU than any laptop before it. It led Cinebench, 7-Zip, Blender, x265, and the LLVM build by wide margins, set the sequential storage records at 14.1GB/s read and 11.5GB/s write, and was the only system that ran our 35B-parameter tier M models at a usable speed, finishing the coding agent’s tier M tasks in under 90s, whereas the x64 integrated systems needed five to eleven minutes.

The caveats are specific to the platform as it ships today. The Windows on Arm storage path caps random I/O at a fifth of what the drive can do, and memory latency is double that of the x64 systems. Single-thread results trail the x64 field, and a handful of Arm64 ports (SVT-AV1, GROMACS) lag their x64 builds badly. The integrated GPU also shares the memory bus with the rest of the system, so the desktop slows by half while an agent works.
For a model that fits in 24GB, the Razer Blade 16’s RTX 5090 generates tokens 2.3x faster and stays responsive while doing it; the Surface’s best use case is a model that does not fit on smaller platforms.
Apart from those caveats, two Surface Laptop Ultra units have now cut their own power under the same all-core double-precision load, not connected to temperature, with logs that read as a hard power cut and not as a thermal trip. Most buyers will never run an HPL-style solve on 20 threads, and the laptop held 98 C through every other sustained test without losing a point. But a workstation-class laptop should survive its heaviest legitimate workload, and until Microsoft or NVIDIA explains what tripped, that is the open question on this machine.
For a developer or analyst who wants to run 20B to 35B models locally, compile large trees, or render on the CPU in a laptop, the N1X in this Surface does things no x64 notebook in this comparison can, and the 128GB configuration delivers this promise exceedingly well.
For anyone whose work is single-threaded, browser-bound, or built on a discrete-GPU model that fits in 24GB, the x64 field is likely the better buy, and the Precision 5 16S and Blade 16 split that choice. We will follow up with hardware impressions and battery life once the lab finishes with the chassis, and with the vendors’ answer on the power-off as soon as we have it.


 Amazon