

The Kingston DC1500M is the company’s latest U.2 data center NVMe PCIe SSD specifically designed for cloud providers, hyperscale data centers, and enterprise-level IT on-premise servers. The DC1500M is an affordable enterprise SSD, making it an ideal solution for organizations looking to move from SATA/SAS SSDs to NVMe in order to leverage the interface’s much faster data transfer speeds and lower latency. The DC1500M uses the Gen 3.0 x4 interface and is available in capacities ranging from 960GB to 7.68TB.
The Kingston DC1500M is the company’s latest U.2 data center NVMe PCIe SSD specifically designed for cloud providers, hyperscale data centers, and enterprise-level IT on-premise servers. The DC1500M is an affordable enterprise SSD, making it an ideal solution for organizations looking to move from SATA/SAS SSDs to NVMe in order to leverage the interface’s much faster data transfer speeds and lower latency. The DC1500M uses the Gen 3.0 x4 interface and is available in capacities ranging from 960GB to 7.68TB.
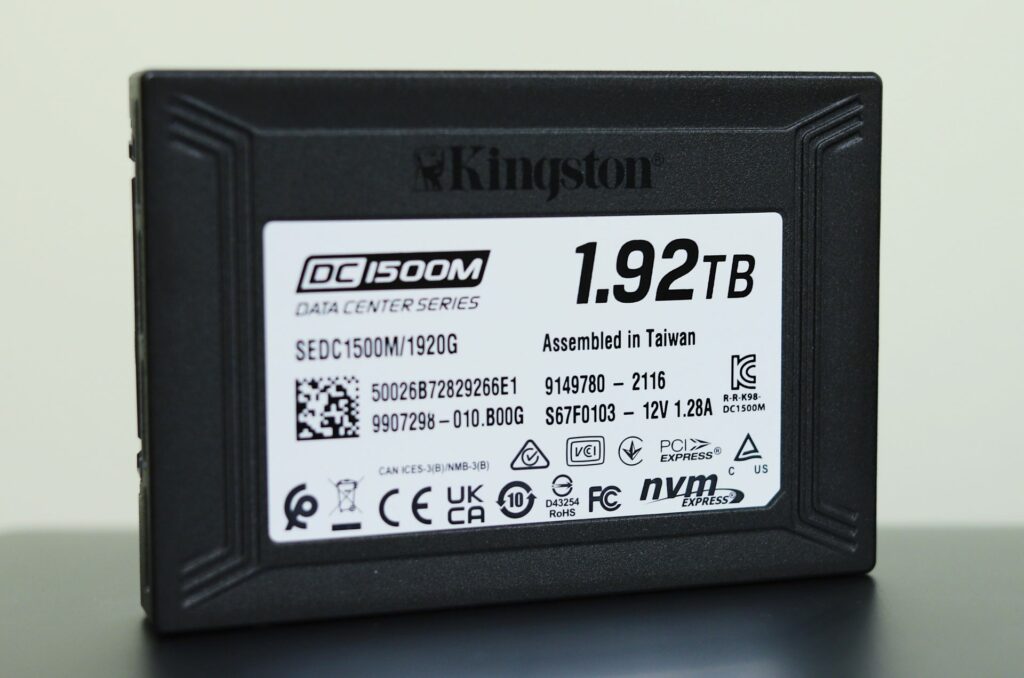
The Kingston DC1500M drive comes with a range of advanced enterprise-class features that help to enhance long-term performance in high-availability environments. Highlights include end-to-end data path protection to ensure the integrity of data transfer, multiple namespace management to prevent naming collisions, power loss protection (or PLP) to prevent data corruption during unplanned power loss, and telemetry monitoring for remote SSD monitoring. Kingston has also made endurance and long-term performance a focus with the new DC1500M, as it features 1 DWPD for five years, and 1.6 DWPD for 3 years.
Kingston DC1500M vs. DC1000M
The Kingston DC1500M is a direct replacement of the DC1000M, a drive released in Summer 2020 that offered good performance, capacity, and value for a range of different use cases.
There are some noteworthy improvements to the DC1500M over its predecessor. For example, the new Kingston drive now supports up to 64 namespaces, an increase that will benefit those who have NVMe SSDs shared across multiple systems or devices. The DC1500M also features the new SMI2270 16-channel controller (which supports independent multiple namespace I/O queues), BICs4 TLC NAND (a move from BiCs3), and onboard Nanya DDR4.
As far as performance goes, Kingston quotes the DC1500M to deliver consistent read and write latencies of less than 110 µs and 206 µs, respectively. For sequential speeds, the Kingston drive is expected to reach up to 3.3GB/s read (1.92TB model) and 2.7GB/s write (all but the lowest capacity model). Random 4K reads and writes are expected to hit up to 510,000 IOPS and 220,000 IOPS (1.92TB model), respectively.
Backed by the company’s five-year limited warranty, the DC1500M is available in 960GB, 1.92TB, 3.84TB, and 7.68TB capacities. Our review is of the 1.92TB capacity.
Kingston DC1500M Specifications
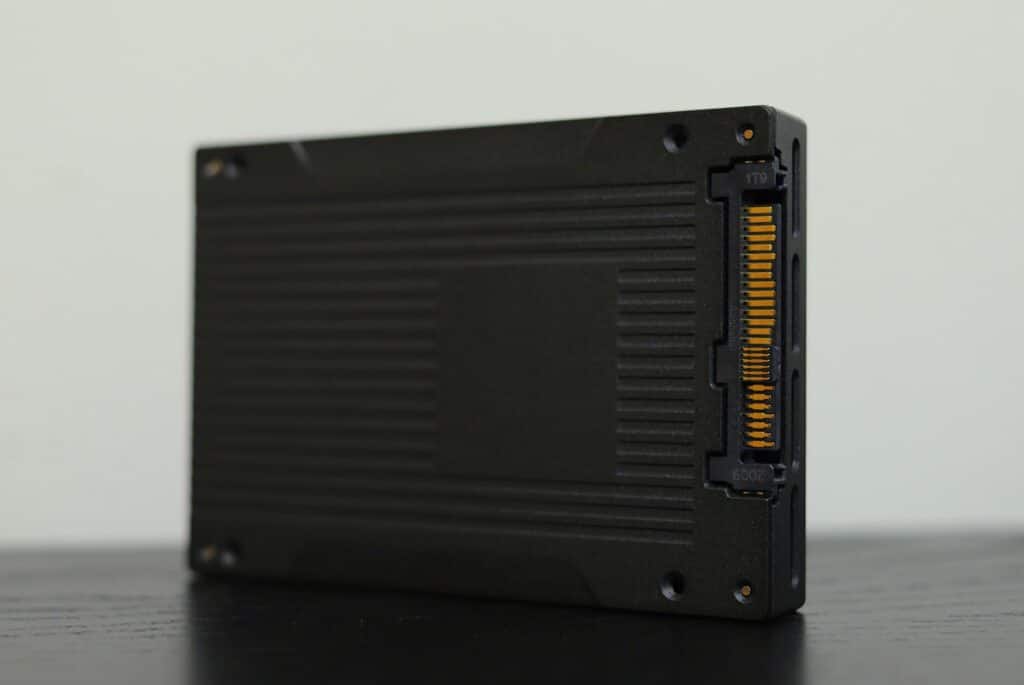
| Form Factor | U.2, 2.5” x 15mm |
| Interface | PCIe NVMe Gen3 x4 |
| Capacities | 960GB, 1.92TB, 3.84TB, 7.68TB |
| NAND | 3D TLC |
| Sequential Read/Write | 960GB – 3,100/1,700MB/s 1.92TB – 3,300/2,700MB/s 3.84TB – 3,100/2,700MB/s 7.68TB – 3,100/2,700MB/s |
| Steady-State 4k Read/Write | 960GB – 440,000/150,000 IOPS 1.92TB – 510,000/220,000 IOPS 3.84TB – 480,000/210,000 IOPS 7.68TB – 420,000/200,000 IOPS |
| Latency Quality of Service (QoS) | 99.9 – Read/Write: <110 µs / <206 µs |
| Static and Dynamic Wear Leveling | Yes |
| Power Loss Protection (Power Caps) | Yes |
| Namespace Management Support | Yes – 64 Namespaces supported |
| Enterprise Diagnostics | Telemetry, Media Wear, Temperature, Health and Error Logs, etc |
| Endurance | 960GB – (1 DWPD/5yrs) 1.92TB – (1 DWPD/5yrs) 3.84TB – (1 DWPD/5yrs) 7.68TB – (1 DWPD/5yrs) |
| Power Consumption | 960GB – Idle: 6.30W Average Read: 6.21W Average Write: 11.40W Max Read: 6.60W Max Write: 12.24W 1.92TB – Idle: 6.60W Average Read: 6.30W Average Write: 13.7W Max Read: 6.63W Max Write: 15.36W 3.84TB – Idle: 6.8W Average Read: 6.40W Average Write: 14.20W Max Read: 7W Max Write: 16W 7.68TB – Idle: 7W Average Read: 7.30W Average Write: 17.14W Max Read: 8.16W Max Write: 20.88W |
| Operating temperature | 0°C ~ 70°C |
| Dimensions | 100.09mm x 69.84mm x 14.75mm |
| Weight | 960GB – 145g 1.92TB – 150g 3.84TB – 155g 7.68TB – 160g |
| Vibration operating | 2.17G Peak (7–800Hz) |
| Vibration non-operating | 20G Peak (10–2000Hz) |
| MTBF | 2 million hours |
| Warranty/support | Limited 5-year warranty with free technical support |
Kingston DC1500M Performance
Houdini by SideFX
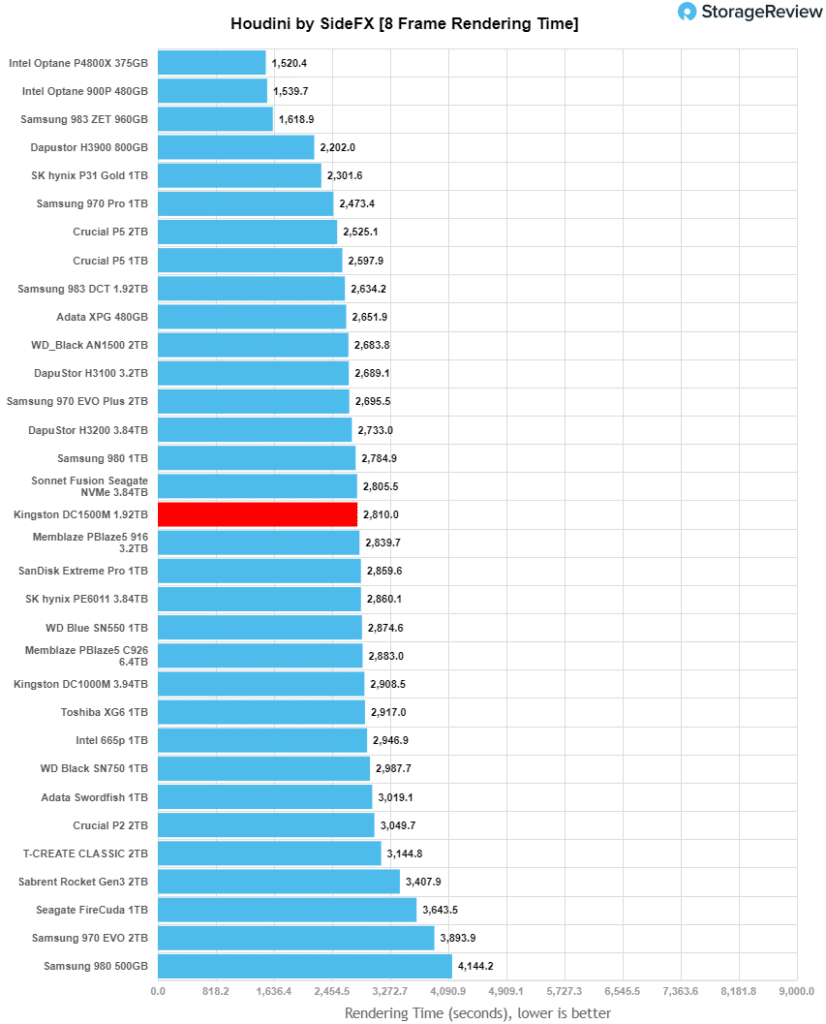
The Houdini test is specifically designed to evaluate storage performance as it relates to CGI rendering. The testbed for this application is a variant of the core Dell PowerEdge R740xd server type we use in the lab with dual Intel 6130 CPUs and 64GB DRAM. In this case, we installed Ubuntu Desktop (ubuntu-16.04.3-desktop-amd64) running bare metal. The output of the benchmark is measured in seconds to complete, with fewer being better.
The Maelstrom demo represents a section of the rendering pipeline that highlights the performance capabilities of storage by demonstrating its ability to effectively use the swap file as a form of extended memory. The test does not write out the result data or process the points in order to isolate the wall-time effect of the latency impact to the underlying storage component. The test itself is composed of five phases, three of which we run as part of the benchmark, which is as follows:
- Loads packed points from disk. This is the time to read from the disk. This is single-threaded, which may limit overall throughput.
- Unpacks the points into a single flat array in order to allow them to be processed. If the points do not have a dependency on other points, the working set could be adjusted to stay in-core. This step is multi-threaded.
- (Not Run) Processes the points.
- Repacks them into bucketed blocks suitable for storing back to disk. This step is multi-threaded.
- (Not Run) Writes the bucketed blocks back out to disk.
Here, the Kingston DC1500M showed 2,810.0 seconds, results that landed it right in the middle of drives tested (including a decent improvement over the DC1000M).
Application Workload Analysis
In order to understand the performance characteristics of enterprise storage devices, it is essential to model the infrastructure and the application workloads found in live production environments. Our benchmarks for the Kingston DC1500M include the MySQL OLTP performance via SysBench and Microsoft SQL Server OLTP performance with a simulated TCP-C workload. For our application workloads, each comparable drive will be running 4 identically configured VMs.
Sysbench Performance
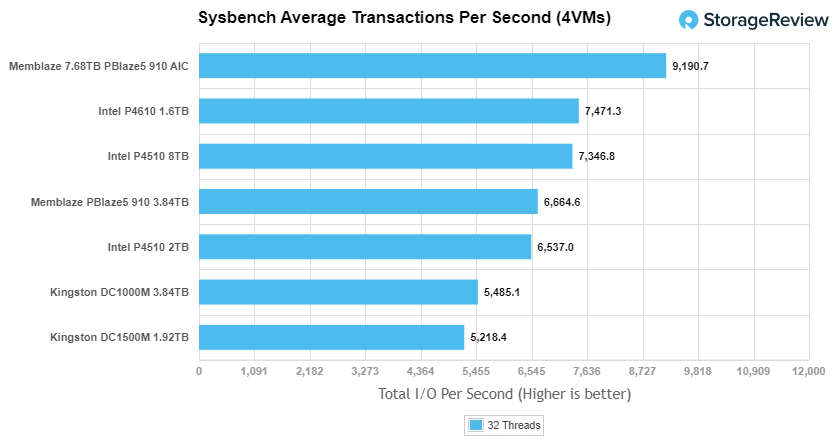
The next application benchmark consists of a Percona MySQL OLTP database measured via SysBench. This test measures average TPS (Transactions Per Second), average latency, and average 99th percentile latency as well.
Each Sysbench VM is configured with three vDisks: one for boot (~92GB), one with the pre-built database (~447GB), and the third for the database under test (270GB). From a system resource perspective, we configured each VM with 8 vCPUs, 60GB of DRAM and leveraged the LSI Logic SAS SCSI controller.
Sysbench Testing Configuration (per VM)
- CentOS 6.3 64-bit
- Percona XtraDB 5.5.30-rel30.1
-
- Database Tables: 100
- Database Size: 10,000,000
- Database Threads: 32
- RAM Buffer: 24GB
- Test Length: 3 hours
-
- 2 hours preconditioning 32 threads
- 1 hour 32 threads
Looking at our Sysbench transactional benchmark, the DC1500M had 5,218.4 TPS, placing it at the bottom of the leaderboard.
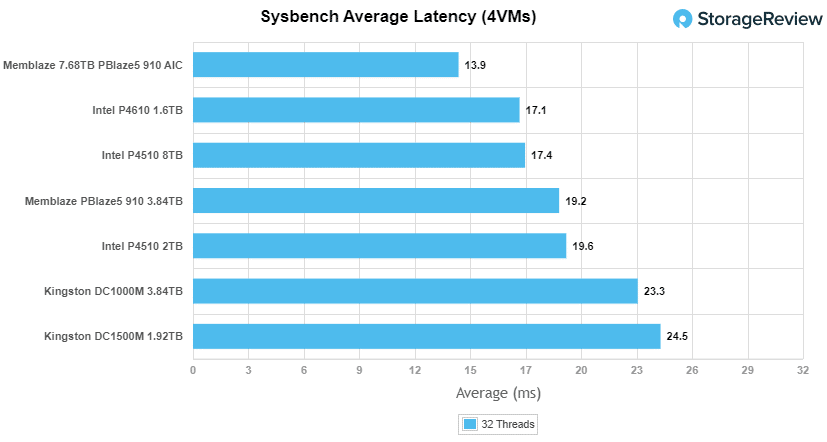
With Sysbench average latency the DC1500M posted 24.53ms, again placing it in last among the comparables.
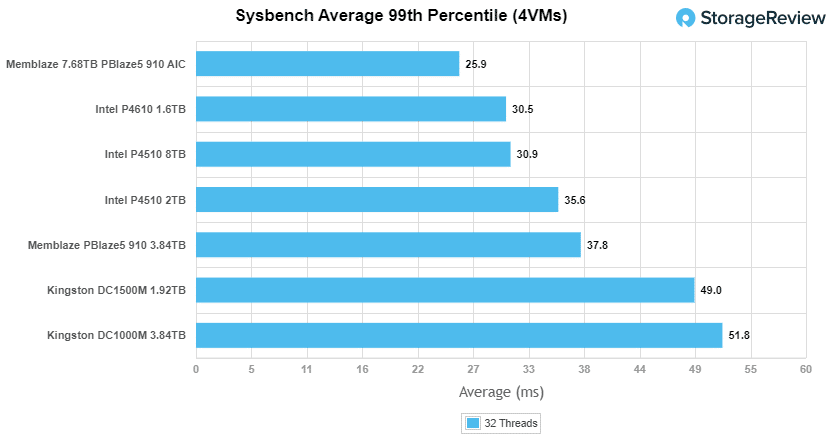
For our worst-case scenario latency (99th percentile) the DC1500M showed 49.03, though this time it had slightly better results than the DC1000M.
VDBench Workload Analysis
When it comes to benchmarking storage devices, application testing is best, and synthetic testing comes in second place. While not a perfect representation of actual workloads, synthetic tests do help to baseline storage devices with a repeatability factor that makes it easy to do apples-to-apples comparisons between competing solutions. These workloads offer a range of different testing profiles ranging from “four corners” tests, common database transfer size tests, to trace captures from different VDI environments.
All of these tests leverage the common vdBench workload generator, with a scripting engine to automate and capture results over a large compute testing cluster. This allows us to repeat the same workloads across a wide range of storage devices, including flash arrays and individual storage devices. Our testing process for these benchmarks fills the entire drive surface with data, then partitions a drive section equal to 25% of the drive capacity to simulate how the drive might respond to application workloads. This is different than full entropy tests which use 100% of the drive and takes them into a steady state. As a result, these figures will reflect higher-sustained write speeds.
Profiles:
- 4K Random Read: 100% Read, 128 threads, 0-120% iorate
- 4K Random Write: 100% Write, 64 threads, 0-120% iorate
- 64K Sequential Read: 100% Read, 16 threads, 0-120% iorate
- 64K Sequential Write: 100% Write, 8 threads, 0-120% iorate
- Synthetic Database: SQL and Oracle
- VDI Full Clone and Linked Clone Traces
Comparables:
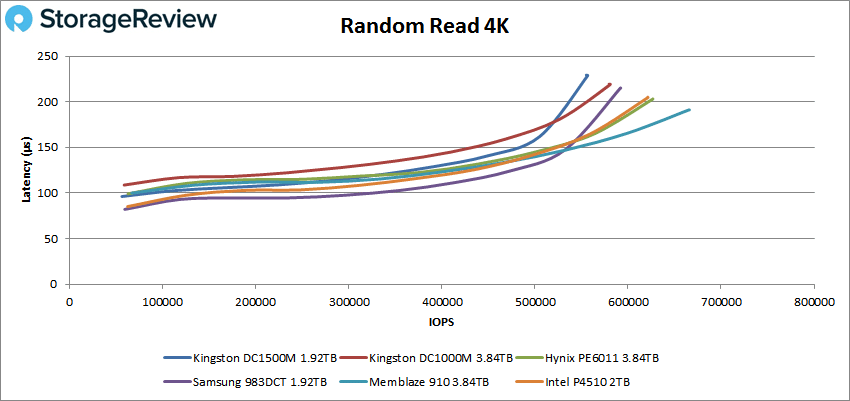
In our first VDBench Workload Analysis, Random 4K Read, the Kingston DC1500M trailed the rest of the comparables (including the DC1000M) with a peak performance of 556,628 IOPS at a latency of 228.8µs.
4K random write gave us showed us much better results, as the DC1500M took the top spot with a peak performance of 323,463 IOPS at a latency of 390.2µs before dropping off slightly at the end and right next to the DC1000M).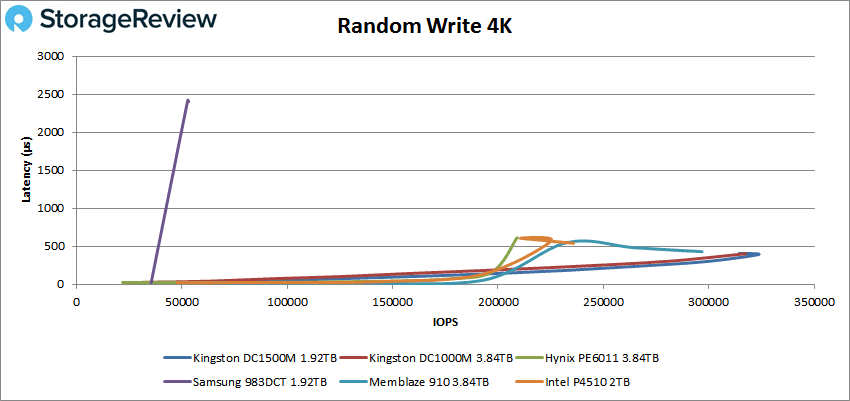
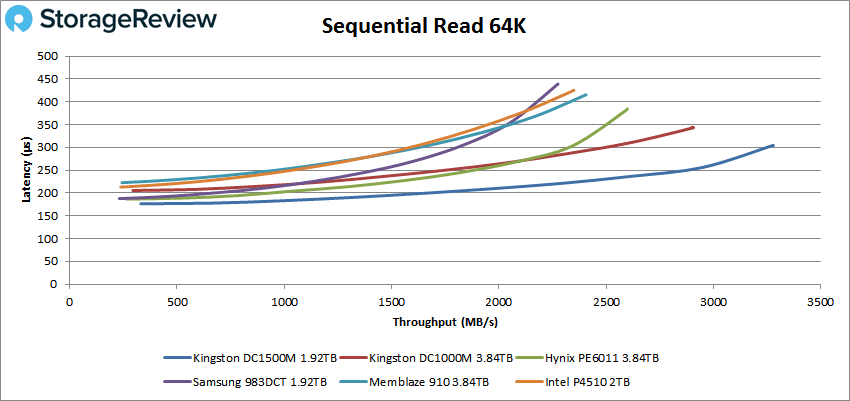
Switching over to 64k sequential workloads, the DC1500M took the top spot in reads with a peak of 52,455 IOPS or 3.28GB/s at a latency of 304.4µs. This was a noticeable improvement over the previous-gen DC1000M.
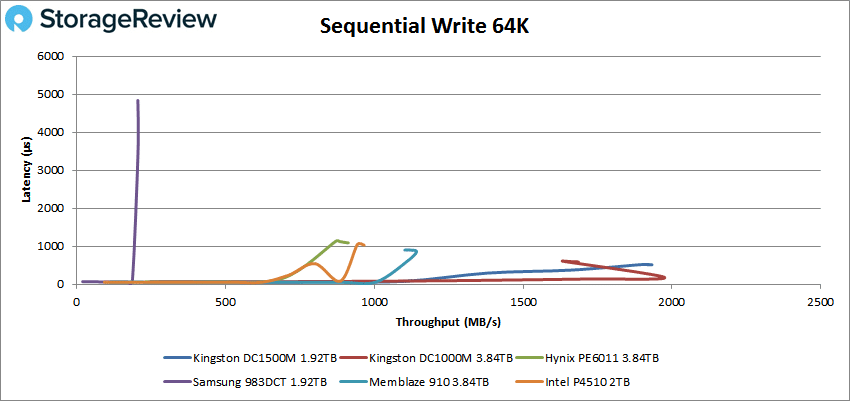
In 64K write, the DC1000M saw more strong performance taking the top spot with 30,918 IOPS or about 1.93GB/s at a latency of 511µs. Though the DC1000 had slightly better peak performance than the DC1500M, it dropped off at the very end of the test.
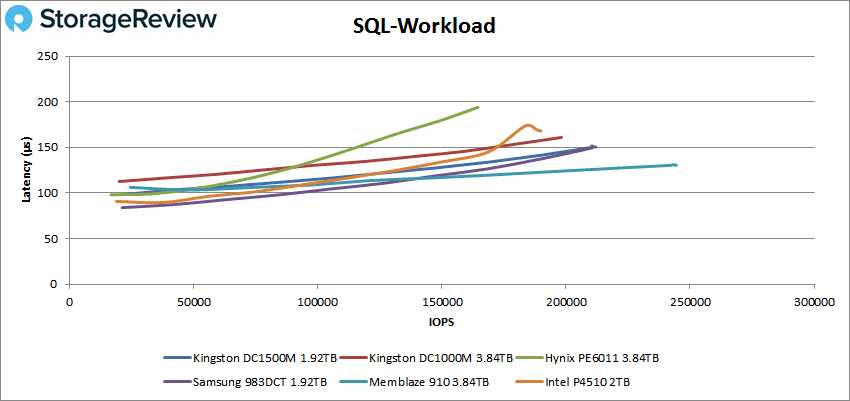
Our next set of tests are our SQL workloads: SQL, SQL 90-10, and SQL 80-20, all of which showed the DC1500M with a slight improvement in performance over the previous-gen model. Starting with SQL, the new Kingston drive landed second (just behind the Memblaze and right beside the Samsung) with a peak performance of 210,980 IOPS at a latency of 150.4µs.
SQL 90-10 saw the DC1500M found itself behind only the Memblaze again with a peak performance of 209,373 IOPS at a latency of 152.2µs.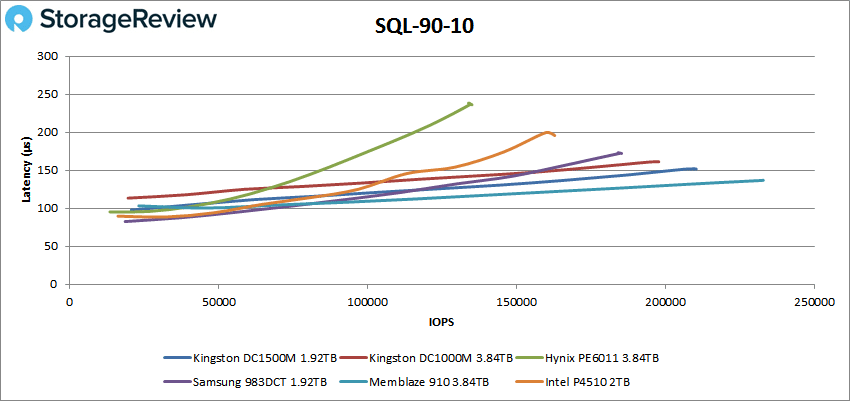
With SQL 80-20, the DC1500M again came in second with a peak of 191,830 IOPS at a latency of 165.9µs.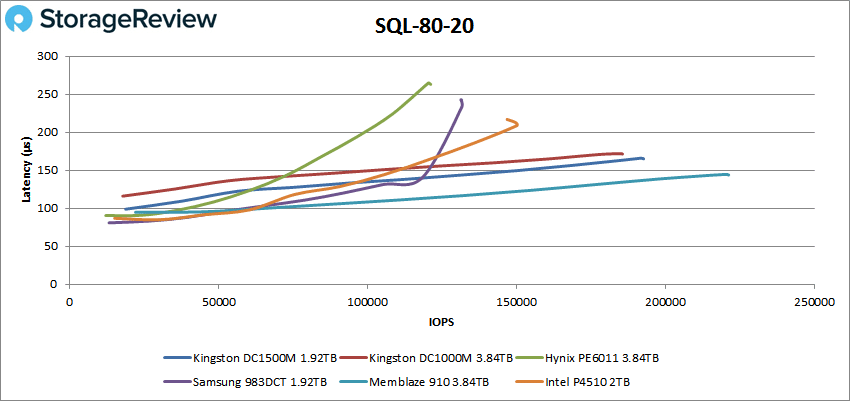
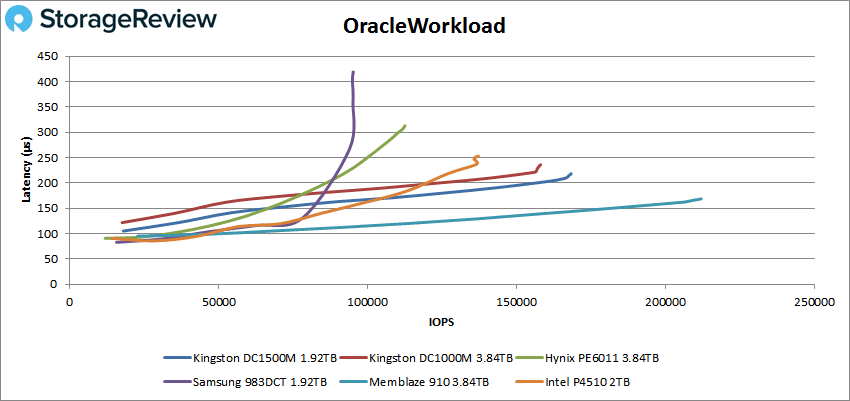
Next up are our Oracle workloads: Oracle, Oracle 90-10, and Oracle 80-20. Like with the SQL benchmarks, the new Kingston drive showed just slightly better performance than the DC1000 in all categories. Starting with Oracle, the DC1500M took second (though well back of the Memblaze 910) with a peak performance of 168,419 IOPS at 214.2µs.
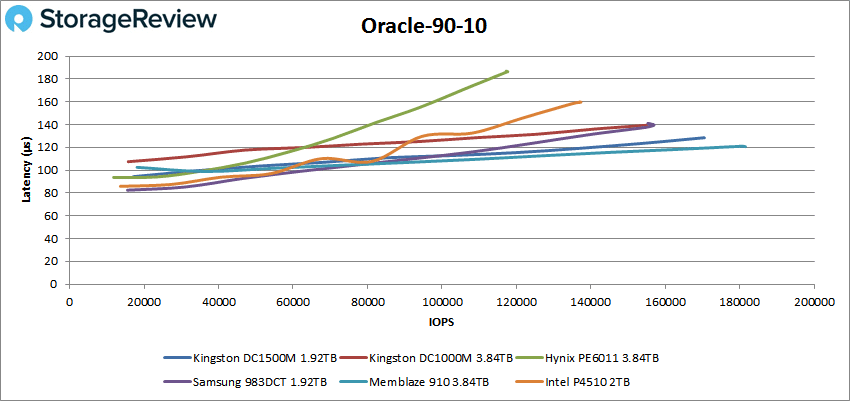
 For Oracle 90-10 the Kingston DC1500M held second place again with a peak of 170,155 IOPS at a latency of 128.4µs.
Looking at Oracle 80-20, the DC1500M posted a peak score of 164,352 IOPS at a latency of 139.9µs.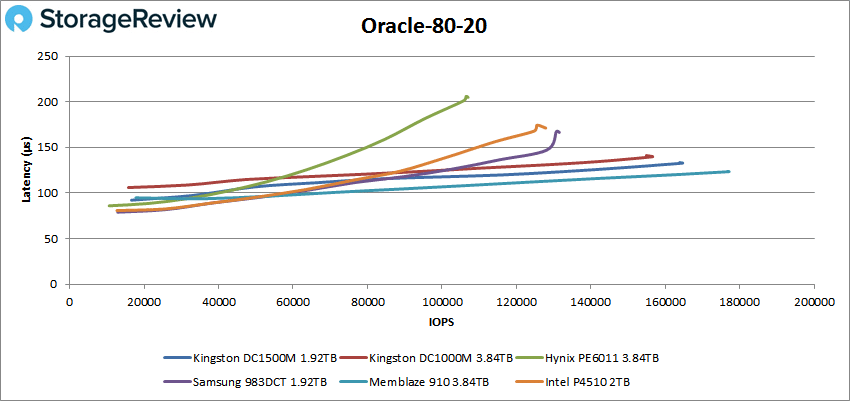
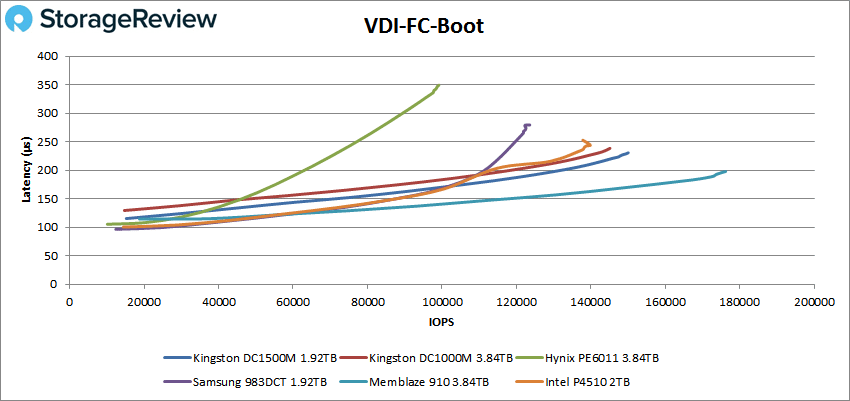
Next, we switched over to our VDI clone test, Full and Linked. For VDI Full Clone (FC) Boot, the Kingston DC1500M remained in its usual second place with a peak of 149,424 IOPS at a latency of 228.7µs, which was slightly better than the DC1000M.
 VDI FC Initial Login, the DC1500M fell to fourth place with a peak of 48,857 IOPS with 612µs for latency, this time trailing the DC1000M.
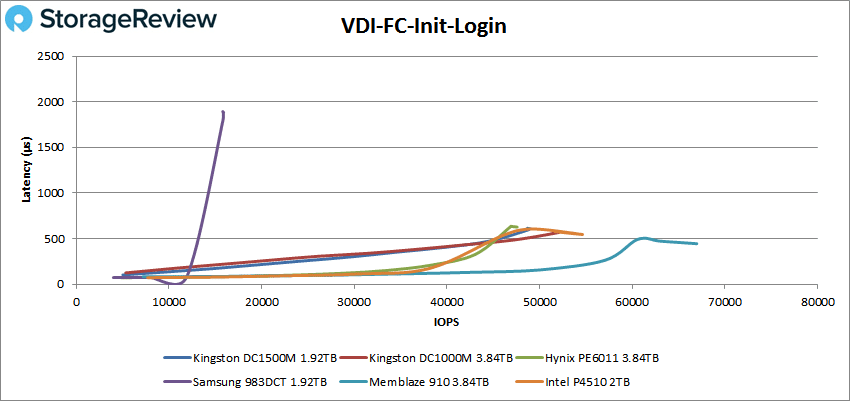
With VDI FC Monday Login, the DC1500M placed fourth (though right behind the DC1000M and Intel P4510) with a peak of 48,407 IOPS with a latency of 328.3µs.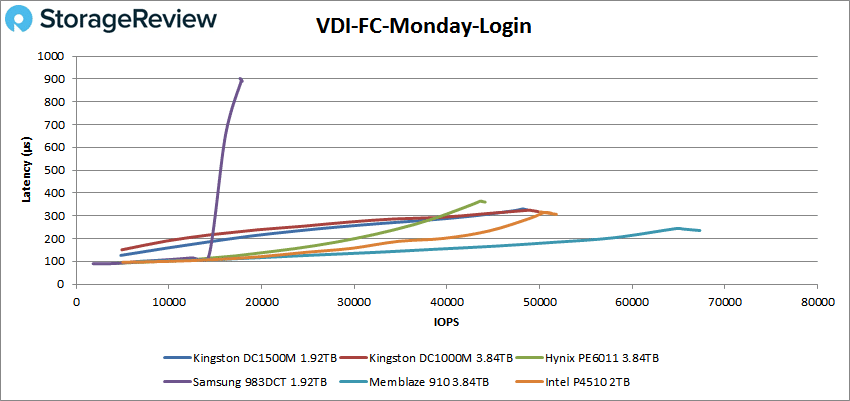
For VDI Linked Clone (LC) Boot, the DC1500M moved back up to second place (hot on the trail of the Memblaze drive) with a peak of 81,129 IOPS at a latency of 196.5µs.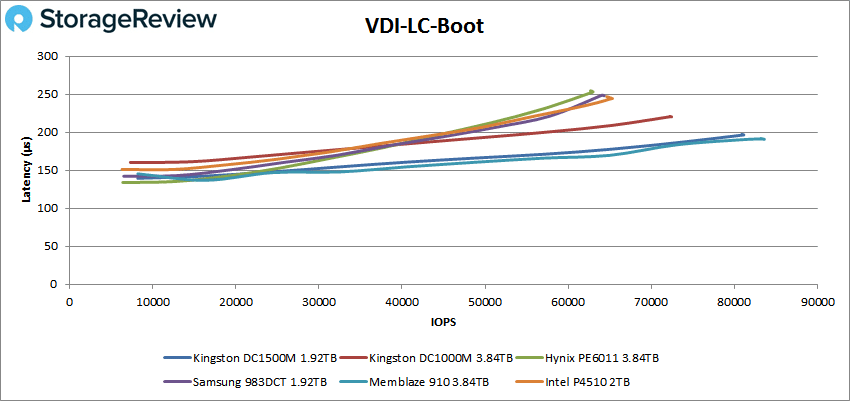
VDI LC Initial Login saw the Kingston fall back again to fourth with 28,288 IOPS at a latency of 280.3µs.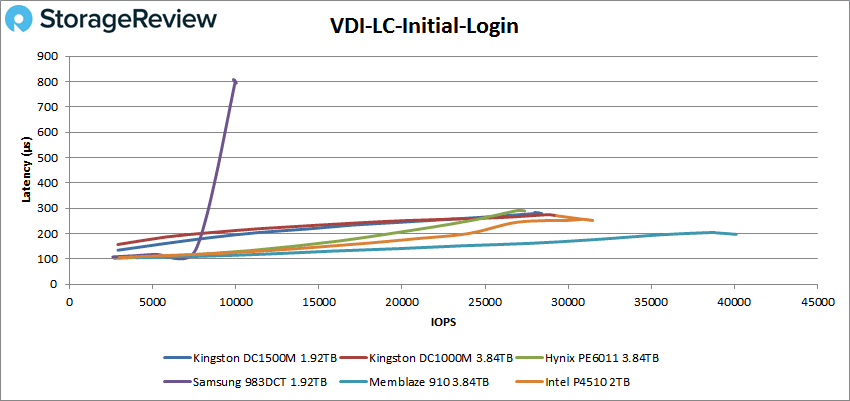
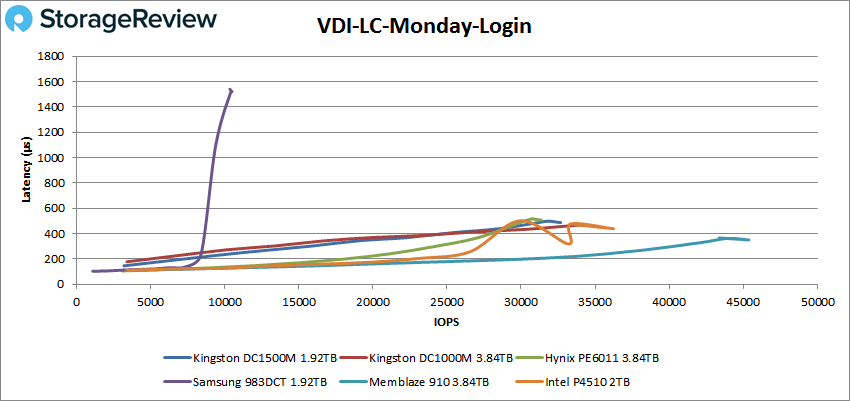
Finally, with VDI LC Monday Login, the DC1500M once more found itself in fourth with a peak performance of 32,479 IOPS at a latency of 489.7µs.
Conclusion
The Kingston DC1500M is the next iteration of the company’s budget-friendly NVMe SSD line for data centers. It is the successor to the DC1000M, a drive that we found worked as a great replacement for SATA or SAS drives for organizations looking for a performance boost at an affordable price. Offering a modest improvement over the previous model, the DC1500M more or less targets the same use cases. It comes in a U.2 form factor and is available in capacities ranging from 960GB to 7.68TB.
For performance, we mostly saw subtle improvements over the DC1000M. We looked at both our Application Workload Analysis and VDBench tests and compared the new Kingston SSD to other drives that are meant for similar environments. In our Applications Workload Analysis benchmarks, the DC1500M showed weaker numbers in Sysbench performance, posting 12,579 TPS and an average latency and worst-case scenario of 24.3ms and 49.03ms, respectively. For Sysbench the drive posted average TPS and latency with 5,218.4 and 24.53ms, respectively, worst-case scenario hit 49.03ms. These numbers put it at the bottom of the competitive pack. For Houdini, we saw 2,810 seconds, which placed the drive in the middle of the leaderboard, a pleasant surprise.
With VDBench, the DC1500M showed solid overall performance. Highlights include 556,628 IOPS random 4K read (the only workload it fell behind the rest), 323K IOPS 4K write, 3.28GB/s 64K read, and 1.93GB/s 64K write. SQL saw scores of 211K IOPS, 209K IOPS for SQL 90-10, and 192K IOPS for SQL 80-20. Oracle had the drive hit 168K IOPS, 170K IOPS for Oracle 90-10, and 164K IOPS for Oracle 80-20. For our VDI clone tests the Kingston drive performed well in boot, however, it fell behind a bit in the Initial Login and Monday workloads.
While the DC1500M isn’t a significant leap over the previous model, it’s still a solid release by Kingston with progressive updates like support for 64 namespaces. The U.2 drive offers good performance and capacity range, making it an affordable choice for a variety of use cases, particularly for organizations looking to upgrade from SATA or SAS drives.
Engage with StorageReview
Newsletter | YouTube | LinkedIn | Instagram | Twitter | Facebook | TikTok | RSS Feed