

The Intel SSD 910 is Intel's first effort at a PCIe-based application accelerator for the enterprise. Pitched by Intel as the ultimate data center SSD, the SSD 910 may be the first effort by Intel in this form factor, but the components used are well known. The controller in the 910 is an Intel/Hitachi collaboration that has been released in a few Hitachi enterprise SSDs (SSD400M, SSD400S.B) and has a history of strong mixed workload performance. Of course Intel's own 25nm MLC NAND and firmware is involved as well, leading to an integrated application accelerator that's full of Intel storage IP. The net result is performance out of the SSD 910 that can reach up to 2GB/s sequential reads and 1GB/s sequential writes in normal mode and writes of up to 1.5GB/s in high performance mode.
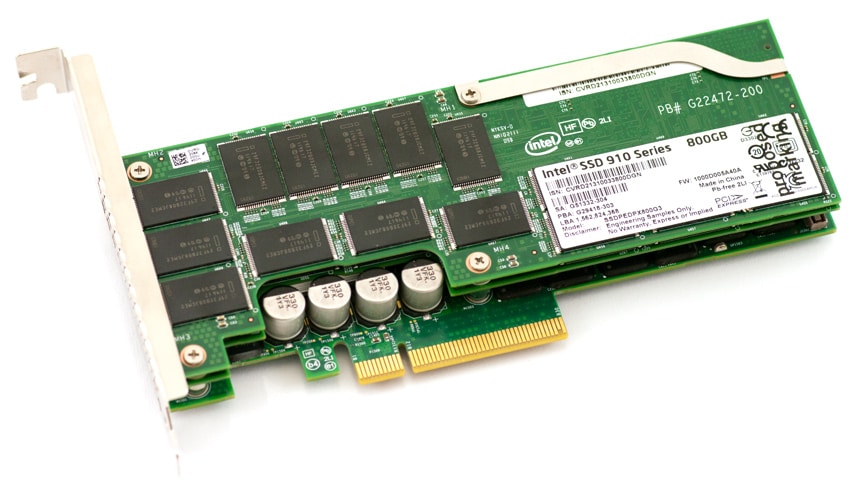
Intel offers the 910 in two capacities, 400GB and 800GB. Both are half-height, half-length (HHHL) cards that use the PCIe x8 interface. The 400GB version offers two NAND modules, while the 800GB has four. Each module is 200GB with its own ASIC and SAS interface. An on-board PCIe to SAS bridge chip handles translation to the PCIe 2.0 x8 interface. Interestingly, Intel offers a software switch for the 800GB card to enable max performance mode. In this mode the 800GB drive gets a write performance boost of 50%. The functionality is disabled by default, as the card requires server-grade cooling to protect the drive and over-spec power from the PCIe bus, but can be turned on via Intel's included software tools.
Like other storage vendors, Intel has their own NAND management scheme to get the most out of NAND performance and endurance. Intel calls theirs High Endurance Technology (HET), which is the combination of Intel's NAND wear reduction techniques and NAND characterization. In combination with HET, Intel's controller design and firmware have been tuned for endurance, which is 7PB worth of writes (8KB) to the 400GB card and 14PB for the 800GB card. Additionally, the SSD 910 supports enhanced power loss data protection, data path error protection, redundant array of surplus NAND for parity protection, self-diagnostics at power-on and thermal sensors. All of these features combine to ensure data integrity and drive reliability over its life.
Intel SSD 910 Specifications
- Capacities
- 400GB
- Sequential Read: 1,000 MB/s (128KB, steady state)
- Sequential Write: 750 MB/s (128KB, steady state)
- Random Read: 90,000 IOPS (4KB, steady state)
- Random Write: 38,000 IOPS (4KB, steady state)
- 800GB
- Sequential Read: 2,000 MB/s (128KB, steady state)
- Sequential Write: 1,000/1,500 MB/s (128KB, steady state)
- Random Read: 180,000 IOPS (4KB, steady state)
- Random Write: 75,000 IOPS (4KB, steady state)
- 400GB
- 25nm Intel NAND Flash Memory Multi-Level Cell (MLC) with High Endurance Technology (HET)
- Read Latency: < 65μs (512b)
- Write Latency: < 65μs (512b)
- Interface: PCI Express 2.0 x8
- Power Consumption
- Active: <25W Typical Stock, <28W Typical Max Performance Mode
- Idle: 8 / 12W Typical (400 / 800GB)
- Peak: 38W in Max Performance Mode
- Form Factor: HHHL
- Lifetime Endurance (400GB / 800GB): 7/14 PB with 8K writes, 5/10 PB with 4K writes
- Dimensions: 69 x 168 x 19mm
- Weight: 125 / 190g (400 / 800GB)
- Operating Temperature
- 0°C to 55°C with 200 LFM (linear feet per minute) airflow
- 0°C to 55°C with 300 LFM (linear feet per minute) airflow (Max performance mode)
- OS Compatibility
- Microsoft: Windows Server 2008 R2 SP1/SP2, Windows Server 2003 R2 SP2, Windows 7
- Linux: RHEL 5.5, 5.6, 6.1, SUSE Server 11
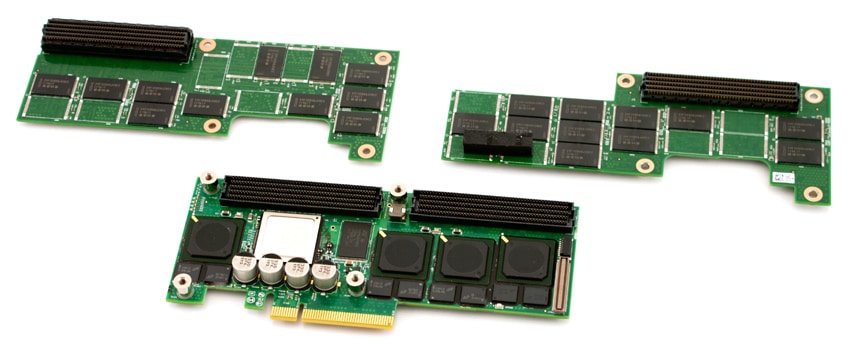
Build and Design
The Intel SSD 910 is a Half-Height Half-Length x8 PCI-Express card featuring the three-layer design that incorporates a main board and two flash-loaded daughter boards. Intel aims for widespread compatibility with the SSD 910 Series, using a LSI PCIe-to-SAS bridge with extensive Windows and Linux driver support that links together four Intel SAS controllers. Unlike other multi-controller PCIe Application Accelerator layouts, excluding Fusion ioMemory devices, the Intel SSD 910 reports in JBOD mode. This means the operating system must link together the devices in RAID0 to strip performance across each onboard SSD.
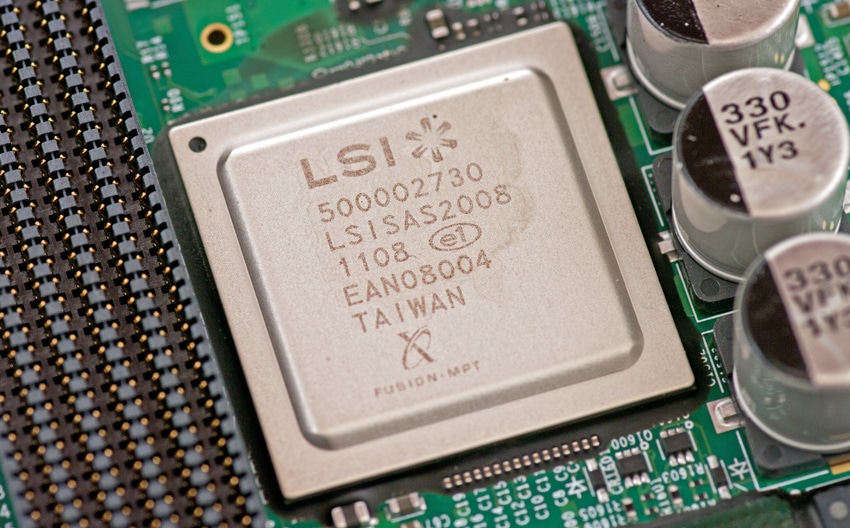
The LSI SAS2008 PCIe-to-SAS bridge links each SSD to the motherboard, although unlike its implementation in the LSI Nytro WarpDrive, it doesn't use hardware RAID0 to create one large 800GB SSD. One of the biggest advantages to this chipset is its built-in driver support in most major operating systems.
At the heart of the Intel SSD 910 are four Intel EW29AA31AA1 controllers which up until the 910 were found exclusively inside Hitachi Ultrastar SSDs such as the SLC-based SSD400S.B or the eMLC-based SSD400M. In this particular configuration they were also used with eMLC NAND, although with much less NAND per controller. In those SAS configurations, Hitachi equipped upwards of 400GB of usable space per controller, versus 200GB per segment inside the SSD 910.
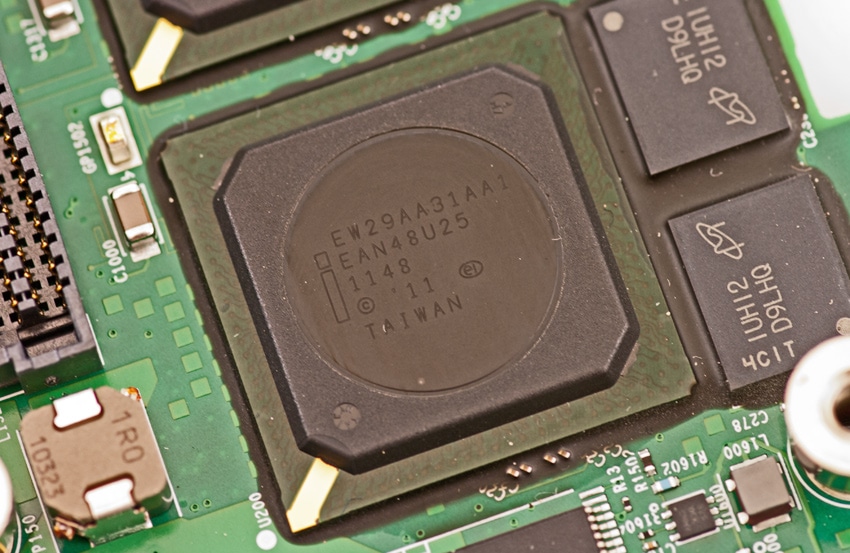
In terms of overall components, the 800GB version of the Intel SSD 910 uses 56 pieces of 32GB eMLC NAND (28 per daughter board) with 2GB of RAM for cache. This gives the 800GB SSD 910 a raw capacity of 1,792GB, helping prolong its useful life and explaining the 10-14PB endurance depending on workload type.
Management Software
When it comes to management software, Intel includes their SSD DataCenter Tool, which offers a CLI interface in both Windows and Linux. In terms of management capabilities and ease of use, Intel ranks towards the lower end of the scale with LSI, versus Fusion-io and Micron which include much better offerings and graphical interfaces. The Intel utility allows users to monitor SMART health stats, offering a secure erase function, as well as changing attributes that change the allowable power draw of the PCIe device. The latter function plays into the 800GB SSD 910's write performance, which scales from 1GB/s to 1.5GB/s.
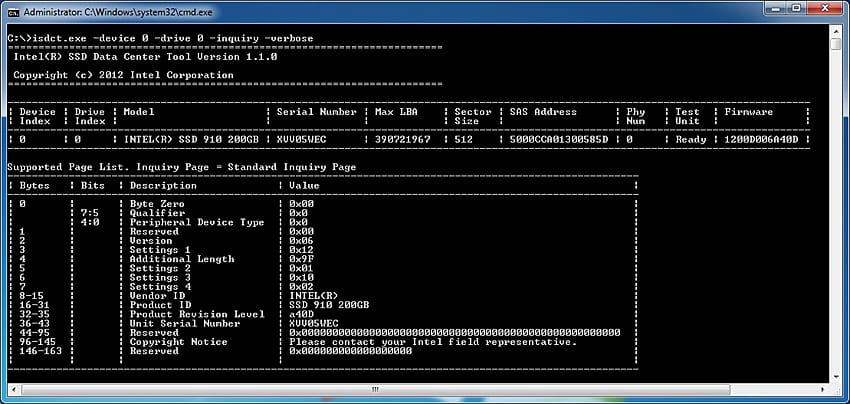
Additional features of the SSD DataCenter Tool include the ability to update the firmware on the device, as well as an over-provisioning tool to resize user per individual SSD to further increase endurance and performance in some cases. Temperature is reported, but only in a hexadecimal value. Missing from the tool are the capabilities to monitor real-time traffic to the device or the ability to monitor devices remotely across a network. For advanced users most common features are available, but the access drilling down on a controller-by-controller basis makes things very cumbersome.
Testing Background and Comparables
When it comes to testing enterprise hardware, the environment is just as important as the testing processes used to evaluate it. At StorageReview we offer the same hardware and infrastructure found in many datacenters where the devices we test would ultimately be destined for. This includes only testing with enterprise servers as well as proper infrastructure equipment like enterprise networking, rack space, power conditioning/monitoring, and same-class comparable hardware to properly evaluate how a device performs. None of our reviews are paid for or controlled by the manufacturer of the equipment we are testing; with relevant comparables picked at our discretion from products we have in our lab.
StorageReview Enterprise Testing Platform:
- 2 x Intel Xeon X5650 (2.66GHz, 12MB Cache)
- Windows Server 2008 Standard Edition R2 SP1 64-Bit and CentOS 6.2 64-Bit
- Intel 5500+ ICH10R Chipset
- Memory – 8GB (2 x 4GB) 1333Mhz DDR3 Registered RDIMMs
When it came to choosing comparables for this review, we chose the front-runners from each manufacturer, but only in areas that made sense against the eMLC-equipped Intel SSD 910. For that reason we dropped off the first-generation LSI WarpDrive as it was replaced by the second-generation Nytro WarpDrive, as well as the OCZ Z-Drive R4 which fell too far outside the latency curve for the needs of the performance enterprise storage market.
640GB Fusion-io ioDrive Duo
- Released: 1H2009
- NAND Type: MLC
- Controller: 2 x Proprietary
- Device Visibility: JBOD, software RAID depending on OS
- Fusion-io VSL Windows: 3.1.1
- Fusion-io VSL Linux 3.1.1
800GB Intel SSD 910
- Released: 1H2012
- NAND Type: eMLC
- Controller: 4 x Intel EW29AA31AA1 through LSI SAS2008 PCIe to SAS Bridge
- Device Visibility: JBOD, software RAID depending on OS
- Intel Windows: 13.0
- Intel Linux: Native CentOS 6.2 driver
200GB LSI Nytro WarpDrive WLP4-200
- Released: 1H2012
- NAND Type: SLC
- Controller: 4 x LSI SandForce SF-2500 through LSI SAS2008 PCIe to SAS Bridge
- Device Visibility: Fixed Hardware RAID0
- LSI Windows: 2.10.51.0
- LSI Linux: Native CentOS 6.2 driver
700GB Micron RealSSD P320h
- Released: 2H2011
- NAND Type: SLC
- Controller: 1 x Proprietary
- Device Visibility: Single Device
- Micron Windows: 7.03.3452.00
- Micron Linux: 1.3.7-1
Enterprise Synthetic Workload Analysis (Stock Settings)
The way we look at PCIe storage solutions dives deeper than just looking at traditional burst or steady-state performance. When looking at averaged performance over a long period of time, you lose sight of the details behind how the device performs over that entire period. Since flash performance varies greatly as time goes on, our new benchmarking process analyzes the performance in areas including total throughput, average latency, peak latency, and standard deviation over the entire preconditioning phase of each device. With high-end enterprise products, latency is often more important than throughput. For this reason we go to great lengths to show the full performance characteristics of each device we put through our Enterprise Test Lab.
We have also added performance comparisons to show how each device performs under a different driver set across both Windows and Linux operating systems using the Fio workload generator. For Windows, we use the latest drivers at the time of original review, which each device is then tested under a 64-bit Windows Server 2008 R2 environment. For Linux, we use 64-bit CentOS 6.2 environment, which each Enterprise PCIe Application Accelerator supports. Our main goal with this testing is to show how OS performance differs, since having an operating system listed as compatible on a product sheet doesn't always mean the performance across them is equal.
All devices tested go under the same testing policy from start to finish. Currently, for each individual workload, devices are secure erased using the tools supplied by the vendor, preconditioned into steady-state with the identical workload the device will be tested with under heavy load of 16 threads with an outstanding queue of 16 per thread, and then tested in set intervals in multiple thread/queue depth profiles to show performance under light and heavy usage. For tests with 100% read activity, preconditioning is with the same workload, although flipped to 100% write.
Preconditioning and Primary Steady-State Tests:
- Throughput (Read+Write IOPS Aggregate)
- Average Latency (Read+Write Latency Averaged Together)
- Max Latency (Peak Read or Write Latency)
- Latency Standard Deviation (Read+Write Standard Deviation Averaged Together)
At this time Enterprise Synthetic Workload Analysis includes four full-random profiles, which can attempt to reflect real-world activity. These were picked to have some similarity with our past benchmarks, as well as a common ground for comparing against widely published values such as max 4K read and write speed, as well as 8K 70/30 commonly used for enterprise drives. We also included two legacy mixed workloads, including the traditional File Server and Webserver offering a wide mix of transfer sizes. These last two will be phased out with application benchmarks in those categories as those are introduced on our site, and replaced with new synthetic workloads.
- 4K
- 100% Read or 100% Write
- 100% 4K
- 8K 70/30
- 70% Read, 30% Write
- File Server
- 80% Read, 20% Write
- 10% 512b, 5% 1k, 5% 2k, 60% 4k, 2% 8k, 4% 16k, 4% 32k, 10% 64k
- Webserver
- 100% Read
- 22% 512b, 15% 1k, 8% 2k, 23% 4k, 15% 8k, 2% 16k, 6% 32k, 7% 64k, 1% 128k, 1% 512k
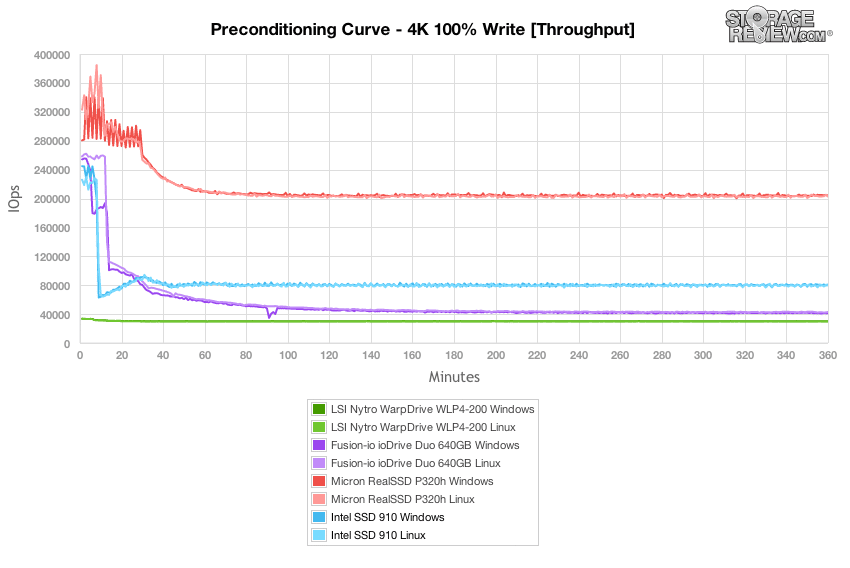
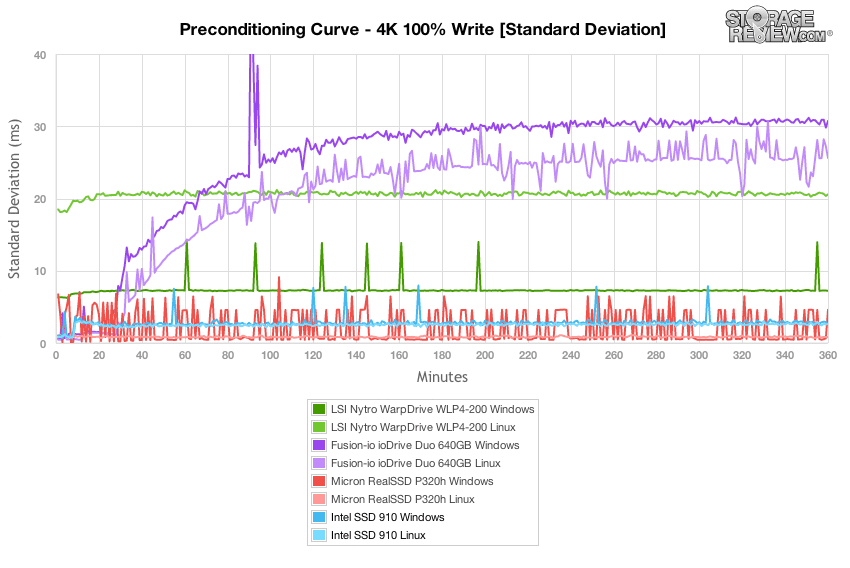
In our first workload we measure the performance of a 4K 100% random write saturation test with a load of 16T/16Q (effective queue depth of 256). Intel lists the steady-state performance of the SSD 910 in this type of condition at 75,000 IOPS for our 800GB capacity. We measured just under 80,000 IOPS from the 910 over the duration of our test.
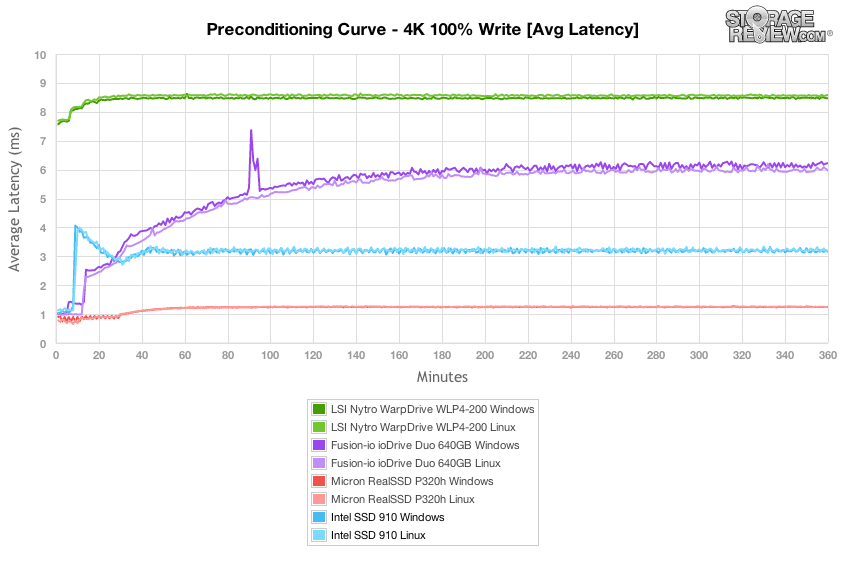
Switching from throughput to average latency we measured a response time of just over 3ms from the Intel SSD 910 as it entered steady-state. This gives it an edge over the current-generation LSI Nytro WarpDrive as well as the previous-generation Fusion ioDrive Duo.
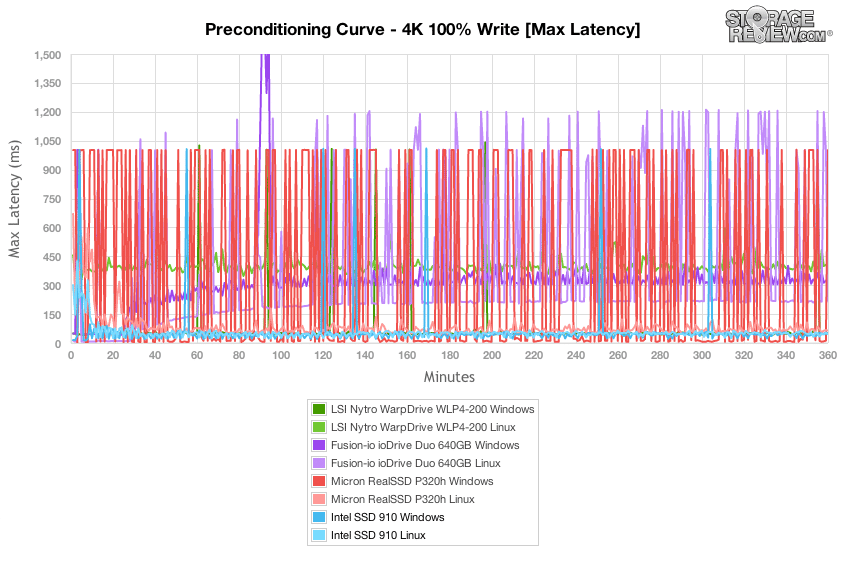
Comparing the max latency on an interval by interval basis over the course of our preconditioning stage, the Intel SSD 910 with its eMLC NAND performed quite well, in line with the SLC-based Nytro WarpDrive and Micron P320h.
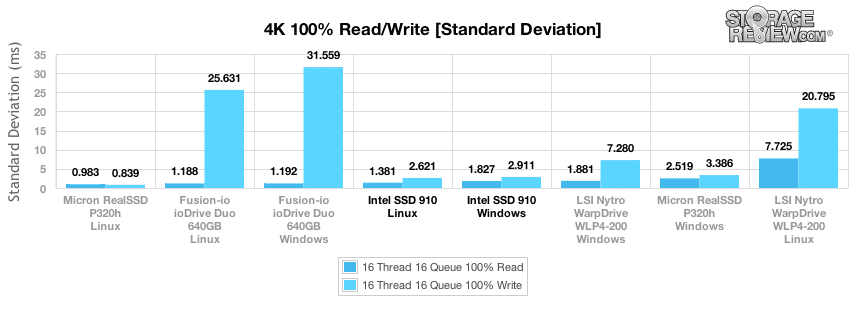
Looking at the entire spread of latency over the 4K 100% write preconditioning test in our standard deviation chart, the eMLC-based Intel SSD 910 came in ahead of the SLC LSI Nytro WarpDrive, and just trailed the Micron P320h slightly.
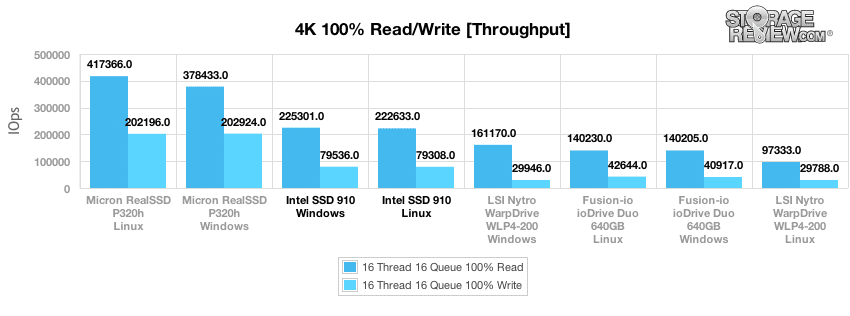
After each drive exited its preconditioning stage, we look a longer sample of performance to show what each drive is capable of well after it reaches steady-state. We measured performance of 225,301 IOPS read and 79,536 IOPS write in Windows, with 222,633 IOPS read and 79,308 IOPS write in Linux. The official performance spec listed by Intel with a 4K workload for the 800GB capacity model is 180,000 IOPS read and 75,000 IOPS write, so we could easily say the SSD 910 came in well above our initial expectations.
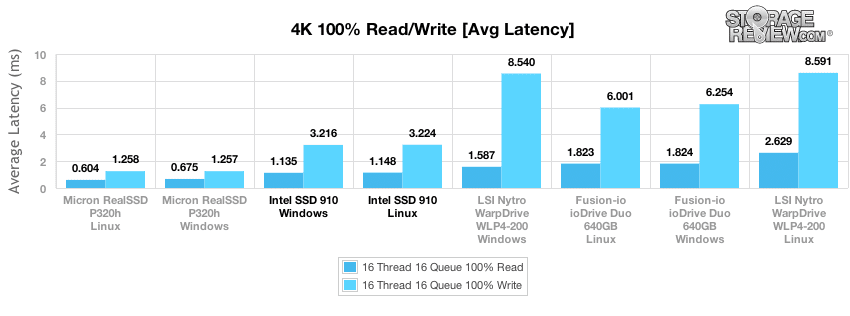
Average latency measured from the Intel SSD 910 in our 4K random read and write test was very good in both Linux and Windows. The only drive that offered faster read and write performance in this category was the Micron P320h.
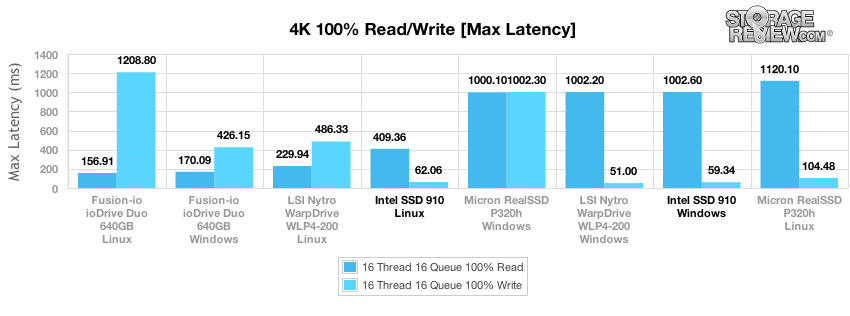
Switching our view from average latency to peak response times, we found the Linux driverset for the Intel SSD 910 to offer the lowest peak response times for read performance, with Windows having a slight edge in write performance.
Looking at the latency standard deviation, Linux offered a more stable platform for the Intel SSD 910, having slightly more consistent read and write response times.
Our next test shifts the shifts the focus to our 8K 70/30 workload, where the Intel SSD 910 lost its edge against the LSI Nytro WarpDrive, but still offered an improvement in performance compared to previous-generation Fusion ioDrive Duo.
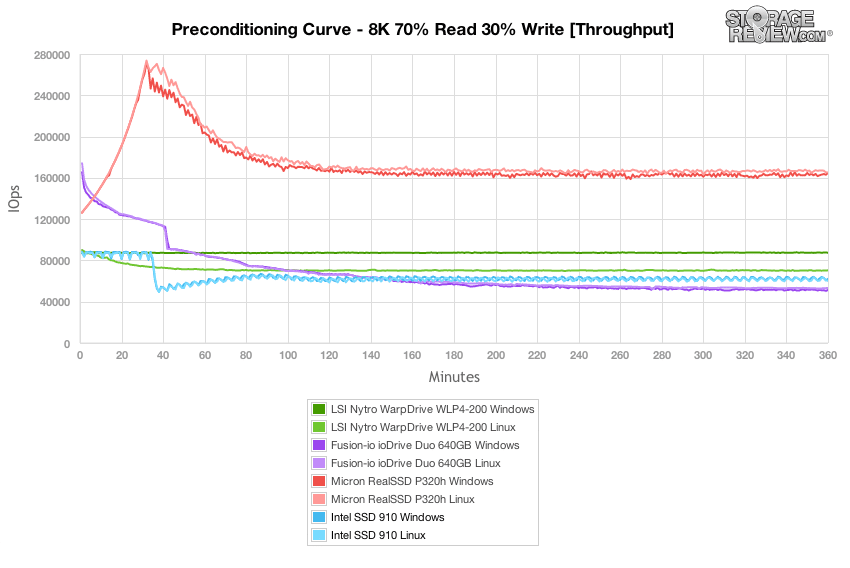
Similar to the 100% 4K random write preconditioning stage, the Intel SSD 910 offered similar performance in both Linux and Windows, although in this segment we start to see Windows offering a slight lead.
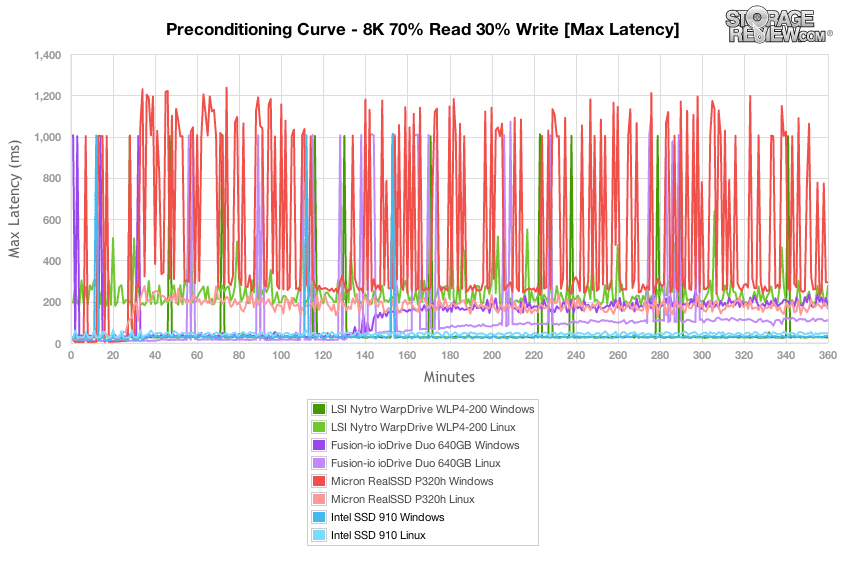
In the 8K 70/30 workload, the Intel SSD 910 and LSI Nytro WarpDrive (in Windows) offered the lowest peak response times, edging out even the Micron RealSSD P320h.
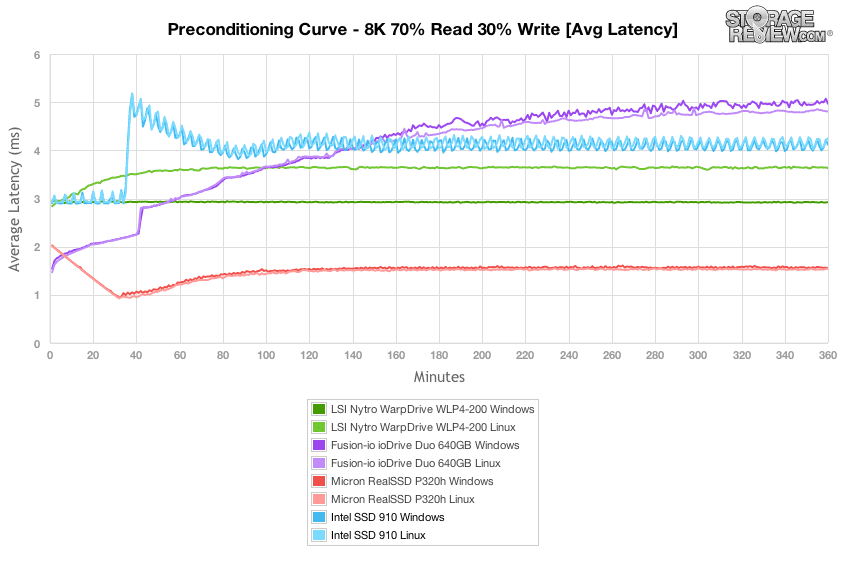
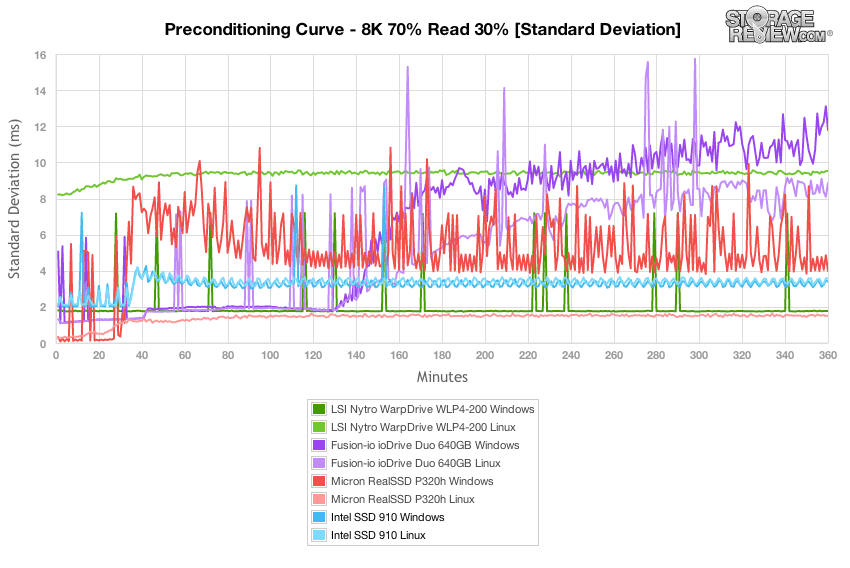
Diving in deeper into the latency over the duration of our 8K 70/30 test, the Intel SSD 910 offered what no other PCIe Application Accelerator could; matching latency consistency across both Windows and Linux driversets. While the other competing PCIe AA models offered vastly different latency profiles in both operating systems, the 910 came in with roughly equivalent performance in Server 2008 R2 and CentOS 6.2.
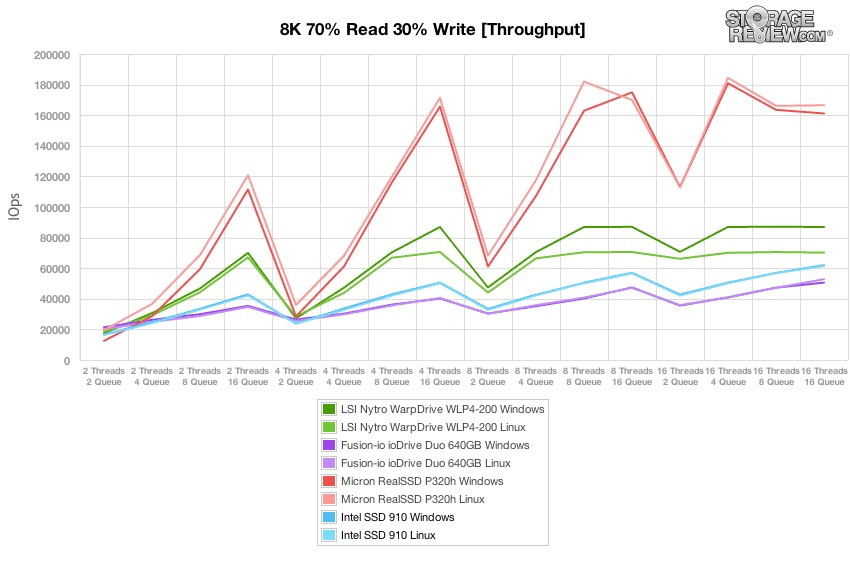
Compared to the fixed 16 thread, 16 queue max workload we performed in the 100% 4K write test, our mixed workload profiles scale the performance across a wide range of thread/queue combinations. In these tests we span our workload intensity from 2 threads and 2 queue up to 16 threads and 16 queue. In the expanded 8K 70/30 test, the Intel SSD 910 lags behind the SLC-based current-generation Micron RealSSD P320h and the LSI NytroWarpDrive. It does offer a slight lead in throughput over the Fusion ioDrive Duo, but it is also much newer than that product that is being already being replaced.
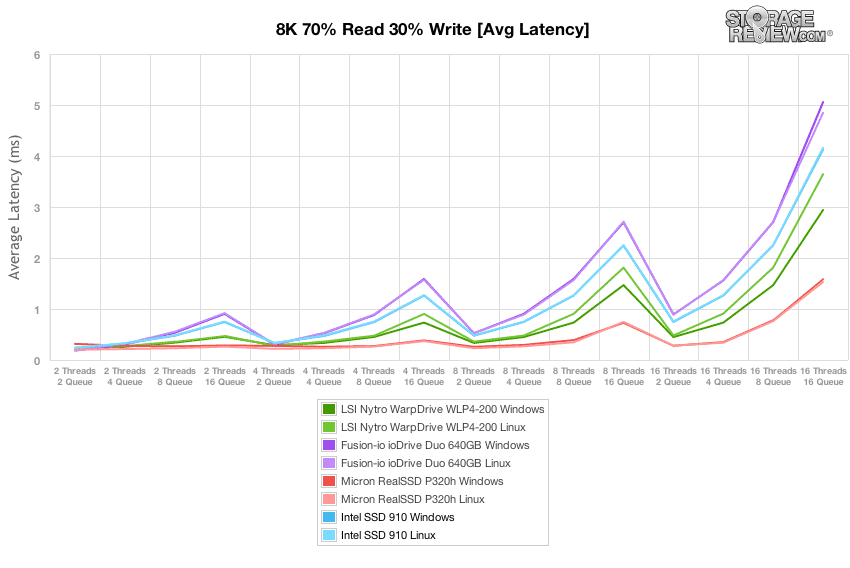
Comparing average latency, the Intel SSD 910 offered near-identical performance across each of the 8K 70/30 thread/queue combinations.
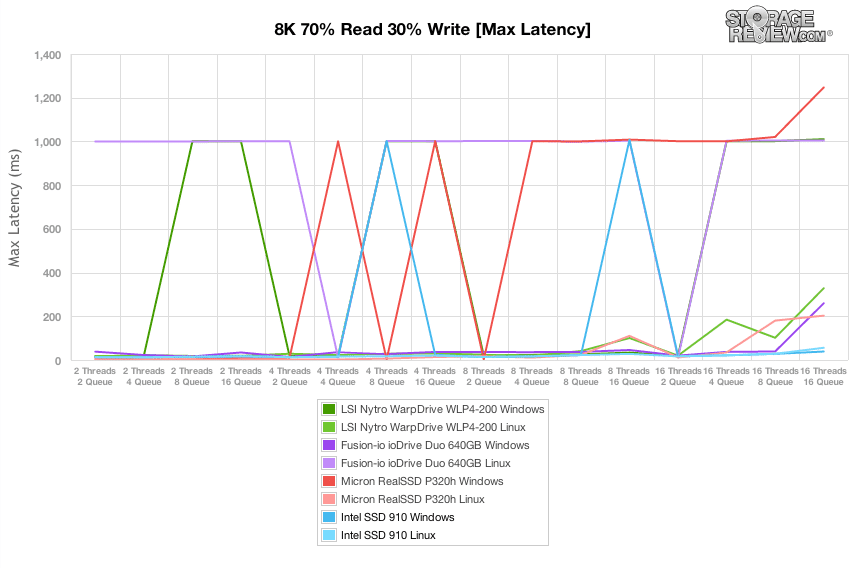
Comparing peak response times over the entire range of thread and queue depth combinations in our tests, the Intel SSD 910 had a few 1,000ms blips on the Windows side and stayed fairly calm in the Linux.
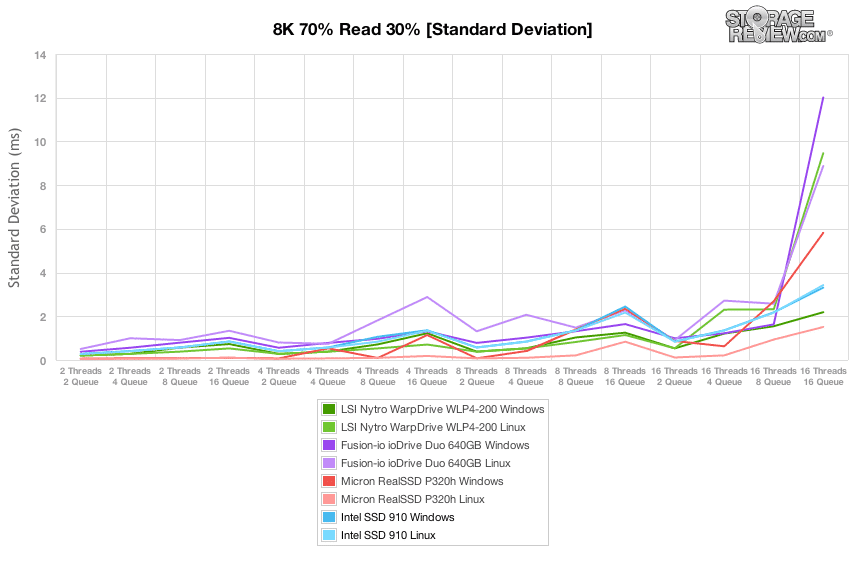
Switching focus to latency consistency in our standard deviation test, the Intel SSD 910 came in middle of the pack in the lighter workloads, and moved towards the top of the pack in the 16T/16Q load.
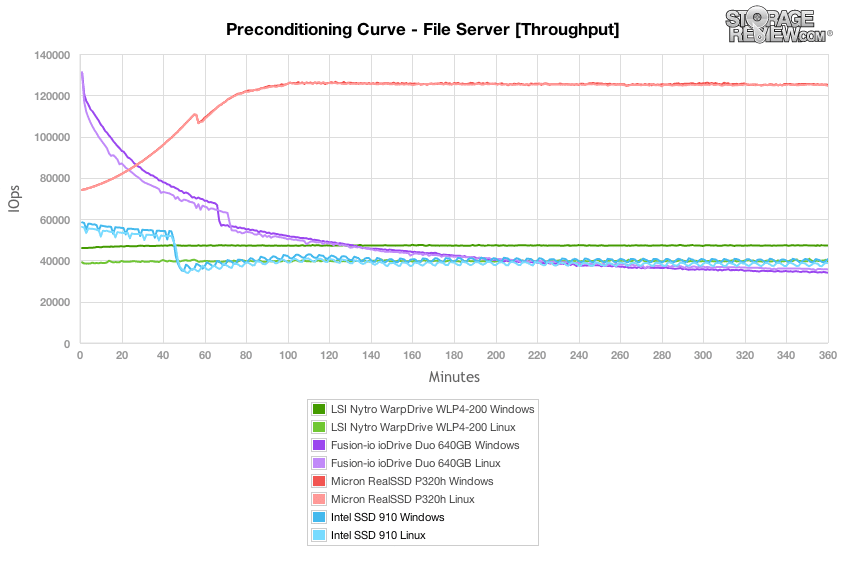
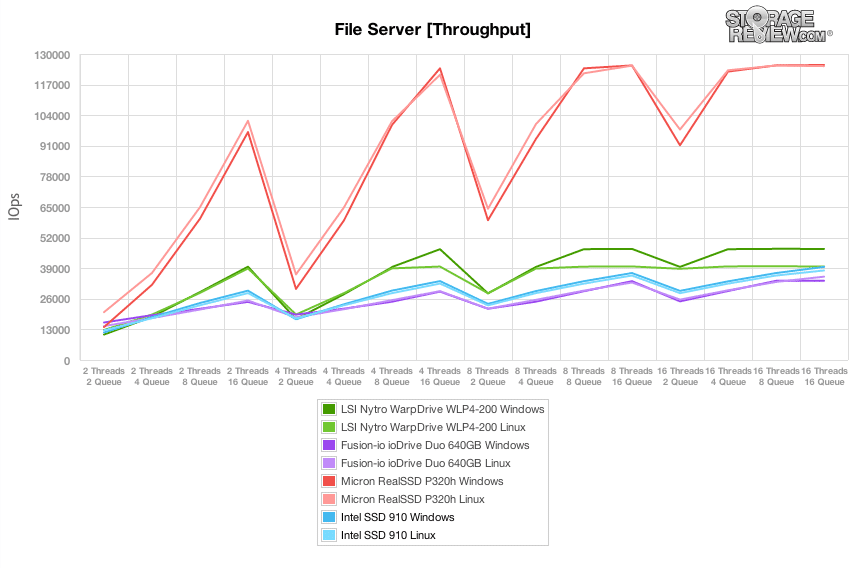
The File Server workload represents a larger transfer-size spectrum hitting each particular device, so instead of settling in for a static 4k or 8k workload, the drive must cope with requests ranging from 512b to 64K. In this workload as the Intel SSD 910 has to start coping with a broader range of transfer sizes, the performance gap between the Windows and Linux driversets widens, with Windows taking the lead. In terms of performance compared to other PCIe AAs on the market, it comes in under the LSI Nytro WarpDrive (in Windows) and above the Fusion ioDrive Duo, but comes in with roughly a third of the performance of the Micron RealSSD P320h.
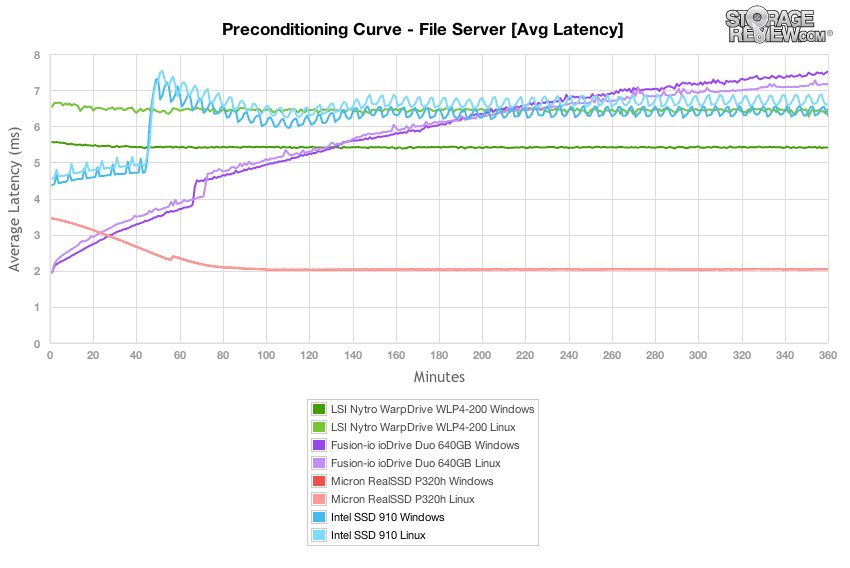
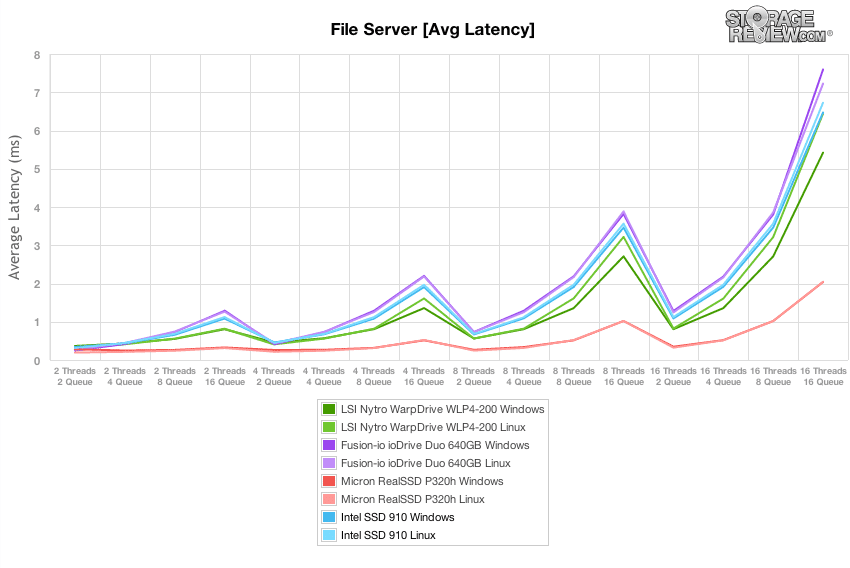
Comparing average latency of the Intel SSD 910 in our File Server preconditioning phase, the gap in performance between Linux and Windows starts to become visible, although still very close compared to the LSI Nytro WarpDrive.
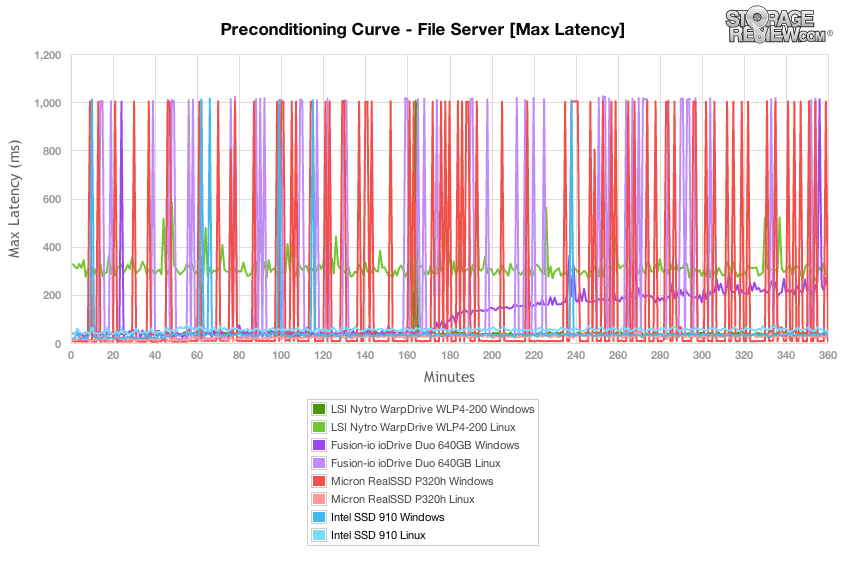
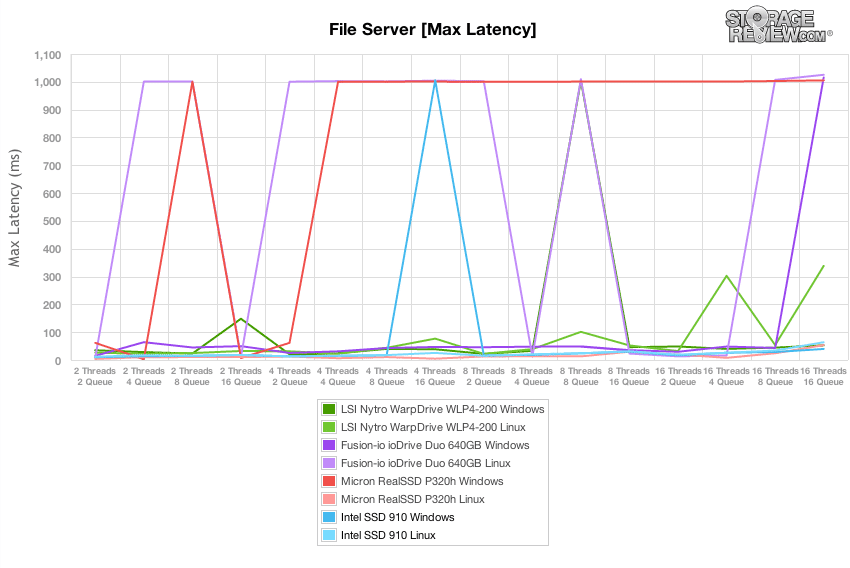
Outside of a few 1,000ms blips at a 16T/16Q load, the Intel SSD 910 floated sub 100ms over most of the File Server preconditioning segment.
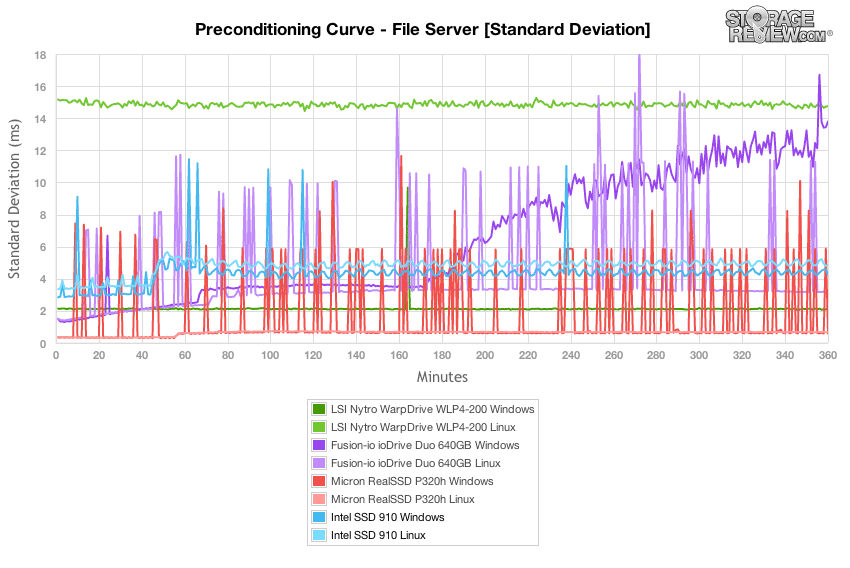
Comparing the latency standard deviation between models, as the type of workload got tougher, the consistency of the Intel SSD 910 slipped slightly from what we saw in either the 4K or 8K workloads. In this test the SSD 910 fell behind the Micron P320h in Windows and Linux, LSI Nytro WarpDrive in Windows, and Fusion ioDrive Duo in Linux. Our of each of the drives in this group though, it still had the most similar latency curve between Linux and Windows.
After the File Server preconditioning process had completed with a constant 16T/16Q load, we dropped into our main tests which measure performance at set levels between 2T/2Q and 16T/16Q. In our File Server workload, the Intel SSD 910 offered a small bump in performance over the Fusion ioDrive Duo across each step in effective queue depth (except 2T/2Q and 4T/2Q) but trailed the LSI Nytro WarpDrive. Compared to the Micron RealSSD P320h though, there was little comparison as it peaked at speeds 3-4x over the SSD 910.
The Intel SSD 910 came in at the lower middle of the pack of high-endurance PCIe Application Accelerators in terms of average latency in our File Server test. Comparing Windows to Linux performance we saw very little variation, which the same couldn't be said about the LSI Nytro WarpDrive using the same PCIe-to-SAS bridge.
Over the wide range of loads during our File Server workload, the Intel SSD 910 saw just one 1,000ms latency spike.
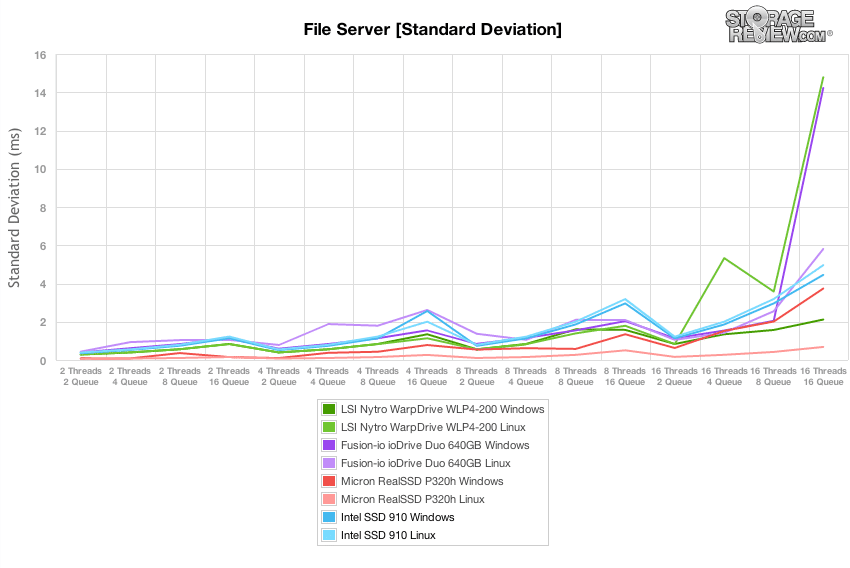
Taking a closer look at the latency standard deviation in our File Server test, while the Intel SSD 910 had just one high-latency blip, its overall latency consistency was more spread out than other drives at lower loads. At the highest 16T/16Q load in ranked middle of the pack, with very similar performance between Windows and Linux.
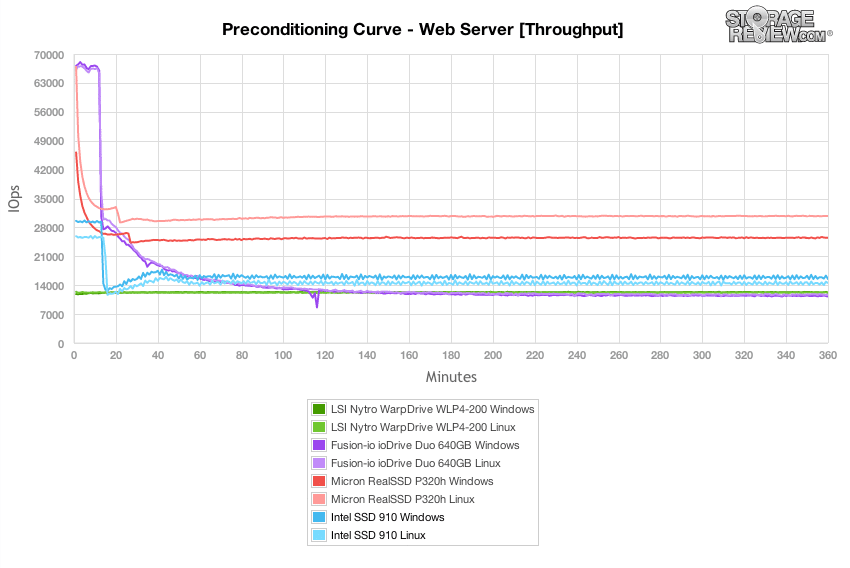
In our last synthetic workload covering a Web Server profile, which is traditionally a 100% read test, we apply 100% write activity to fully precondition each drive before our main tests. Under this stressful preconditioning test the Intel SSD 910 leveled off with performance ranking second in this group, under the Micron RealSSD P320h. The cross-OS performance that nearly matched in previous tests started to separate and become more pronounced.
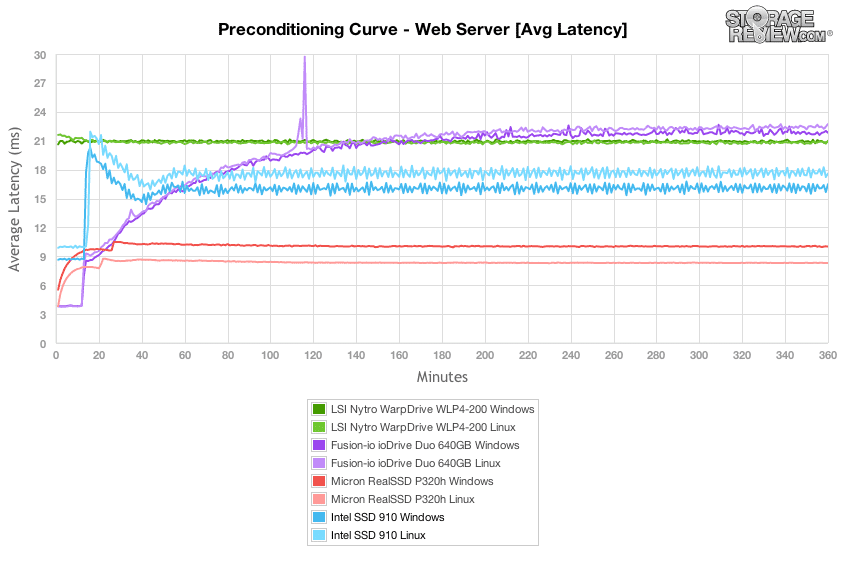
Comparing average latency, you can see the unique steady-state heart-beat of the SSD 910 which is unlike any other PCIe AA we have tested to date. In this stage of the Web Server test Windows offered the edge in performance.
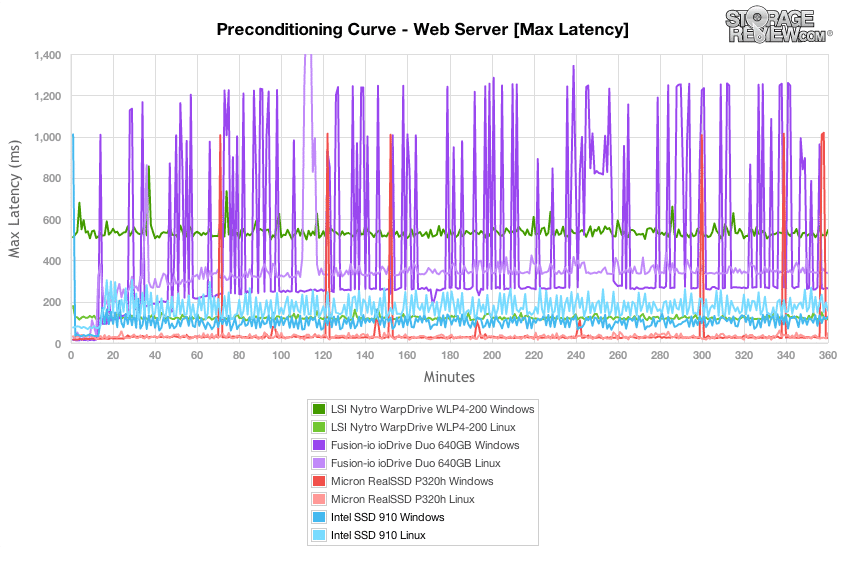
The Intel SSD 910 fared very well in terms of peak response times in the preconditioning stage of our Web Server test. Over the 6 hour process, lax latency varied between 100-300ms, and was only out-paced but the SLC-based Micron RealSSD P320h.
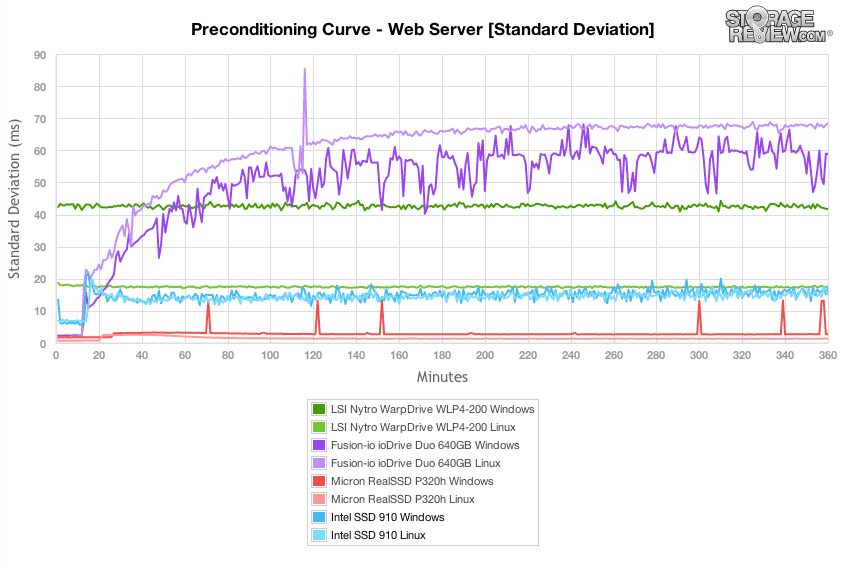
Looking at latency at a deeper level in our standard deviation test, the Intel SSD 910 offered consistency only surpassed by the Micron RealSSD P320h. Unlike both the Fusion ioDrive Duo and LSI Nytro WarpDrive the standard deviation was matched between its Windows and Linux performance.
Switching to the main segment of our Web Server test with a 100% read profile, the Intel SSD 910 offered performance in line with the SLC-based LSI Nytro WarpDrive, and above the Fusion ioDrive Duo. It wasn't able to match the performance of the Micron RealSSD P320h though that peaked at 170,000 IOPS versus under 70,000 IOPS that the SSD 910 topped out at.
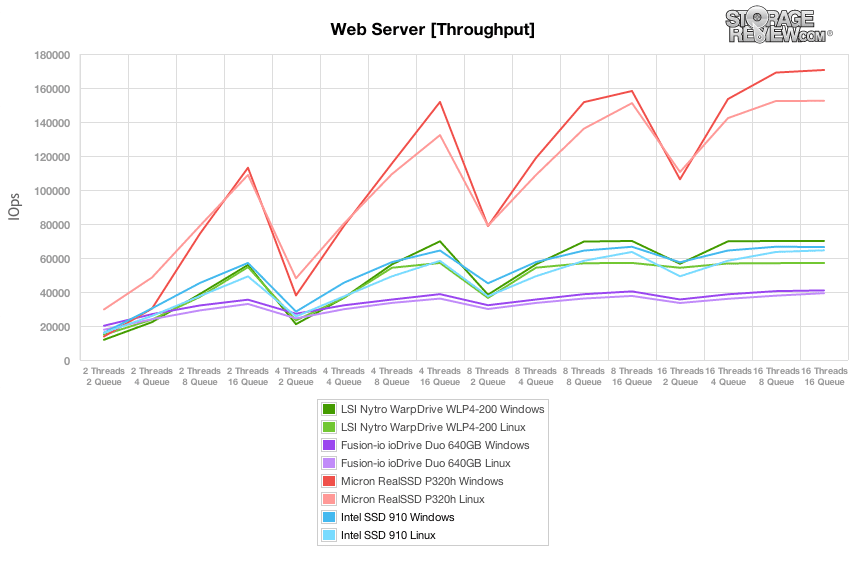
With a similar four-controller layout of both the Intel SSD 910 and LSI Nytro WarpDrive using the same PCIe-to-SAS bridge, it wasn't a huge surprise to see them performing neck and neck to each other over the entire load range. As with previous tests, the Intel 910 offered notably similar performance between Linux and Windows.
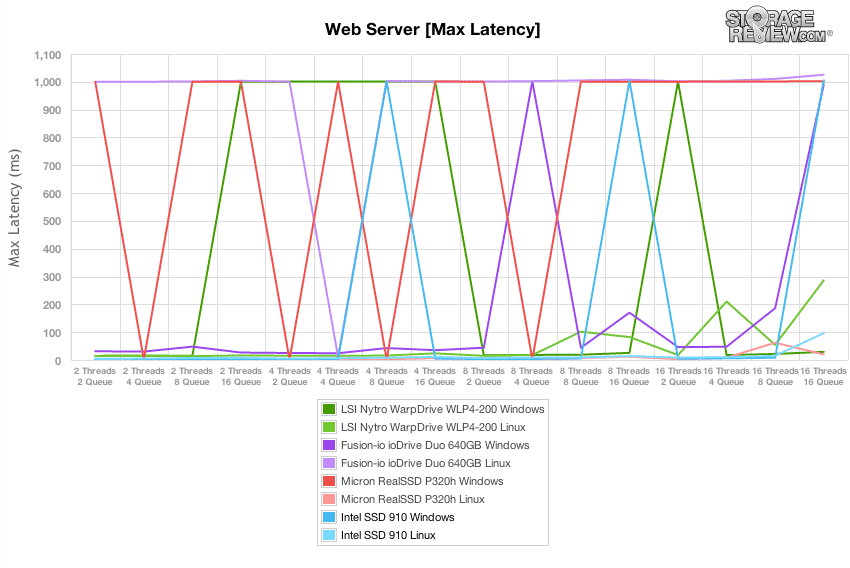
Switching to max latency, the Intel SSD 910 had a few blips upwards of 1,000ms in our Web Server test, which made it blend in with the other drives in this group.
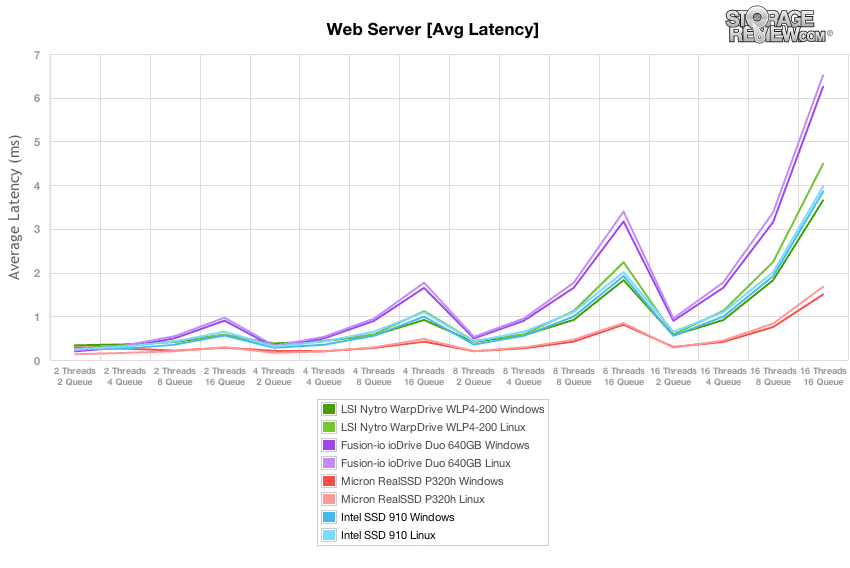
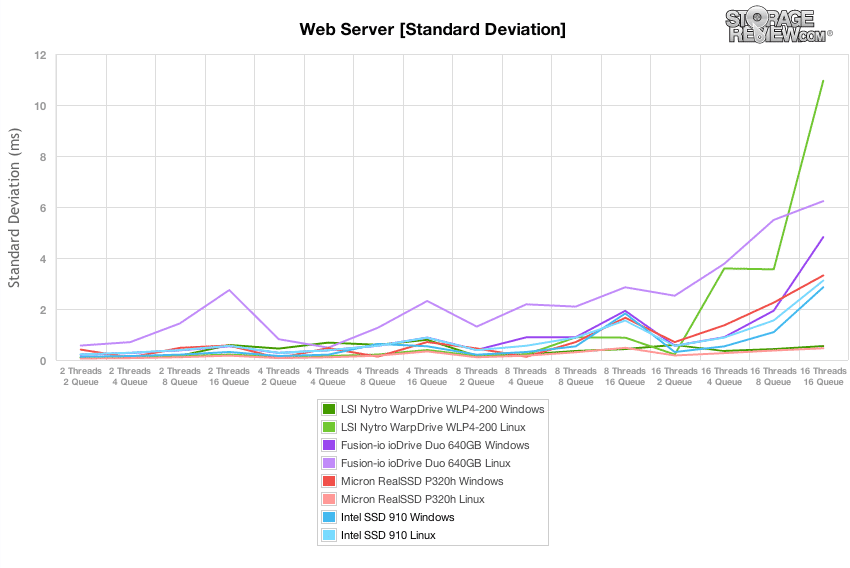
While it is hard to device the total view of latency looking at just single peak response times, our standard deviation test looks at the overall consistency of the response times over the entire test period. In this view the Intel SSD 910 offered very consistent latency in the read-only Web Server test, coming solidly in the middle of the pack across the different thread/queue loads.
Conclusion
The Intel SSD 910 is an interesting offering in the enterprise application accelerator space for a number of reasons. First, with its aggressive pricing, Intel is attempting to commoditize the entry-enterprise PCIe storage space, with a card that does very well in read performance (at this price level). The 400GB model for instance comes in at a place where high-end enthusiasts and those in the creative space may find the card compelling, while the higher performing 800GB version is just right for enterprises wanting to dip a toe in the PCIe flash market for mostly read-based workloads. The 910 is also a no frills kind of offering, with limited software management tools and plug-and-play compatibility with Linux, adding to the commodity message. Not that any of this is a bad thing, the 910 provides a potential bridge for those wanting a PCIe form factor and better performance, when compared to the entry-enterprise SATA and SAS-based offerings. The 910 also offers driver compatibility riding on the back of an LSI SAS2008 PCIe-to-SAS bridge and stability coming from the Intel controller, NAND and firmware stack, again making adoption more pain-free for first time application acceleration buyers.

In both our Windows Server 2008 R2 and CentOS 6.2 testing environments the Intel SSD 910 offered good performance. In areas of performance that matter most to enterprise users, such as latency, we measured exceptionally low peak latency and very consistent latency standard deviation. In terms of response times the Intel SSD 910 offered SLC-like performance, although when comparing throughput between solutions the 910's strength is clearly in read performance.
As noted, the SSD 910 offers excellent read performance per dollar, when compared to other flash cards. That's the good news, but when it comes to mixed workloads where we introduce moderate to heavy write activity, the SSD 910 lags behind the current-generation PCIe AA competition. Compared to the LSI Nytro WarpDrive, the SSD 910 offers slightly better OS consistency between Linux and Windows, but slumps behind when write activity is introduced. Compared to the Micron RealSSD P320h, it's night and day with the P320h offering 3-4x the performance depending on the workload. For an entry-level PCIe solution this isn't a bad thing, as most of the competing current-generation PCIe AA comparables have a higher starting cost. The down side though is Intel's first PCIe entry to is just starting to perform at a level where competitors were two or more years ago.
Pros
- Strong read performance peaking 2GB/s sequential
- Very low entry cost with great endurance
- Built-in OS compatibility with LSI SAS2008
- Trusted Intel enterprise controller
Cons
- Weak management software
- Write-heavy performance slips behind current-generation PCIe competition
Bottom Line
The Intel SSD 910 is a great option for enterprises who like the performance benefits of the PCIe interface, the heritage of stability that Intel offers and an aggressive pricing structure – for read-centric workloads. When moderate to heavy write workloads get introduced the card falls behind; but as a commodity or first-time PCIe flash device for an enterprise, the 910 could be a viable starting point depending on projected workload.
Intel SSD 910 at Amazon.com

 Amazon