

The SAS 616iSD 10G is part of an extensive line of block-level storage arrays offered by JetStor. The iSCSI 616iSD offers up to 48TB of storage via 16 3.5″ bays in a 3U enclosure. JetStor features dual redundant active/active RAID controllers and four 10GbE ports, two per controller. Each controller is powered by an Intel IOP342 64-bit Chevelon dual-core storage processor, and includes features like parity-assist ASIC, iSCSI-assist engine and TCP Offload Engine (TOE). Should 48TB prove insufficient, the 616iSD can be expanded with four JBOD shelves (SAS716J) for a maximum capacity of 240TB per array.
By its nature, the JetStor SAS 616iSD 10G is designed to be simple. Power it on, give it access to the Ethernet fabric, and off you go. JetStor’s simplicity in design operates throughout, with features like a cableless design internally, which while probably never seen, offers a greater ease of service should something go wrong. The unit also includes dual power supplies, turbo cooling fans and a three year warranty that covers all components with phone and email support for the life of the unit.
Jetstor SAS 616iSD 10G Specifications
- Host Ports: Two, 10 Gigabit Ethernet using iSCSI protocol, SFP+ Host Interfaces per redundant controller
- Disk Interface: 3Gb/s SAS
- Hard Drives Offered: 300GB (15k), 450GB (15k), 600GB SAS (15k), 1TB (7.2k), 2TB (7.2k) and 3TB (7.2k)
- Drives: 16 (3.5”)/ Up to 160 through two 3Gb/s SAS expansion ports
- RAID Modes Supported: RAID 0, 0+1, 1, 3, 5, 6, 10, 30, 50 and RAID 60, Global Hot Spare Disk, Auto Rebuild
- Intel IOP342 64-bit Chevelon dual-core storage processor on each controller
- 2GB Cache (default) – 4GB (optional) / DDR2-800 ECC Registered SDRAM
- Optional Battery Backup
- Two RJ45/Ethernet Management / Monitor ports
- SMTP manager and SNMP agent
- Power and Cooling
- Four Turbo Fans
- Power 110 or 220 VAC, ±20% @ 6 amps / 3 amps peak
- Two 460W PS/Fan modules w/PFC
- Environmental
- Relative Humidity 10% to 85% non-condensing (operating)
- Operating Temperature 50°F to 104°F
- 3U Physical Dimensions (W x D x H) 19″ wide, 22″ deep, 5.25″ high
- Weight (Without drives) 40 lb. / 18 kg.
- Operating Systems Supported: VMWare ESX Server, vSphere, Windows Server 2008, Windows Server 2003, XenServer, Oracle/Solaris, Linux, MAC OS X, and others to be announced
- Warranty: 3 years logic, 3 years power supplies, 5 years SAS drives, 3 or 5 years SATA drives
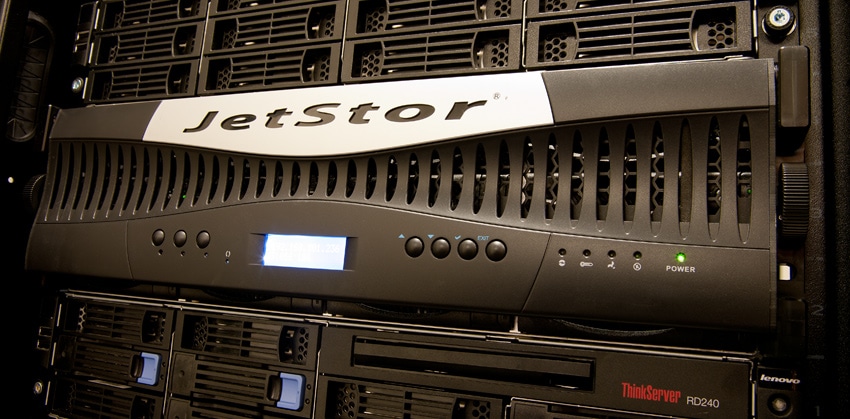
Design and Build
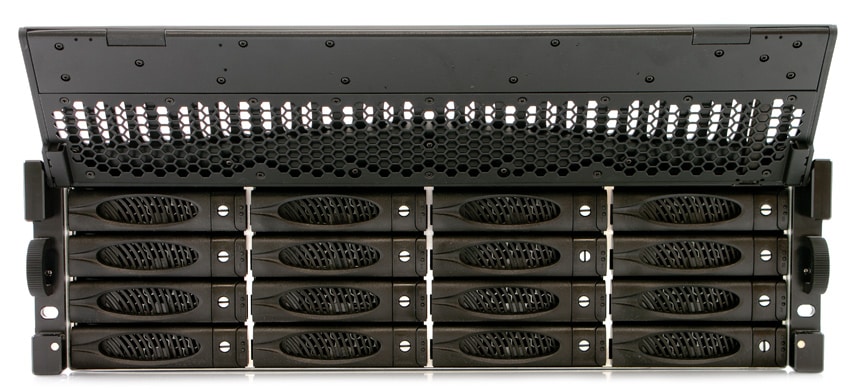
The JetStor SAS 616iSD is a 16-bay 10GbE-equipped dual-controller SAN. The front of the 616iSD features a basic user interface that displays information such as the current management IP without having to dive into your router or DHCP to track down what IP to hit for its web-based management. The front console includes a LCD, as well as a handful of buttons to drill down through menus to gain access to the SAN locally. To manage the hardware aspects of the JetStor model, simply flip up the entire face and gain access to the sixteen 3.5-inch drive bays underneath.
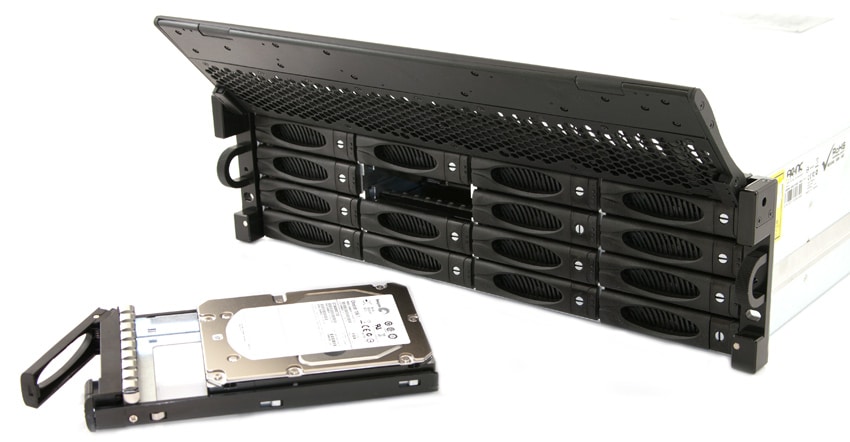
Our review JetStor SAS 616iSD 10G included twelve Seagate Cheetah 15K.7 ST3600057SS 600GB hard drives, though the system may be configured with a variety of 15K and 7,200 RPM drives. Each drive is mounted in its own hot-swap caddy, which allows easy replacement in the event of a drive failure. Each drive tray also includes a basic locking mechanism to prevent accidentally ejecting the wrong drive in a production environment.
To easily rack-mount the SAS 616iSD 10G, JetStor includes a basic non-sliding rail kit that easily setups in a few minutes. With the heft of the SAN easily weighing into the “team-lift” category, it’s probably best to get help lifting the SAN into the rack once the rails are mounted. The rails are easy to direct into the receiving slots, and it stays firmly positioned in our Eaton 42U rack without any indication of sagging once mounted.
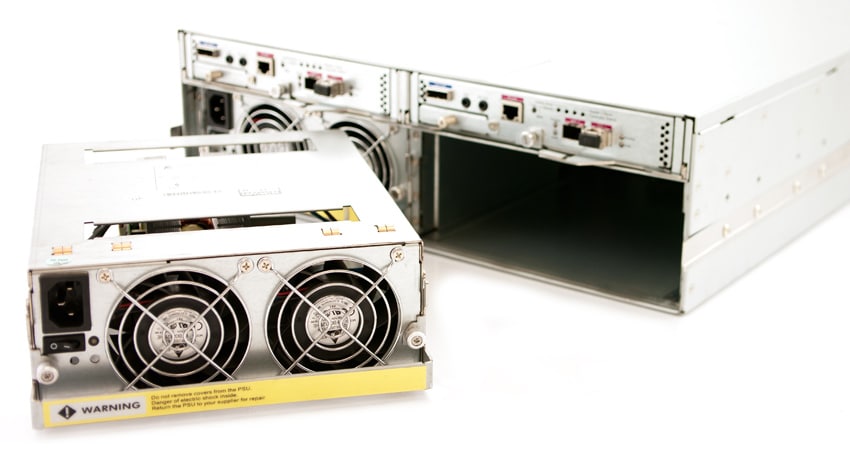
The view from the rear of the JetStor SAS 616iSD 10G shows the redundant disk controllers and power supplies. Both of these are quickly removed with thumb-screws, using a built-in lever and handle mechanism to both remove and firmly latch into place. Interface connections on the back include two SFP+ connections per controller (one port on each is populated with a fiber optic transceiver on our review unit), one management port per controller, as well as one SFF-8088 SAS connector per controller for external JBOD expansion using the SAS716J. There are also UPS and RS-232 connectors to allow for communication to other equipment.
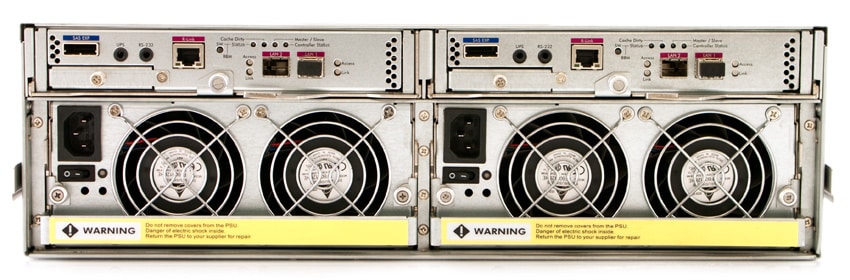
In the unlikely event of a controller needing replacement, it took us no more than 60 seconds to remove and reinsert the assembly when installed in our rack. While the locking levers do have thumb-screws JetStor still recommends that field technicians tighten the screws with a flathead screwdriver to make sure everything is installed securely.

The power supply was equally as simple to remove and reinstall, although its larger size required more careful effort to clear surrounding cables and equipment in the back of our test rack.
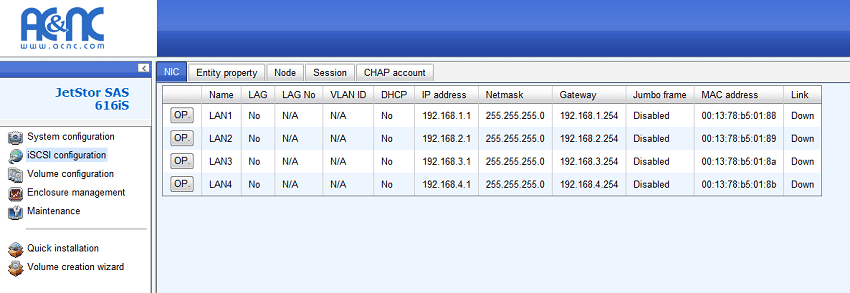
The JetStor web-management tools offered to configure the SAS 616iSD are easy to follow, but fairly basic in terms of design and implementation. From the first login, it was pretty easy to get the system operational, although the interface did seem slow at times. For a SMB or smaller-scale enterprise environment, it would be easy to manage a few of these platforms together, although an environment with more than a handful could cause some issues having to log into each device to configure individually.
Testing Background and Comparables
When it comes to testing enterprise hardware, the environment is just as important as the testing processes used to evaluate it. At StorageReview we offer the same hardware and infrastructure found in many datacenters where the devices we test would ultimately be destined for. This includes enterprise servers as well as proper infrastructure equipment like networking, rack space, power conditioning/monitoring, and same-class comparable hardware to properly evaluate how a device performs. None of our reviews are paid for or controlled by the manufacturer of the equipment we are testing.
StorageReview Enterprise Test Lab Overview
StorageReview 10GbE Enterprise Testing Platform:
- 2 x Intel Xeon X5650 (2.66GHz, 12MB Cache)
- Windows Server 2008 Standard Edition R2 SP1 64-Bit and CentOS 6.2 64-Bit
- Intel 5500+ ICH10R Chipset
- Memory – 8GB (2 x 4GB) 1333Mhz DDR3 Registered RDIMMs
Mellanox SX1036 10/40Gb Ethernet Switch and Hardware

- 36 40GbE Ports (Up to 64 10GbE Ports)
- QSFP splitter cables 40GbE to 4x10GbE
- Mellanox ConnectX-3 EN PCIe 3.0 Twin 10G Ethernet Adapter
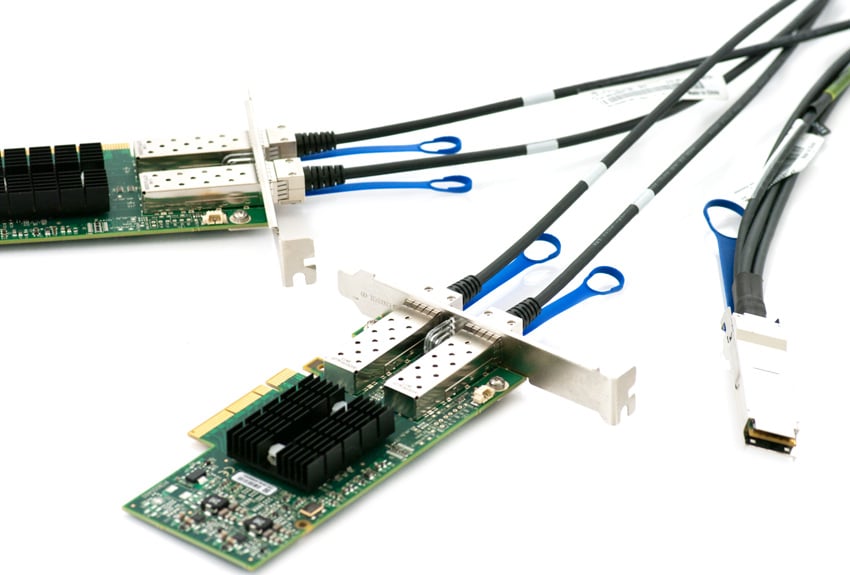
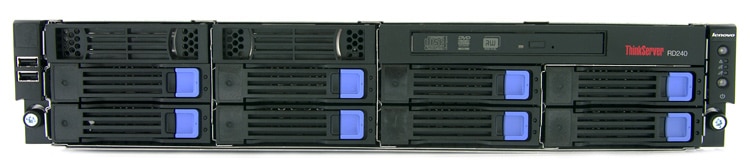
Our current 10/40Gb Ethernet SAN and NAS testing infrastructure consists of our Lenovo ThinkServer RD240 testing platform equipped with Mellanox ConnectX-3 PCIe adapters connected through Mellanox’s 36-port 10/40GbE switch. This environment allows the storage device we are testing to be the I/O bottleneck, instead of the networking gear itself.
Enterprise Synthetic Workload Analysis
For storage array reviews we precondition with a heavy load of 8 threads with an outstanding queue of 8 per thread, and then test in set intervals in multiple thread/queue depth profiles to show performance under light and heavy usage. For tests with 100% read activity, preconditioning is with the same workload, although flipped to 100% write.
Preconditioning and Primary Steady-State Tests:
- Throughput (Read+Write IOPS Aggregate)
- Average Latency (Read+Write Latency Averaged Together)
- Max Latency (Peak Read or Write Latency)
- Latency Standard Deviation (Read+Write Standard Deviation Averaged Together)
At this time Enterprise Synthetic Workload Analysis includes common sequential and random profiles, which can attempt to reflect real-world activity. These were picked to have some similarity with our past benchmarks, as well as a common ground for comparing against widely published values such as max 4K read and write speed, as well as 8K 70/30 commonly used for enterprise drives. We also included two legacy mixed workloads, including the traditional File Server and Webserver offering a wide mix of transfer sizes. These last two will be phased out with application benchmarks in those categories as those are introduced on our site, and replaced with new synthetic workloads.
- 1024K (Sequential)
- 100% Read or 100% Write
- 8K (Sequential)
- 100% Read or 100% Write
- 4K (Random)
- 100% Read or 100% Write
- 8K 70/30 (Random)
- 70% Read, 30% Write
- File Server (Random)
- 80% Read, 20% Write
- 10% 512b, 5% 1k, 5% 2k, 60% 4k, 2% 8k, 4% 16k, 4% 32k, 10% 64k
- Webserver (Random)
- 100% Read
- 22% 512b, 15% 1k, 8% 2k, 23% 4k, 15% 8k, 2% 16k, 6% 32k, 7% 64k, 1% 128k, 1% 512k
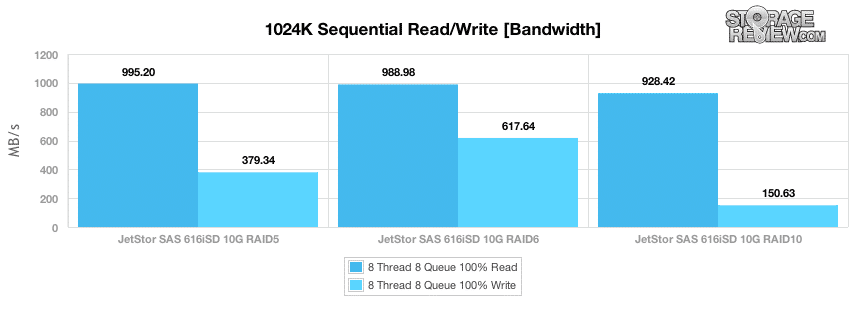
To kick off our benchmarking, we look at large-block sequential performance with a load of 8 threads each having an outstanding queue of 8 I/Os, which is designed to show the saturation rate of the SAN over the network, which in this case is 10GbE over two connections utilizing MPIO, one per controller. In our testing, peak sequential performance was favored by the RAID5 and RAID6 modes over RAID10. Speeds ranged from 995MB/s at the highest with RAID5 down to 928MB/s with RAID10. Write performance was strongest with RAID6, measuring 617MB/s, with RAID5 coming in with 379MB/s and RAID10 measuring just 150MB/s.
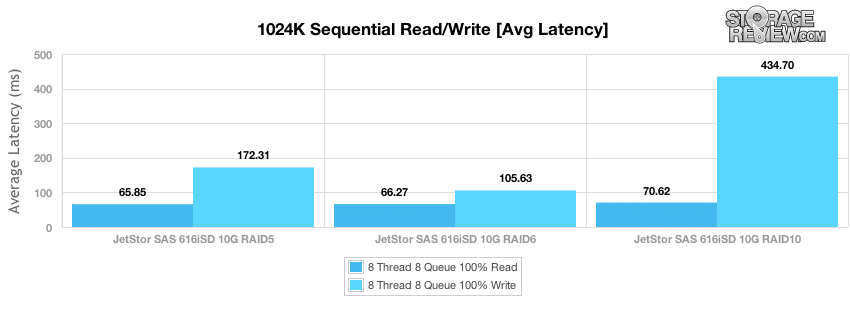
Average latency during our sequential transfer performance measured 65ms for RAID5, 66ms for RAID6, and 70ms for RAID10 in our 1024k read test, and 105ms in RAID6, 172ms in RAID5, and 434ms for RAID10 in our write segment.
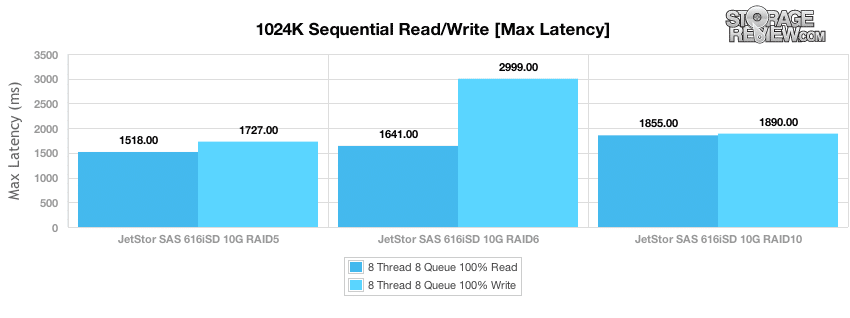
While average latency is an important metric to consider when looking at the overall performance, knowing what the worst case latency might be is equally as valuable. In the case of the JetStor SAS 616iSD, peak read response times were kept to 1,518-1,855ms in read activity, and 1,727-2,999ms in write activity.
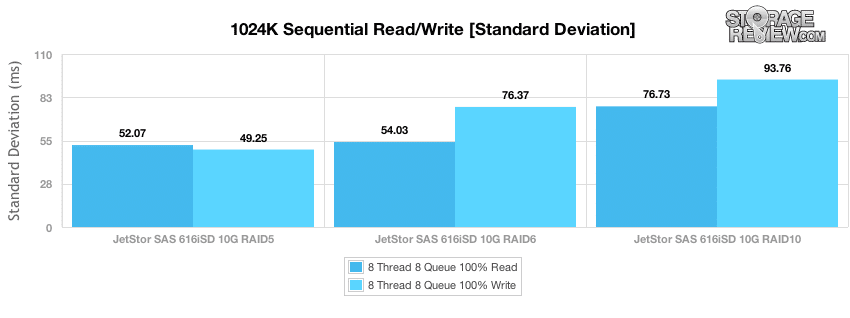
The last metric we look at in our tests is latency standard deviation, to see how closely grouped the latency spread was over the duration of the test. The JetStor in RAID5 offered the most consistent performance in both large-block read and write activity, with RAID6 coming in second, and RAID10 had the widest spread in both of our read and write tests.
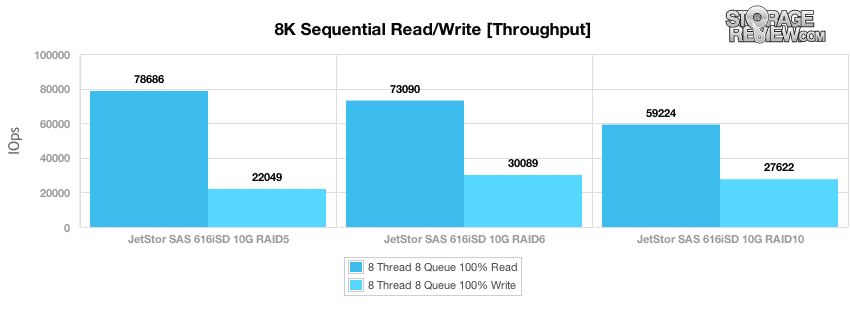
While the 1024k sequential transfer test was designed to measure the post of bandwidth saturation, our next test looks at small-block sequential activity with an 8K transfer to measure I/O throughput in a best case scenario. While most activity a SAN might see in a production environment will be random as more systems access it, nightly backup or background activity during idle time could see close to these speeds. The peak sequential 8K read performance we measured came in at 78,686 IOPS in a RAID5 configuration, dropping down to 73,090 IOPS in RAID6 to 59,224 IOPS in RAID10. Peak 8K sequential write performance was measured in at 30,089 IOPS in RAID6, with RAID10 coming in with 27,622 IOPS, and RAID5 with 22,049 IOPS.
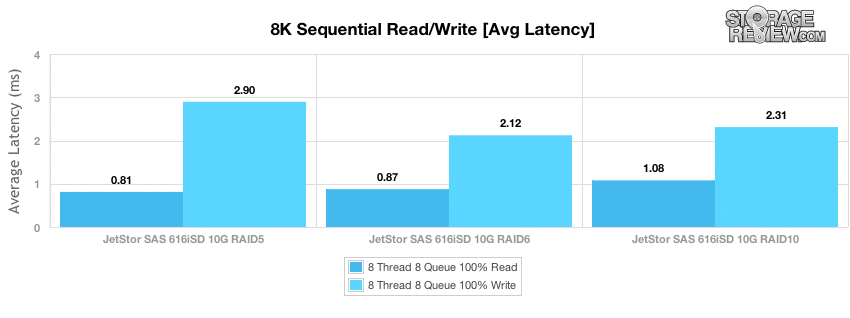
Average small-block sequential latency was low across the board in our 8K transfer test, with the RAID5 read coming in the quickest with a response time of 0.81ms, RAID6 coming in next with 0.87ms, and RAID10 with 1.08ms. Write latencies were slightly higher given their slower I/O transfer results, with RAID6 measuring 2.12ms, RAID10 with 2.31ms, and RAID5 with 2.9ms.
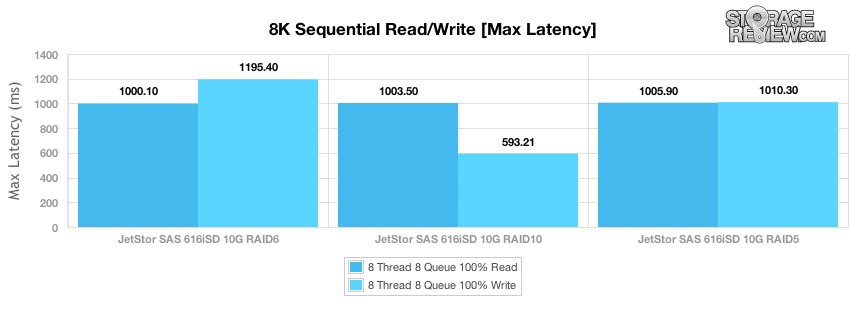
Max read latency in our 8K sequential transfer test measured a peak of about 1,000ms across the board in the read segment of our test, with write peak latency measuring 593ms in RAID10 up to 1,195ms in RAID6.
Looking at the latency standard deviation spread, the RAID6 mode maintained the most consistent sequential read performance, with RAID5 RAID10 being slightly more inconsistent. RAID6 also offered the best 8K sequential standard deviation in write transfers.
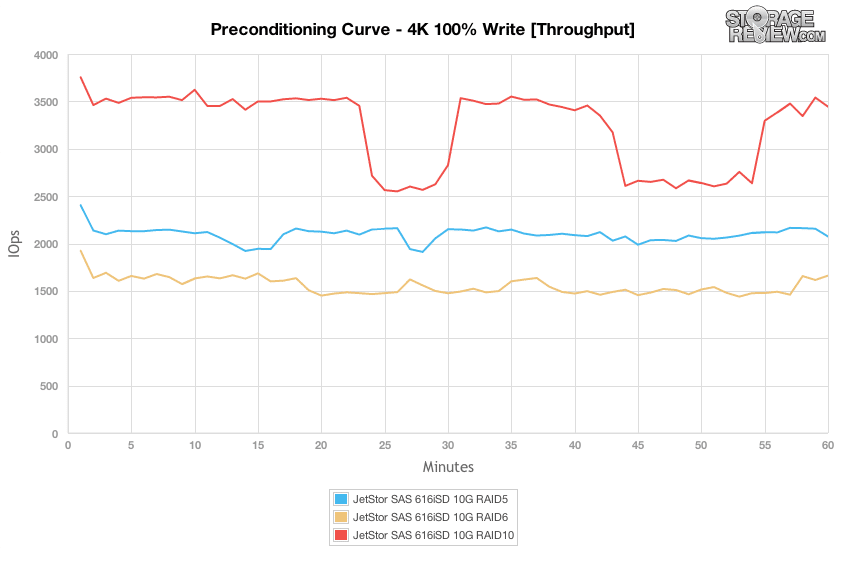
Our next group of tests shifts the focus to random workloads, with the first being 100% 4K write in the preconditioning segment. In terms of how the RAID modes stacked up, RAID10 offered the highest throughput, with RAID5 and RAID6 coming in below it. What was interesting though were the dips in performance from the RAID10 array, most likely caused by background maintenance, which the RAID5 and RAID6 setups didn’t have.
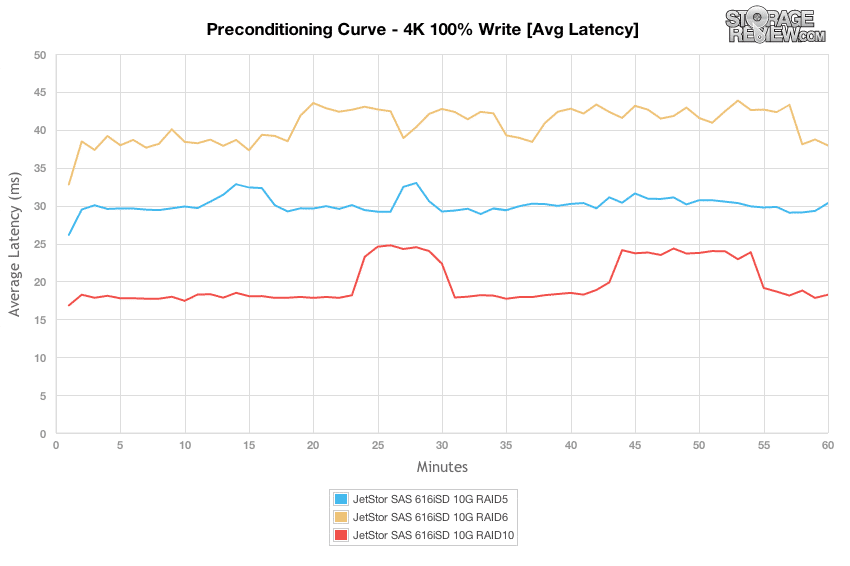
Looking at the average latency during our preconditioning phase, for each RAID mode you can see how the onboard-cache buffered the incoming random activity for 1-2 minutes, before leveling off to the performance of the disks themselves.
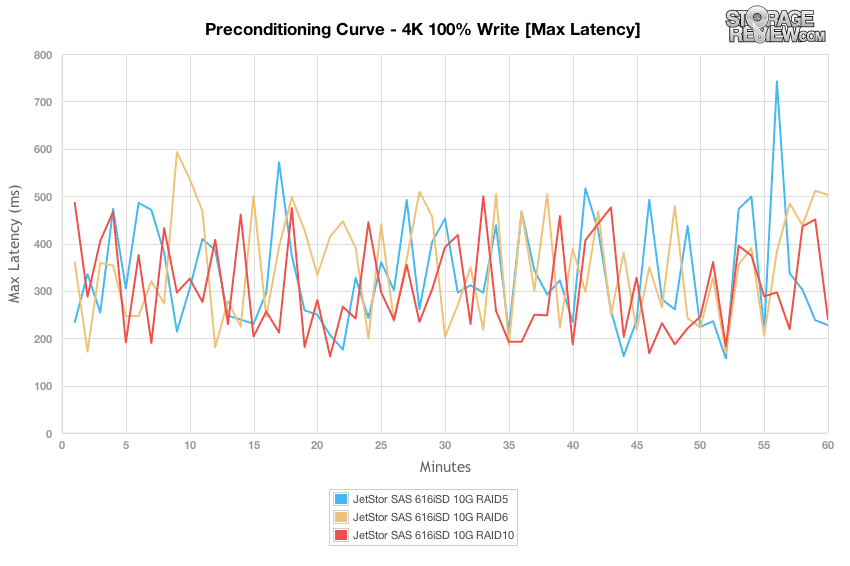
During our load of 8 thread, each with 8 outstanding I/Os, the peak latency floated between 200-500ms for each RAID mode with 100% 4K write activity.
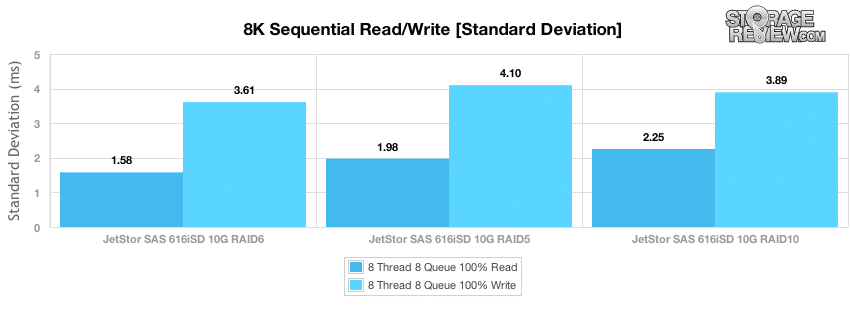
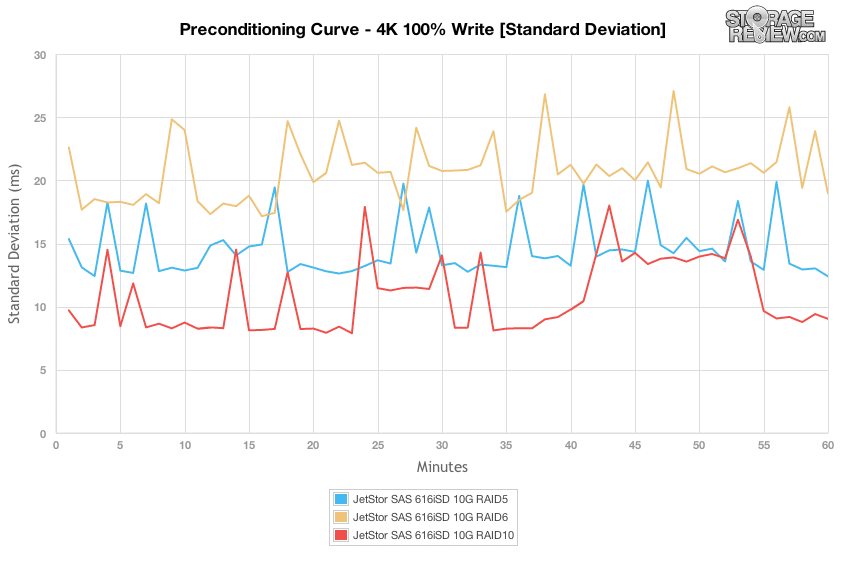
Switching our focus to latency standard deviation, we can see that the response times were most consistent with the RAID10 configuration, followed by RAID5 and RAID6.
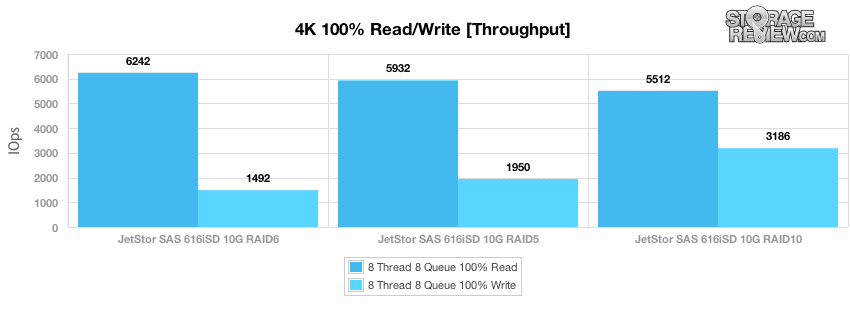
After the preconditioning process finished, we took longer samples of 100% 4K random read and random write performance from each RAID mode. RAID6 offered the fastest read speeds of 6,242 IOPS, although slower write performance measuring 1,492 IOPS. RAID10 offered the best random write performance measuring 3,186 IOPS, but had slower 4K random read speed of 5,512 IOPS.
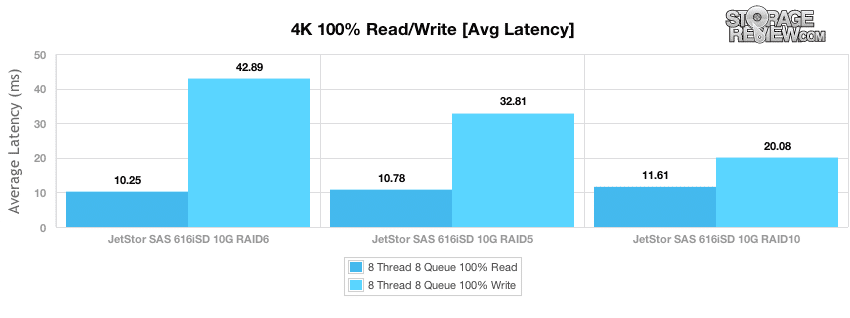
With an outstanding effective queue depth of 64, we measured 4K random read and write latency in each RAID mode. Random 4K read latency ranged from 10.25ms in RAID6 to 11.61ms in RAID10. Write latency scaled from 20.08ms in RAID10 to 42.89ms in RAID6.
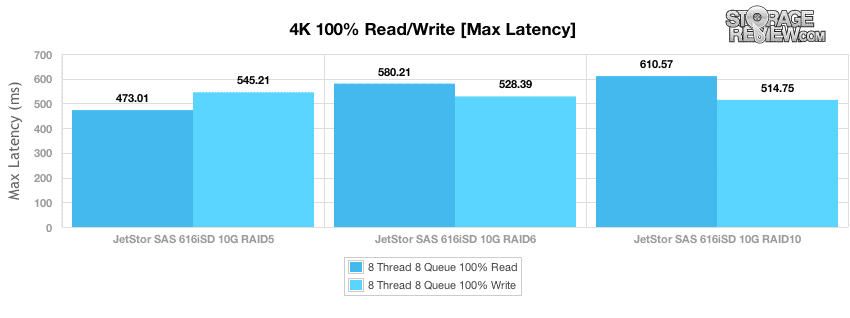
In our longer sampling period outside of the preconditioning phase, we measured peak response times ranging from 473-610ms in read transactions and 514-545ms during write activity.
While peak latency shows the worst response times over the sampling period, standard deviation shows the spread of latency over that entire testing period. RAID5 offered the most consistent random 4K read latency, while RAID10 offered the most consistent 4K write latency.
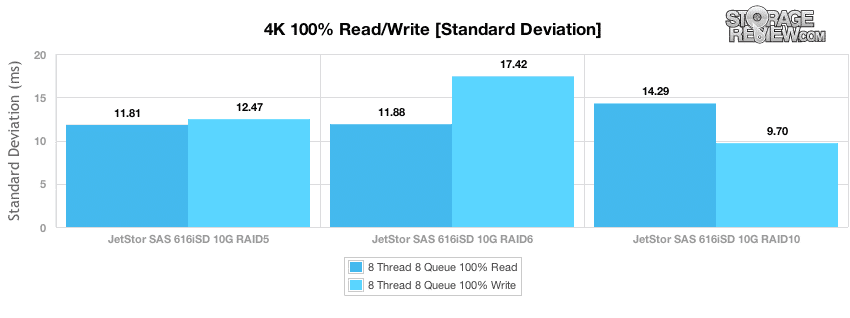
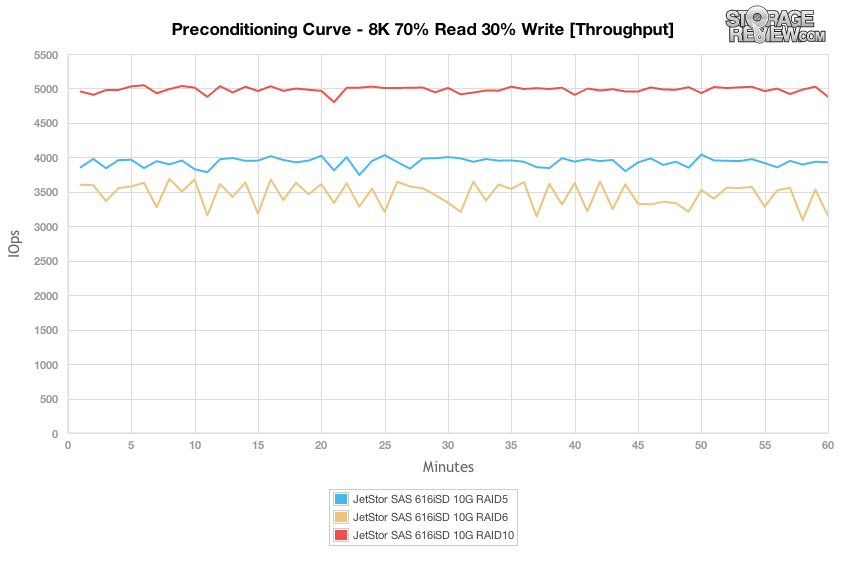
The next preconditioning test works with a more realistic read/write workload spread, versus the 100% write activity in our 1024K, 100% 8K or 100% 4K workloads. Here, we have a 70% read and 30% write mix of 8K random transfers. Looking at our 8K 70/30 mixed workload under a heavy load of 8 threads and 8 queue per thread, we see RAID10 offered the highest throughput, followed by RAID5 and then RAID6. Performance was very consistent over the duration of the preconditioning process, with only minor blips in performance.
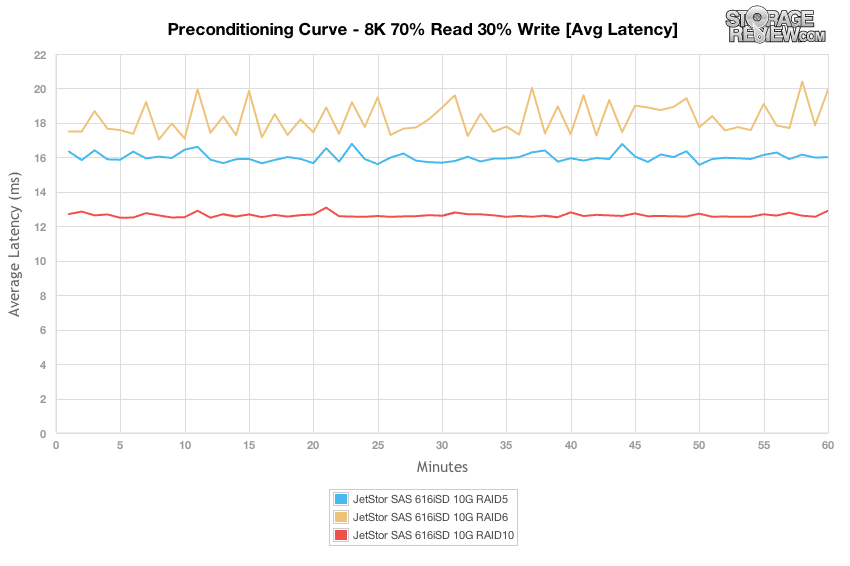
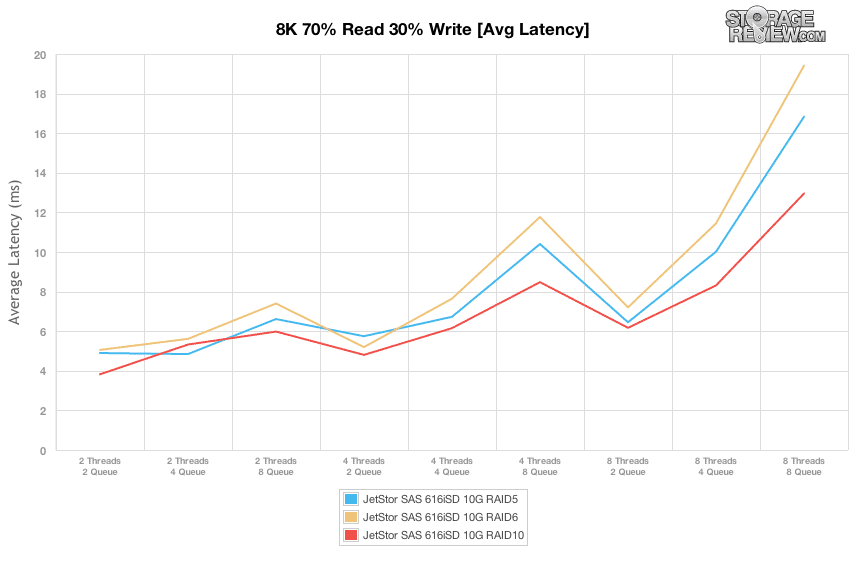
Looking at the spread of average latency during our 8K 70/30 workload, RAID10 was the flattest, measuring 12-13ms over the duration of the test, followed by RAID6 with about 16-17ms, with RAID5 measuring 17-20ms.
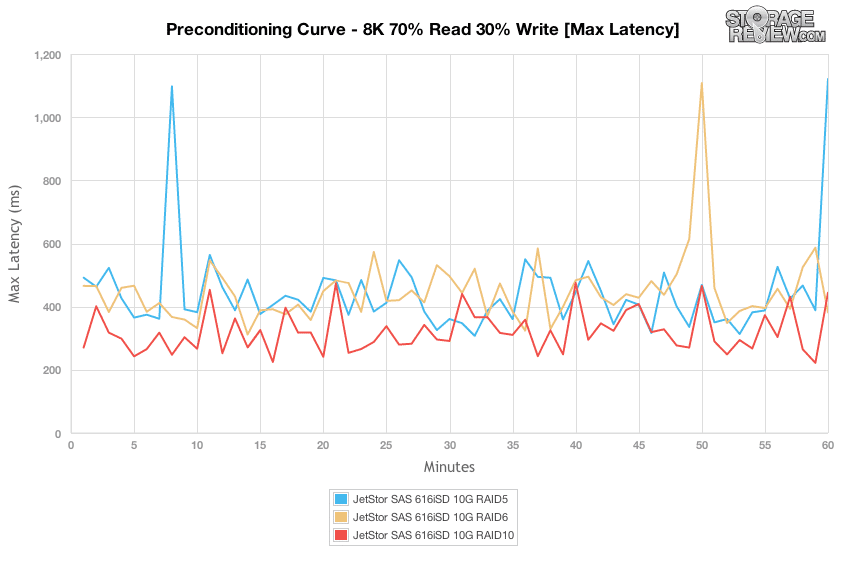
The peak response times for each RAID type were fairly consistent in the band of 300-500ms, with a few blips above 1,000ms from the RAID5 and RAID6 RAID-types.
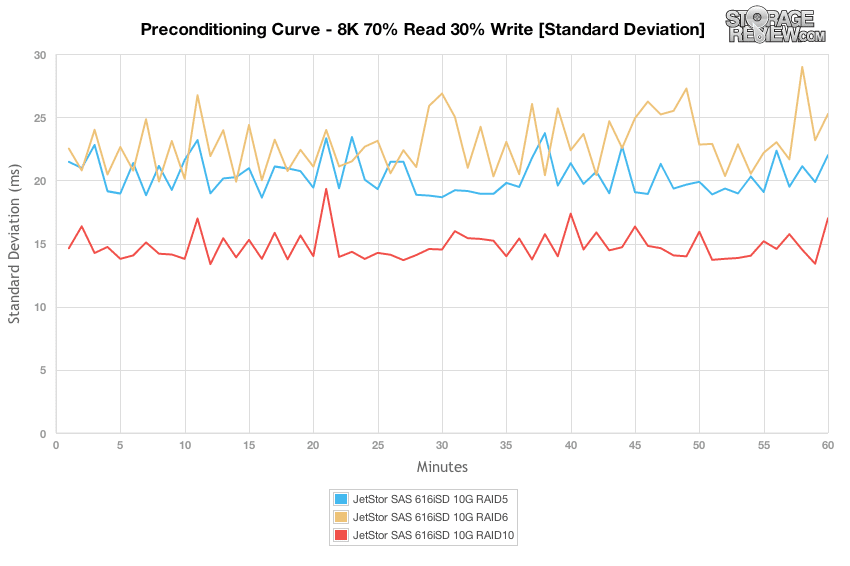
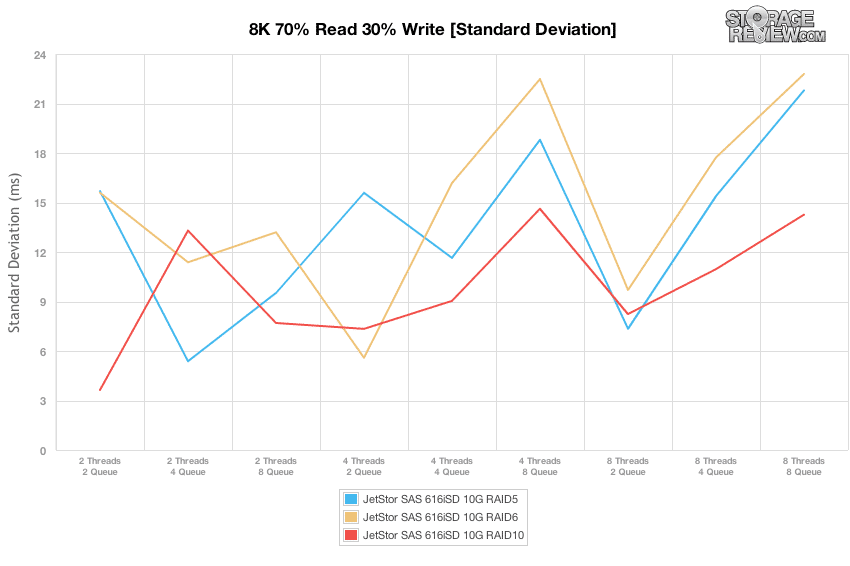
Comparing the latency standard deviation differences between the RAID types, RAID10 offered the most consistent latency, followed by RAID5 and then RAID6.
Compared to the fixed 8 thread, 8 queue max workload we performed in the 100% 4K, 8K, and 1024K tests, our mixed workload profiles scale the performance across a wide range of thread/queue combinations. In these tests we span our workload intensity from 2 threads and 2 queue up to 8 threads and 8 queue. Looking at the differences in throughput, each RAID mode was running roughly in par with one another in areas where effective queue depth stayed 16 and below. Once it went above 32, seen in the 4T/8Q, 8T/4Q and 8T/8Q workloads, the RAID10 mode offered the highest performance, trailed by RAID5, and then by RAID6. Below that range each RAID mode offered similar performance.
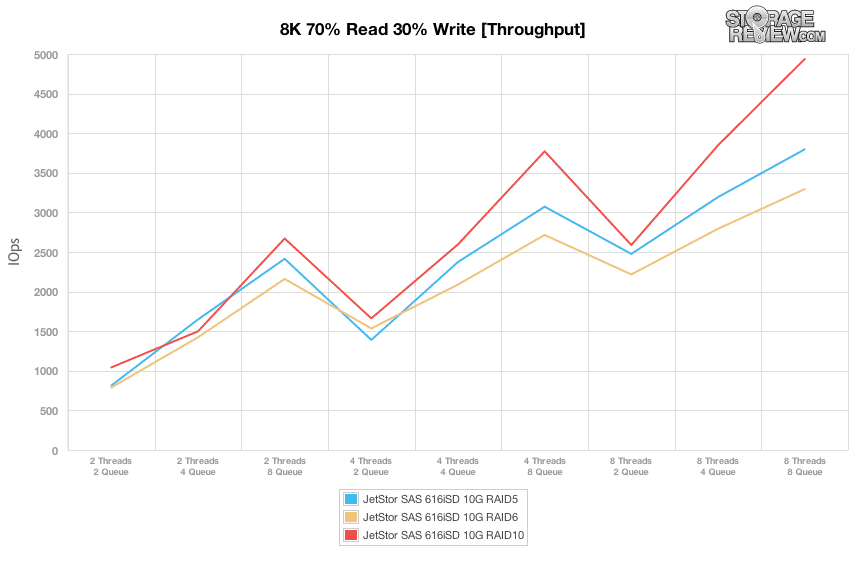
While knowing the peak throughput range is important, knowing how to tune your load to match the storage array is even more important. Fast I/O speeds mixed with high latency just means a sluggish user interaction, so knowing the level of performance you can squeeze out before latency starts to significantly increase is critical for usability. The sweet spot in our tests, which offered the highest throughput, but also kept latency relatively low between 6-8ms was at 8T/2Q, where performance ranged between 2,250 and 2,750 IOPS.
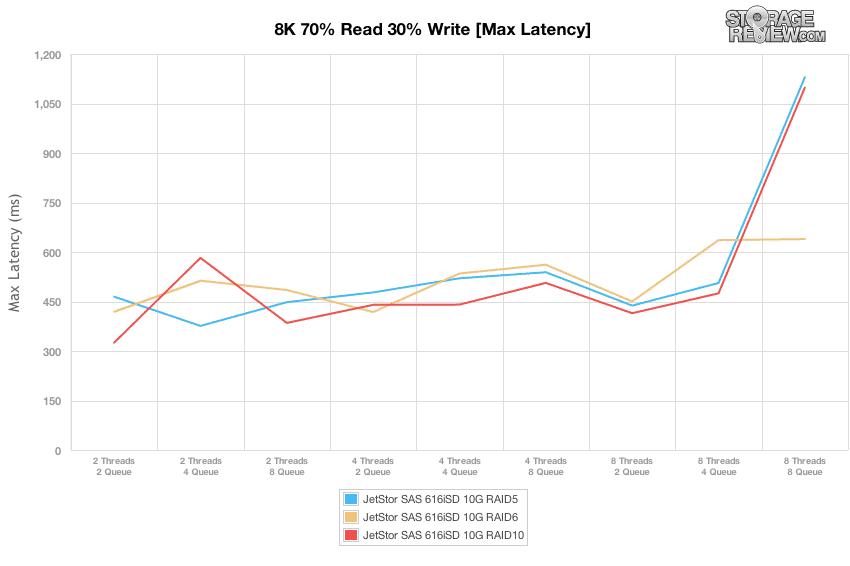
Comparing the effective queue depth to the peak latency from the JetStor SAS 616iSD, the SAN was able to contain the higher response times to below 500ms up until the 8T/8Q workload. At that point peak latency doubled for RAID5 and RAID6.
Comparing latency standard deviation in all three RAID types, RAID10 offered a slight advantage, with RAID6 usually having the largest spread. The sweet spot for most consistent latency though was the 8T/2Q load, which was optimal for all RAID-types.
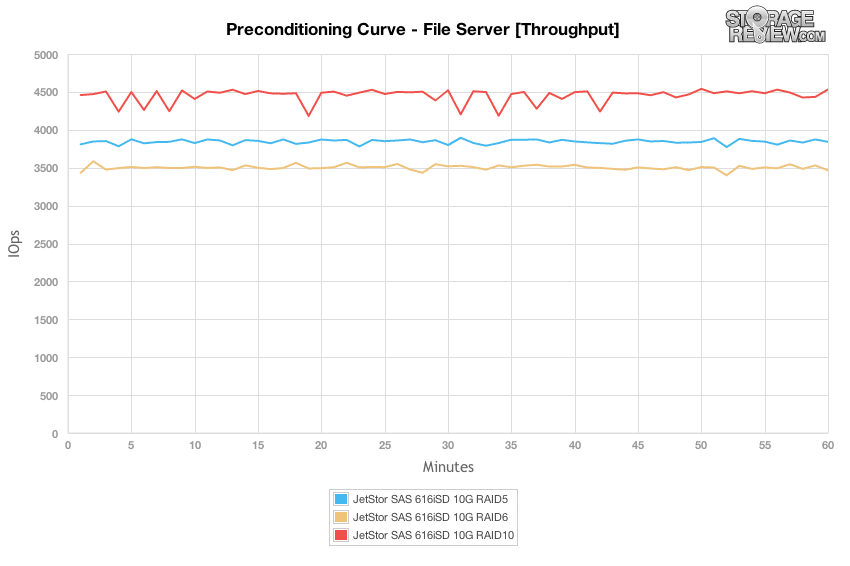
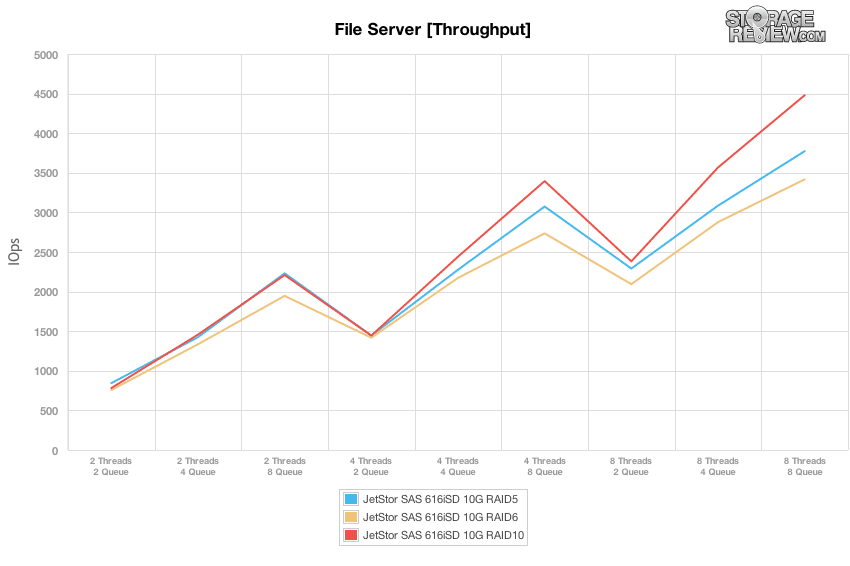
The File Server workload represents a larger transfer-size spectrum hitting each particular array, so instead of settling in for a static 4k or 8k workload, the SAN must cope with requests ranging from 512b to 64K. Similar to the other fully-random workloads, the RAID10 configuration offered the highest throughput, measuring around 4,500 IOPS over the duration of our preconditioning process. RAID5 trailed with a speed of 3,800 IOPS, with RAID6 following with around 3,500 IOPS. Each RAID-type offered similar performance start to finish, with only minor variation.
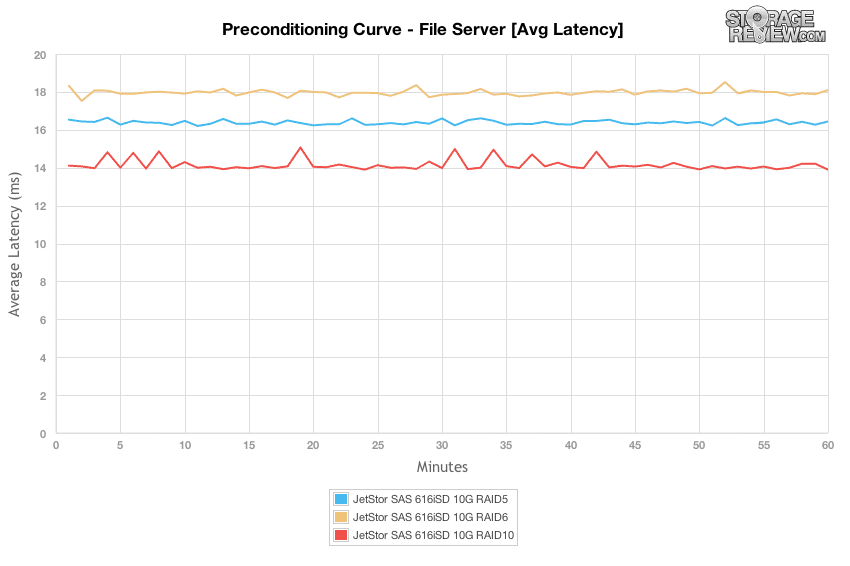
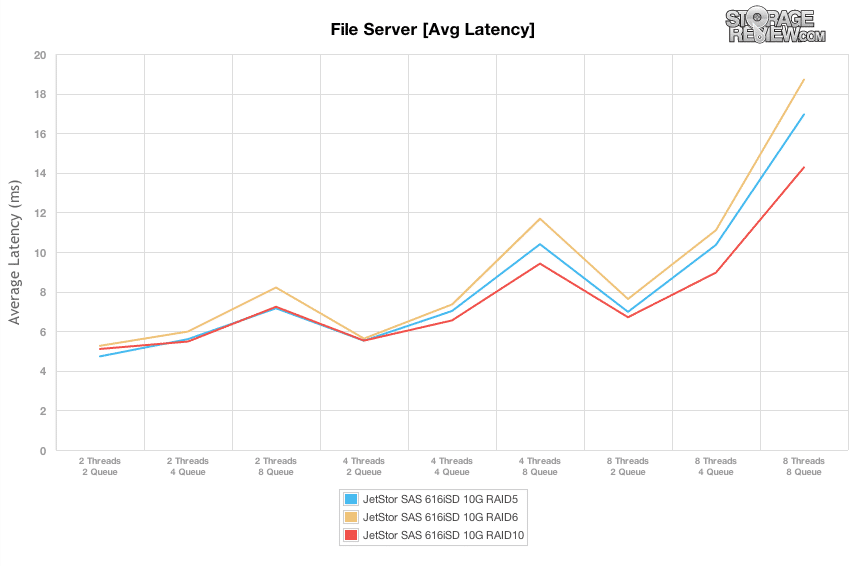
Looking at average latency, each RAID configuration stayed fairly flat over the duration of the preconditioning test, with the RAID10 mode settling in at 14ms, RAID5 at 16.5ms and RAID6 above at 18ms.
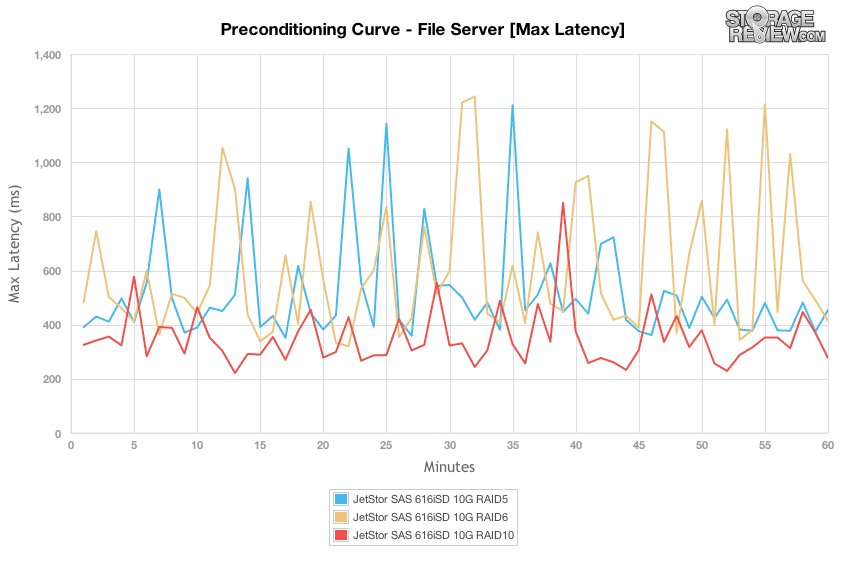
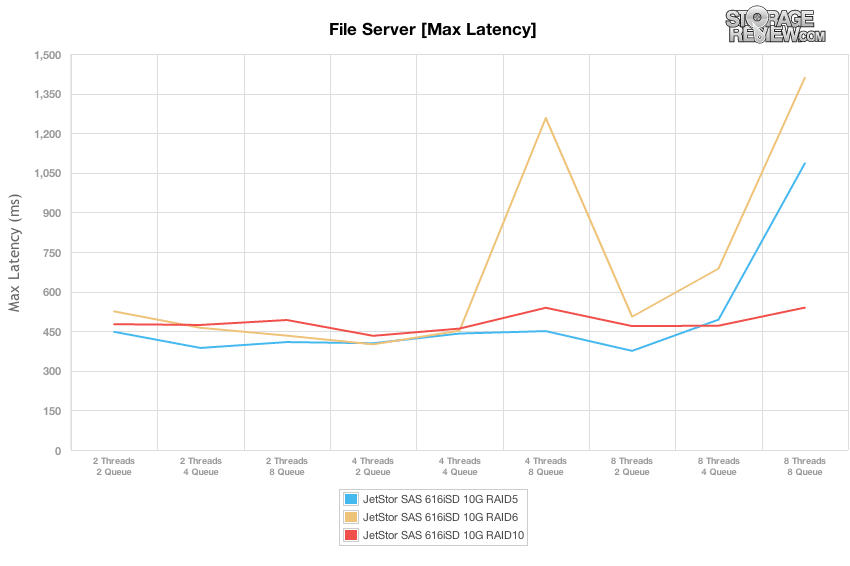
Peak response times were more spread out, ranging from as low as 200ms to as high as 1,200ms during the preconditioning phase. The RAID10 configuration stayed the lowest, with a spread from 250ms to just over 800ms. RAID5 and RAID6 though peaked higher ranging from 300ms to over 1,200ms.
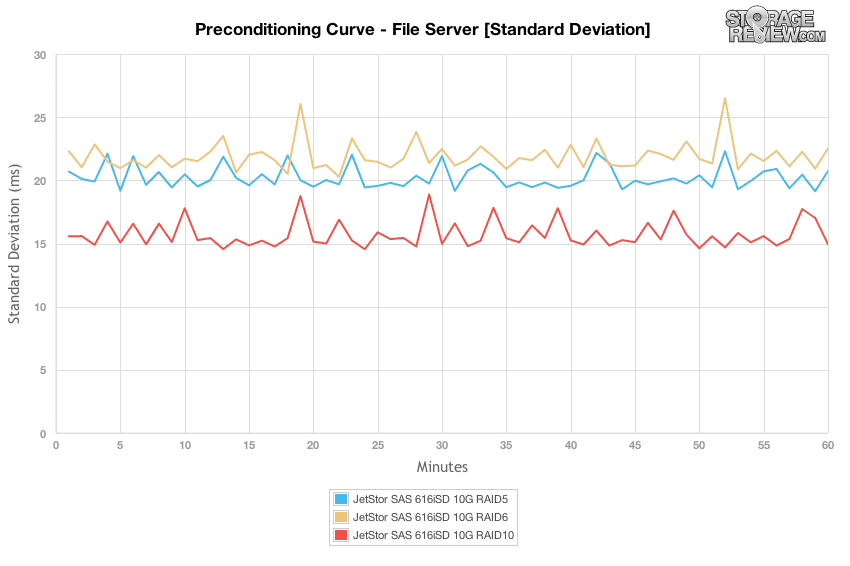
RAID10 offered the most consistent latency standard deviation, trailed by RAID5 and RAID6 which were a step above it.
Switching to our scaled File Server throughput chart where we increase the load from 2T/2Q to 8T/8Q, we noted a similar trend where at or below an effective queue depth of 16, there was very little performance difference between each of the RAID types. Above that level, RAID10 offered the highest performance, followed by RAID5, and then RAID6.
Switching to the view of average latency with our File Server workload, response times floated between 5-8ms while the effective queue depth stayed at or below 16, and then jumped as high as 14-19ms under peak load. The sweet spot, similar to the 8K 70/30 workload, was again at 8T/2Q, where the JetStor SAS 606iSD was able to offer the highest throughput of 2,000-2,500 IOPS with a latency of 7-8ms.
In our File Server test, max latency stayed within 400-500ms for RAID5 and RAID6 up to 8T/4Q and 8T/8Q, before latency substantially increased. Max response times from RAID10 stayed consistent over the entire duration of our tests.
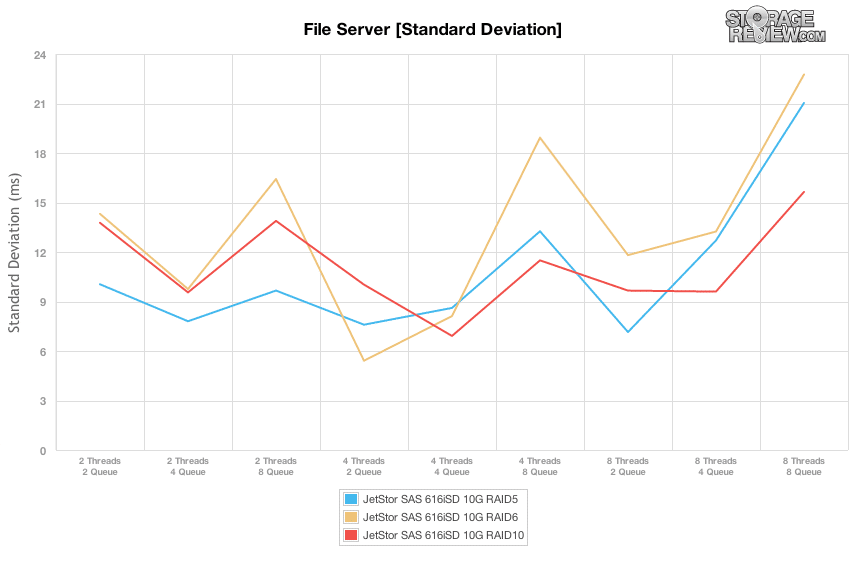
Standard deviation from all RAID-types remained consistently inconsistent over the duration of the varying load test. At higher loads where configurations reached a queue depth of 8, the variation increased across the board.
Our last workload is rather unique in the way we analyze the preconditioning phase of the test compared to the main output. As a workload designed with 100% read activity, it’s difficult to show each device’s true read performance without a proper preconditioning step. To keep the conditioning workload the same as the testing workload, we inverted the pattern to be 100% write. For this reason the preconditioning charts are slower than the final workload numbers.
In a Web Server scenario with a 100% write condition, the RAID10 configuration offered the highest performance, although similar to the behavior we noted in the 4K random test, it slumped throughout sections of the test as it performed background activity. The other RAID profiles didn’t have the same result, although they were also slower overall.
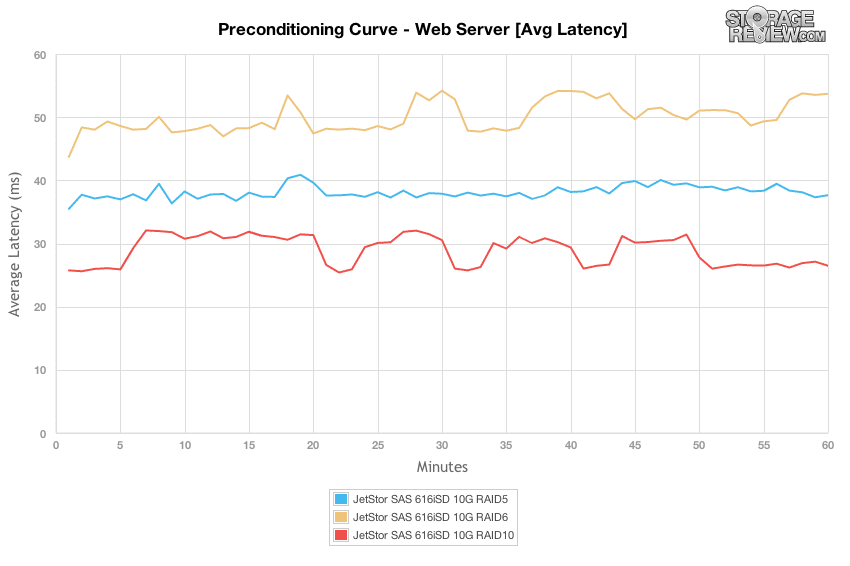
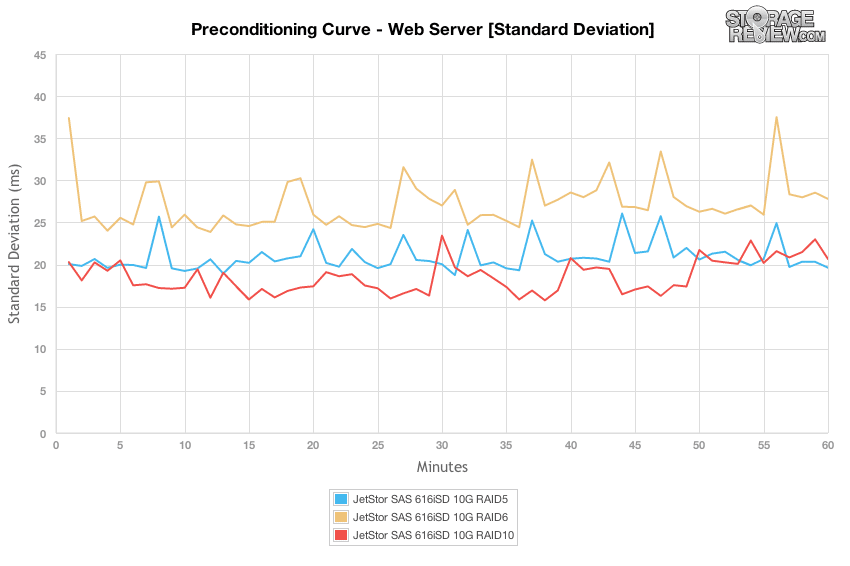
In the Web Server preconditioning process with a load of 8T/8Q, there was a wide spread of performance differences, with RAID10 offering the fastest response times overall measuring 26-32ms, RAID5 measuring about 38-41ms, and RAID6 with 48-54ms.
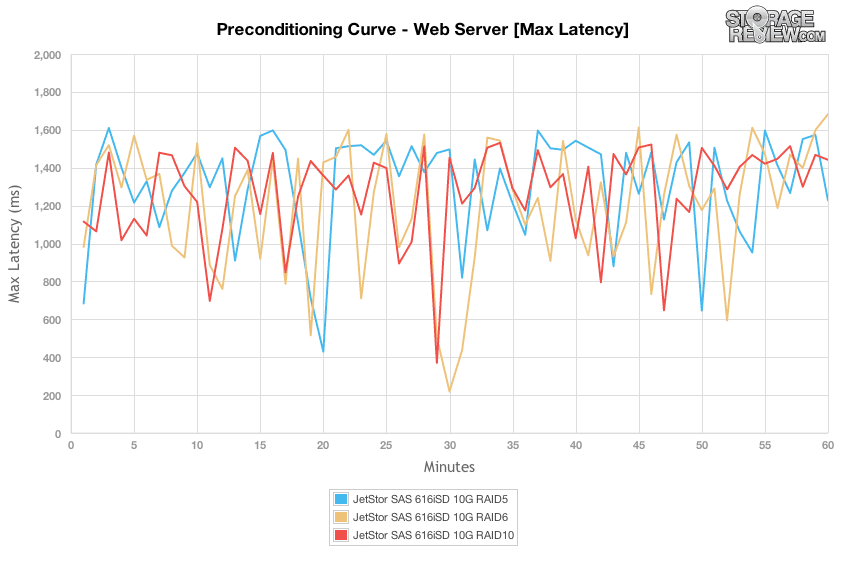
Comparing the differences in max latency in our Web Server preconditioning workload, all RAID types offered a similar range of peak response times measuring 200-1,600ms in total.
When comparing max latency, there might not have been too many differences, but as we change the focus to latency standard deviation, we see that RAID10 offered the tightest spread in latency, followed by RAID5 and then RAID6.
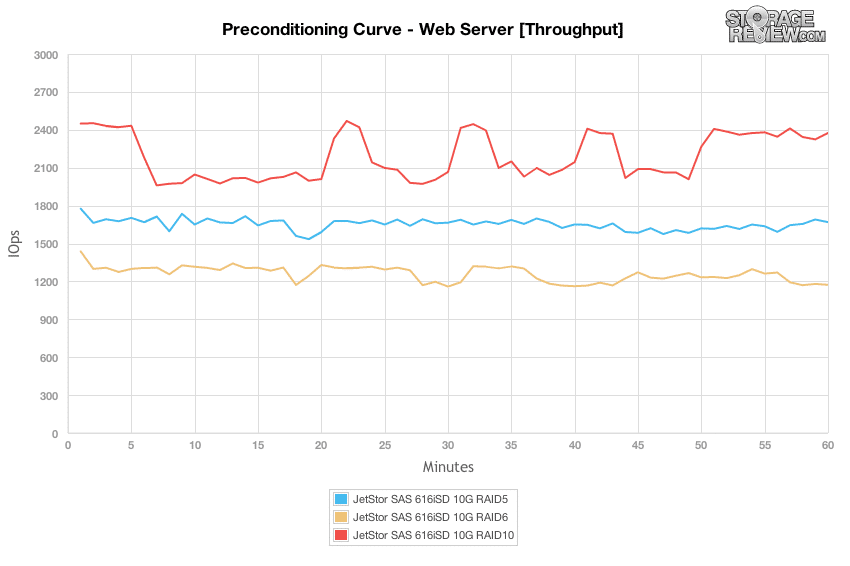
Switching from 100% write activity in our preconditioning phase to 100% read activity, the difference between each RAID type isn’t as noticeable until the higher effective queue depths. At their peaks, the RAID10 mode was able to support 5,100 IOPS, RAID5 with 4,800, and RAID6 with 4,500.
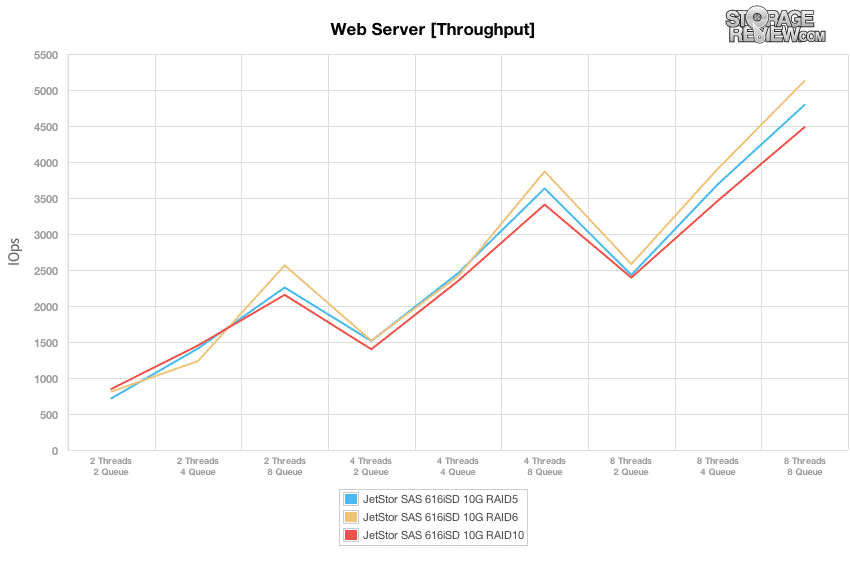
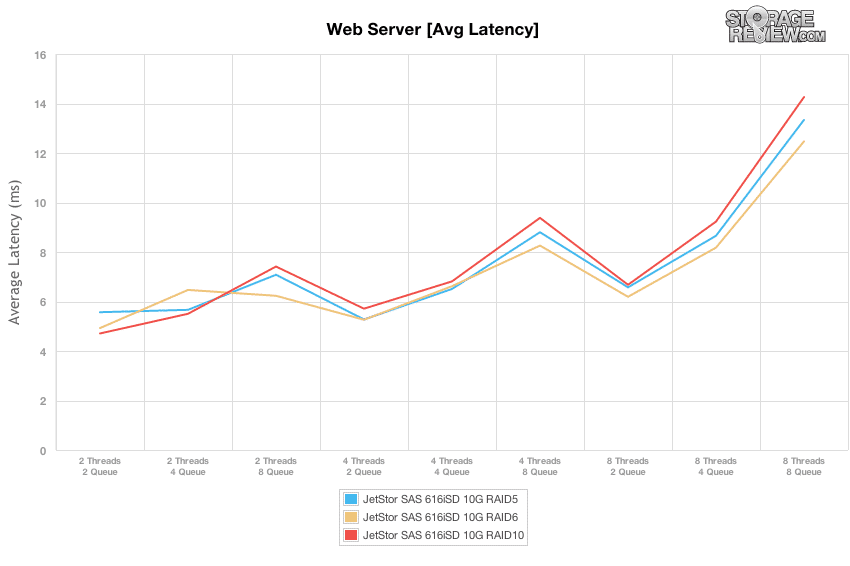
The sweet spot with 100% read activity in our Web Server profile was still the 8T/2Q load, which offered a 6.2-6.6ms response time with a throughput of 2,400-2,600 IOPS before latency spiked to 13-15ms.
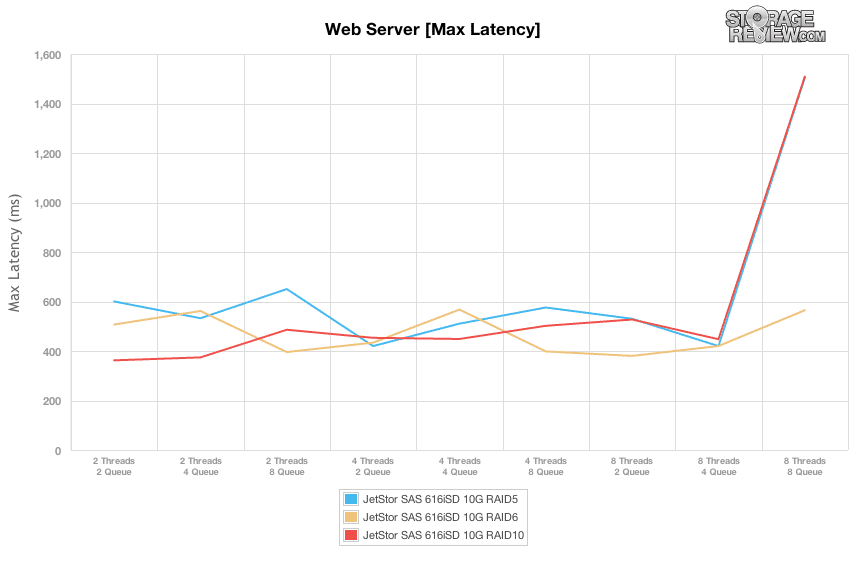
Comparing max latency in our varying load tests, the JetStor SAS 616iSD maintained a range of 400-600ms up until the 8T/8Q workload where RAID5 and RAID10 configurations shot up to 1,500ms.
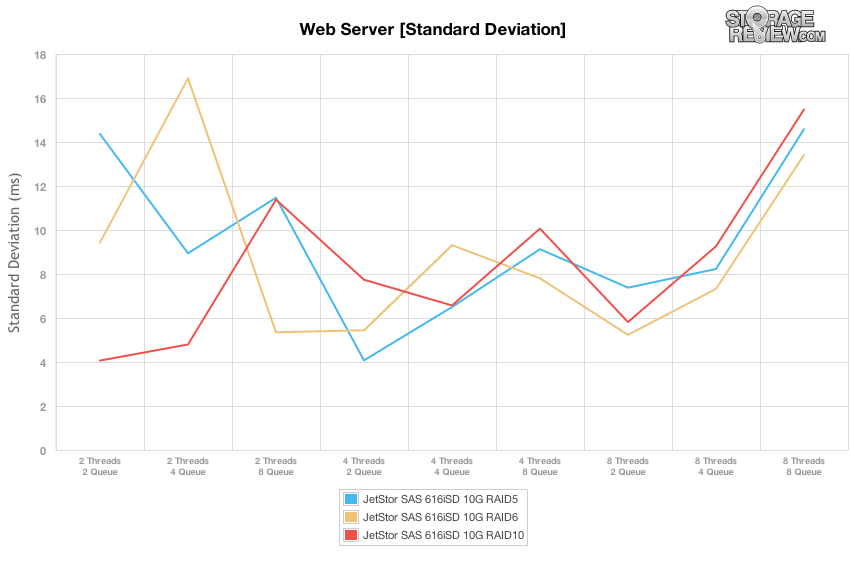
Comparing the differences in latency standard deviation, each RAID-type on the JetStor SAN offered more consistent response times when it was under a moderate load, right up until it was placed under our peak load of 8T/8Q. In the sweet spot range of 8T/2Q, RAID6 offered the most consistent latency, followed by RAID10 and RAID5.
Power Consumption
As with any device located in a modern data center, power consumption and thermal output are always front of mind since they impact the bottom line twice in both power usage of the device itself, and the cooling needed to offset the heat it creates while operating. With most SAN and NAS arrays, the biggest component to the overall power usage is the drives themselves, which if you have fairly constant access means little time to idle and spin down. In our tests we measured power in an off state, the system turned on but controllers powered down, system powered on and idle, as well as system powered on and seeing a constant high I/O load.
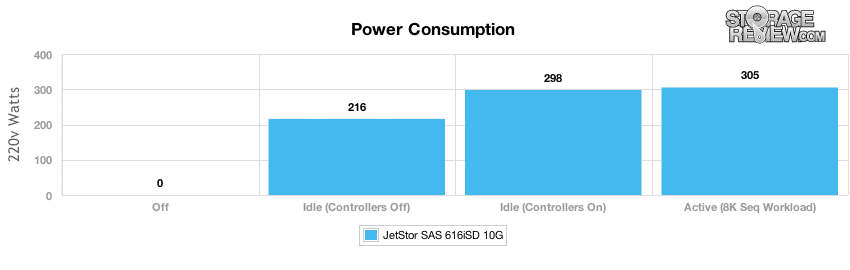
With twelve 600GB 15k SAS hard drives installed, the bulk of the power usage comes from keeping these drives active. With the controllers off, the array needed 216 watts at idle, which increased to 298 watts with the controllers on. Even with an active load, the power usage increased by only another 7 watts to 305w with an 8K sequential workload. With dual 460W power supplies, we found the JetStor SAN to be modestly over-provisioned in terms of its power needs, as it stayed at 66% utilization with 15,000RPM hard drives installed. Even with four bays unused, it still had plenty of overhead left, even if a power supply failed and was removed from the equation.
Conclusion
The Jetstor SAS 616iSD 10G fits into a somewhat amorphous storage array category in that it can used on its own with performance or large capacity drives to fill virtualization or general storage needs for an SMB, or paired with additional shelves to solve large enterprise storage pain. JetStor has designed the 616iSD well, everything inside and out is well thought out and the unit lends itself well to easy field service. Items like a cableless internal design or tool-free component swapouts means that technicians need to do very little work to keep the SAS 616-SD running in a production environment. Setup is also a breeze, it’s pretty much plug and play, well at least within the enterprise meaning of such things.
In terms of performance, we tested the array in common configurations of RAID5, RAID6 and RAID10. Looking at all three is certainly relevant, as our testing saw significant variability in each mode. RAID10 consistently showed the highest performance, trailed by RAID5 and then RAID6 in terms of raw performance and lowest latency. As a business considered deploying this or any other array, understanding the sweet spot for performance is especially crucial to the success of the storage deployment. In this case we saw the best performance target at 8 threads, 2 queue where the JetStor SAS 606iSD was able to offer the high throughput as well as low latency across most workloads and all RAID types. Performance could continue to scale beyond that point, although latency would increase substantially. On the power side of things, we found our 12-drive 15k SAS configuration to consume 305 watts under load, which is well under 460 watts each power supply is designed to handle. That gives the system plenty of overhead space, even if it has to run off of a single PSU in the event of a component failure.
Where JetStor runs into a little trouble is as they try to move more up-market into larger customers. In those cases the management layer becomes very important and that’s something JetStor just doesn’t have in much depth. When comparing to the likes of EMC or NetApp, where you can manage wide-scale compute and storage platforms through a single management window, the JetStor SAN needs to be configured on its own. It’s not exactly a problem when working with a few systems, it’s more an issue of understanding what segment of the market this box plays. To JetStor’s credit, they’re not trying to displace large enterprise storage arrays with the SAS 616iSD; they’re pointed solidly at the mid-market where this design makes a lot of sense.
Pros
- Nice enclosure/component design
- Very robust design that is easy to service
- Offers strong, consistent performance in a wide range of workloads
Cons
- Lacks large-scale enterprise data management software
Bottom Line
JetStor isn’t exactly a household name when it comes to storage, though perhaps it should be with nearly 20 years in the business and a robust set of offerings. Specific to this review, the JetStor SAS 616iSD 10G does all that it’s asked to and has enough flexibility to be configured with 10GbE and 15K hard drives for performance needs, or high capacity 3.5″ hard drives for bulk storage. The array is simple to deploy and is well engineered, lending itself well to application and virtualization storage for SMBs and branch/remote office use.


 Amazon