

The Fusion-io ioDrive2 MLC application accelerator comes in capacities up to 1.2TB in a half-height half-length (HHHL) form factor (or 3TB in FHHL) and is highlighted by exceedingly low read and write access latencies. While we've previously reviewed the ioDrive2 flagship Duo SLC, which is great for the most demanding applications, the ioDrive2 single drive with MLC is designed for more "pedestrian" workloads. Pedestrian in ioMemory language though means applications like databases that can accept read latencies of 68µs, compared to the 47µs latency found in the higher-end SLC ioDrive2. Of course offering the drive with MLC NAND brings with it benefits like reduced cost, and the MLC iteration also comes in higher capacities. The ioDrive2 single MLC comes in at a maximum 1.2TB capacity in HHHL or 3TB in FHHL, while the SLC Duo tops out at 600GB and 1.2TB respectively (though the Duo featured with MLC maxes at 1.2TB HHHL and 2.4TB FHHL capacities).
We'll highlight some key points revolving around design and build, but since we've spent quite a bit of time discussing that in the SLC Duo review, we'll skip past much of that in this review, favoring instead to focus on performance. Fusion-io uses an FPGA as the NAND controller, which is important because it gives them more programmatic control and allows for a greater degree of continued customization for the on-drive logic over the life of the drive. Alternatively, with an ASIC firmware can be updated, but the core logic of the silicon cannot be. The drive also features Adaptive FlashBack technology which allows the drive to suffer from NAND failures without risking any data loss or down time while the drive remaps. Lastly, Fusion-io has enhanced their VSL software to provide improved small block performance, and it provides the most robust drive management software on the market with ioSphere.
Fusion-io ships the ioDrive2 single card with MLC NAND in 365GB, 785GB and 1.2TB capacities in a HHHL form factor and 3TB on a FHHL PCB. All drives come with a five year warranty (or max endurance used). Our review model is the 1.2TB capacity, HHHL form factor model.
Fusion-io ioDrive2 Specifications
- Performance
- Read Bandwidth (1 MB): 1.5 GB/s (3TB, 1.2TB, 785GB); 910MB/s (365GB)
- Write Bandwidth (1 MB): 1.3 GB/s (3TB, 1.2TB); 1.1GB/s (785GB); 590MB/s (365GB)
- Ran. Read IOPS (512B): 143,000 (3TB); 275,000 (1.2TB); 270,000 (785GB); 137,000 (365GB)
- Ran. Write IOPS (512B): 535,000 (3TB, 365GB); 800,000 (1.2TB, 765GB)
- Ran. Read IOPS (4K): 136,000 (3TB); 245,000 (1.2TB); 215,000 (785GB); 110,000 (365GB)
- Ran. Write IOPS (4K): 242,000 (3TB), 250,000 (1.2TB), 230,000 (785GB); 140,000 (365GB)
- Read Access Latency: 68µs (All)
- Write Access Latency: 15µs (All)
- 2xnm MLC NAND Flash Memory
- Bus Interface: PCI-Express 2.0 x4
- Weight: 9 ounces for FHHL, 6.6 ounces for HHHL
- Form Factor: Half-height, half-length (HHHL)
- Warranty: 5 years or maximum endurance used
- Endurance: 16.26PB
- Supported Operating Systems
- Microsoft Windows: 64-bit Windows Server 2012, Windows Server 2008 R2, Windows Server 2008, Windows Server 2003
- Linux: RHEL 5/6; SLES 10/11; OEL 5/6; CentOS 5/6; Debian Squeeze; Fedora 16/17; openSUSE 12; Ubuntu 10/11/12
- UNIX: Solaris 10/11 x64; OpenSolaris 2009.06 x64; OSX 10.6/10.7/10.8
- Hypervisors: VMware ESX 4.0/4.1/ESXi 4.1/5.0/5.1, Windows 2008 R2 with Hyper-V, Hyper-V Server 2008 R2
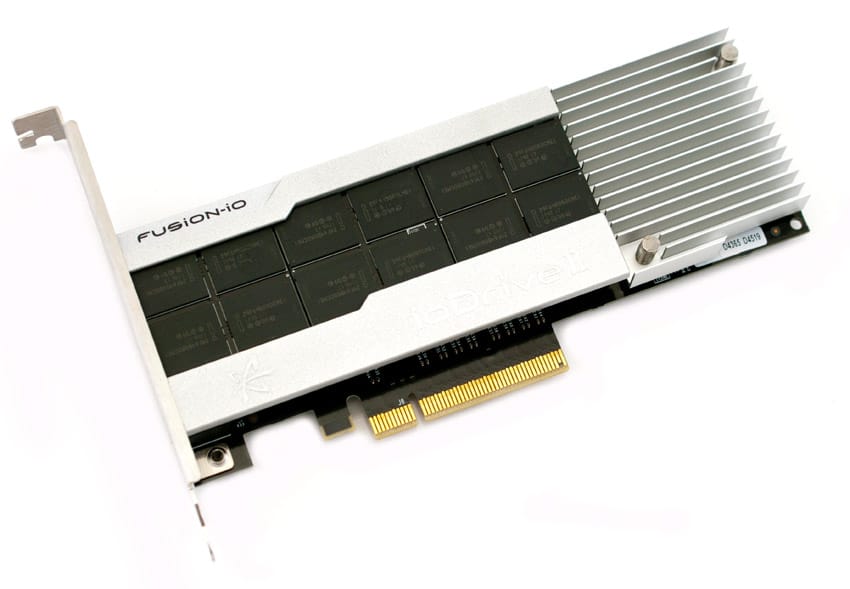
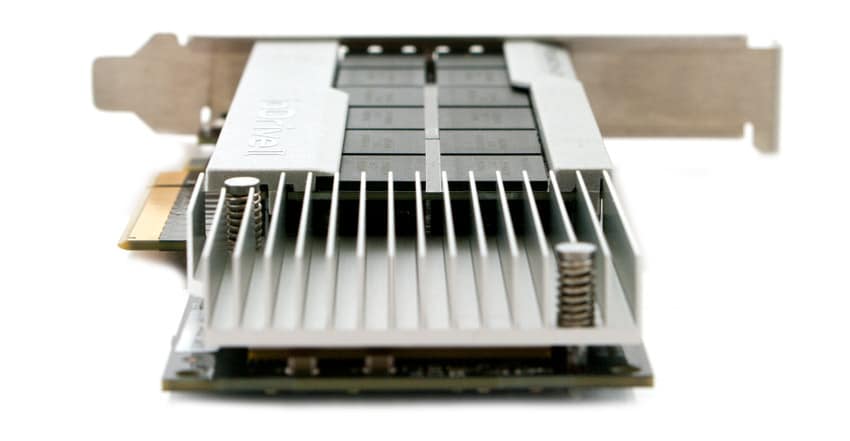
Design and Build
The Fusion-io ioDrive2 1.2TB MLC is a Half-Height Half-Length (HHHL) x4 PCIe 2.0 card that is similar in design to the ioDrive2 Duo SLC that we reviewed, though cut in half. (For more information about design, check out the Duo review.) Dissimilar to the Duo, in this iteration the NAND is attached through a single pool of NAND utilizing one controller. The controller is the same is the Duo's – a 40nm Xilinx Virtex-6 FPGA.
Our ioDrive2 is 1.2TB and operates on 4 lanes across PCIe connection. The ioDrive2 utilizes MLC NAND, which is split up between 24 64GB NAND packages. At that figure, the over-provisioning level is 22% with stock formatting. As with the ioDrive2 Duo, the NAND is manufacturer agnostic, with our specific tester model utilizing Intel MLC NAND.
Testing Background and Comparables
The Fusion-io ioDrive2 MLC uses a 40nm Xilinx Virtex-6 FPGA controller and Intel MLC NAND with a PCIe 2.0 x4 interface.
Comparables for this review:
- Intel SSD 910 (800GB, 4 x Intel EW29AA31AA1 controllers, eMLC NAND, PCIe 2.0 x8)
- LSI Nytro WarpDrive BLP4-400 (400GB, SandForce SF-2500 controller, Toshiba eMLC NAND, PCIe 2.0 x8)
All SAS/SATA enterprise SSDs are benchmarked on our second-generation enterprise testing platform based on a Lenovo ThinkServer RD630. This new Linux-based testing platform includes the latest interconnect hardware such as the LSI 9207-8i HBA as well as I/O scheduling optimizations geared towards best-case flash performance. For synthetic benchmarks, we utilize FIO version 2.0.10 for Linux and version 2.0.12.2 for Windows. Since the Fusion-io ioDrive2 leverages host-side resources, faster server clock speeds allow it to yield higher performance. In our synthetic testing environment, we use a mainstream server configuration with a clock speed of 2.0GHz, although server configurations with more powerful processors could yield even greater performance.
- 2 x Intel Xeon E5-2620 (2.0GHz, 15MB Cache, 6-cores)
- Intel C602 Chipset
- Memory – 16GB (2 x 8GB) 1333Mhz DDR3 Registered RDIMMs
- Windows Server 2008 R2 SP1 64-bit, Windows Server 2012 Standard, CentOS 6.3 64-Bit
- 100GB Micron RealSSD P400e Boot SSD
- LSI 9211-4i SAS/SATA 6.0Gb/s HBA (For boot SSDs)
- LSI 9207-8i SAS/SATA 6.0Gb/s HBA (For benchmarking SSDs or HDDs)
Application Performance Analysis
In the enterprise market there is a huge difference between how products claim to perform on paper and how they perform in a production environment. We understand the importance of evaluating storage as a component of larger systems, most importantly how responsive storage is when interacting with key enterprise applications. To this end, we've rolled out our first application tests including our proprietary MarkLogic NoSQL Database Storage Benchmark and MySQL performance via SysBench.
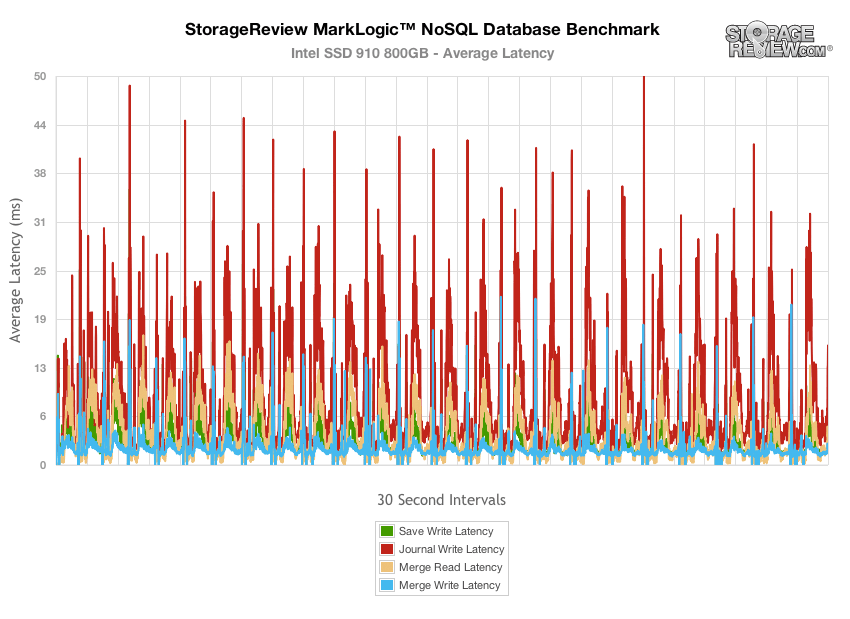
In our MarkLogic NoSQL Database environment, we test groups of four SATA or SAS SSDs with a usable capacity greater than or equal to 200GB. Our NoSQL database requires roughly 650GB of free space to work with, evenly divided between four database nodes. In our testing environment, we use an SCST host and present each individual SSD in JBOD, with one allocated per database node. The test repeats itself over 24 intervals, requiring between 30-36 hours total for the SSDs in this category. Measuring the internal latencies seen by the MarkLogic software, we record both total average latency, as well as interval latency for each SSD.
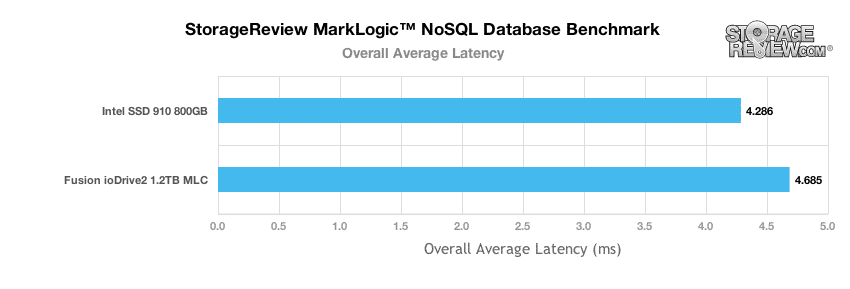
For our overall average latency ranking in our MarkLogic NoSQL database benchmark, the Fusion-io ioDrive2 MLC lagged slightly behind the Intel SSD 910 with a response time of 4.685ms compared to 4.286ms.
The Fusion-io ioDrive2 MLC offered similar latency to the Intel SSD 910 ranging in the 6-50ms range. However, the ioDrive2 maintained lower journal write latency for the majority of the test.
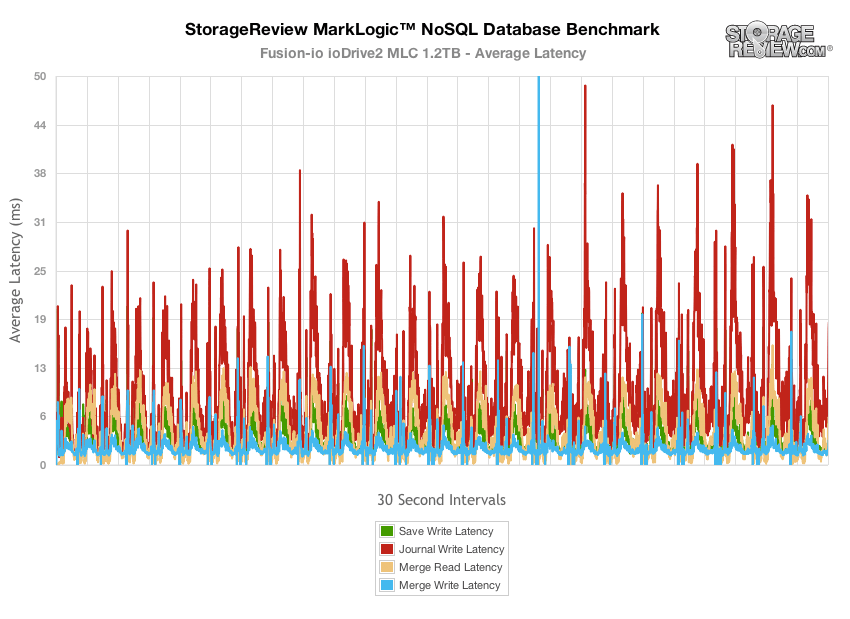
The Intel SSD 910 posted similar figures to the Fusion-io ioDrive2 with peak latency ranging from 6-50ms. Though its save write and merge read and write figures were comparable, its journal write marks were higher for the bulk of the test. Overall the Intel SSD 910 was able to slightly edge out the Fusion-io ioDrive2 MLC in our NoSQL test.
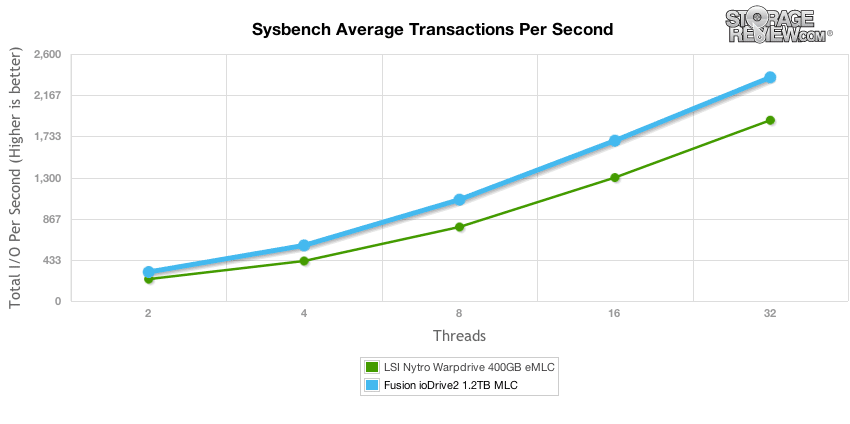
Our next application test consists of Percona MySQL database test via SysBench, which measures the performance of OLTP activity. In this testing configuration, we use a group of Lenovo ThinkServer RD630s and load a database environment onto a single SATA, SAS or PCIe drive. This test measures average TPS (Transactions Per Second), average latency, as well as average 99th percentile latency over a range of 2 to 32 threads. Percona and MariaDB are using the Fusion-io flash-aware application APIs in the most recent releases of their databases, although for the purposes of this comparison we test each device in their "legacy" block-storage modes.
In our SysBench tests, the Fusion-io ioDrive2 1.2TB came in ahead of the LSI Nytro WarpDrive 400GB, with the ioDrive2's average TPS scaling from around 305 TPS at 2 threads to 2,354 TPS at 32 threads.
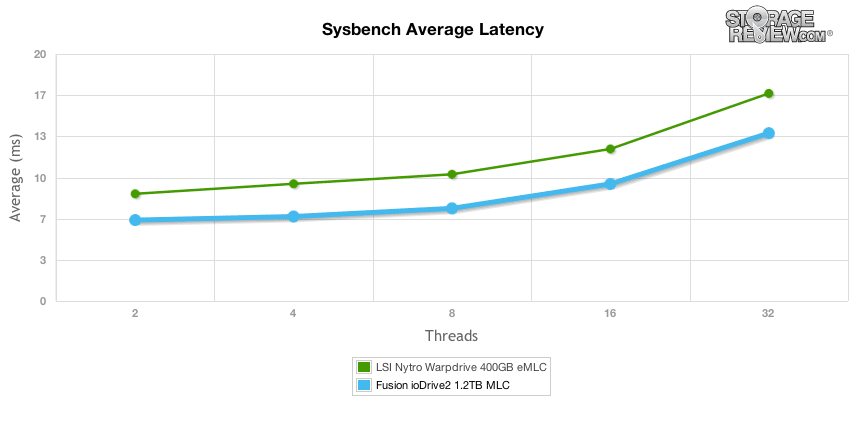
Average latency from the Fusion-io ioDrive2 1.2TB in SysBench scaled from 6.55ms at 2 threads to 13.59ms at 32 threads.
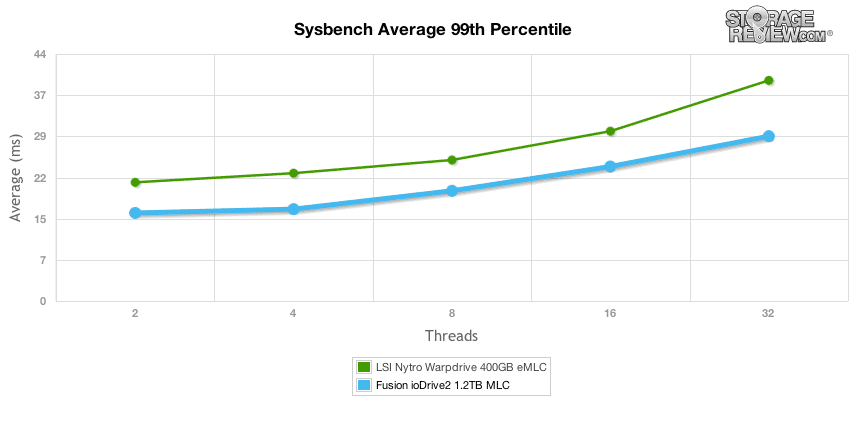
Comparing 99th percentile latency in our SysBench test, the Fusion-io ioDrive2 1.2TB again beat out the LSI Nytro WarpDrive with better latency throughout the test, staying just under 30ms at 29.35ms compared to 39.30 from the WarpDrive.
Enterprise Synthetic Workload Analysis
Flash performance varies throughout the preconditioning phase of each storage device. Our synthetic enterprise storage benchmark process begins with an analysis of the way the drive performs during a thorough preconditioning phase. Each of the comparable drives are secure erased using the vendor's tools, preconditioned into steady-state with the same workload the device will be tested with under a heavy load of 16 threads with an outstanding queue of 16 per thread, and then tested in set intervals in multiple thread/queue depth profiles to show performance under light and heavy usage.
Preconditioning and Primary Steady-State Tests:
- Throughput (Read+Write IOPS Aggregate)
- Average Latency (Read+Write Latency Averaged Together)
- Max Latency (Peak Read or Write Latency)
- Latency Standard Deviation (Read+Write Standard Deviation Averaged Together)
Our Enterprise Synthetic Workload Analysis includes two profiles based on real-world tasks. These profiles have been developed to make it easier to compare to our past benchmarks as well as widely-published values such as max 4k read and write speed and 8k 70/30, which is commonly used for enterprise hardware.
- 4k
- 100% Read or 100% Write
- 100% 4k
- 8k 70/30
- 70% Read, 30% Write
- 100% 8k
In this testing, we compared all three drives, the LSI Nytro WarpDrive, Intel SSD 910 and Fusion-io ioDrive2 over both Linux and Windows. Additionally, with the ioDrive2, we utilized its overprovisioning capability for a high performance (HP) testing mode.
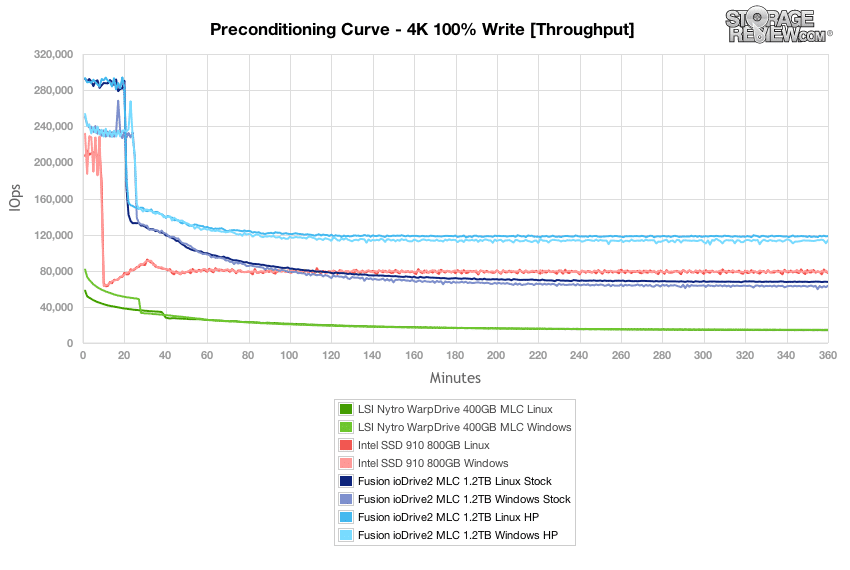
Our first test measures 100% 4k random write performance with a load of 16T/16Q. In this setting, the bursting nature of the Fusion-io ioDrive2 MLC HP tested at 253,000 for Windows and 293,000 for Linux which then leveled off near steady-state to a class-best 113,000 IOPS/118,000 IOPS, respectively. Bursting HP figures were similar to bursting stock figures. In steady-state, the Intel SSD 910 did edge out the stock ioDrive2 Windows and Linux.
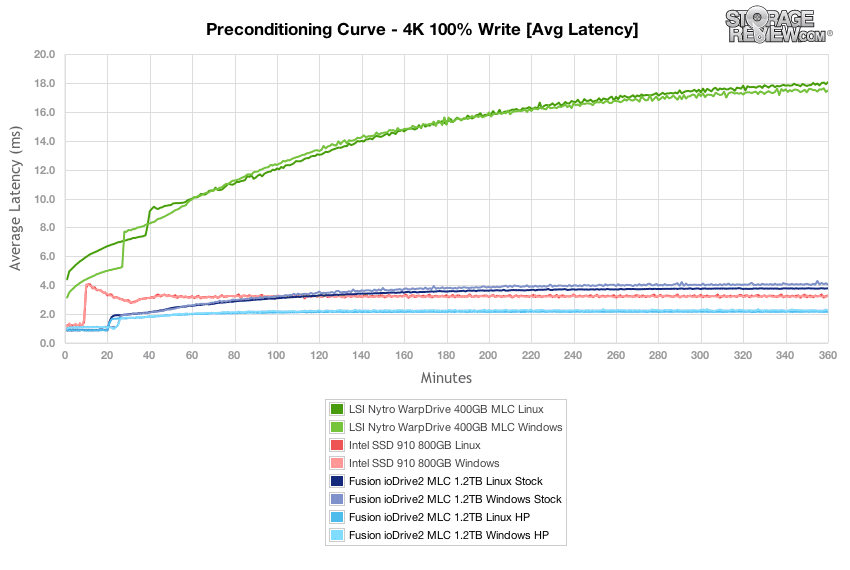
With a heavy 16T/16Q load, the Fusion-io ioDrive2 HP measured 0.87-1ms in burst and scaled up to right around 2.16-2.24ms as it neared steady-state. Stock numbers were similar in burst, but higher in steady-state, getting edged out again by the Intel SSD 910.
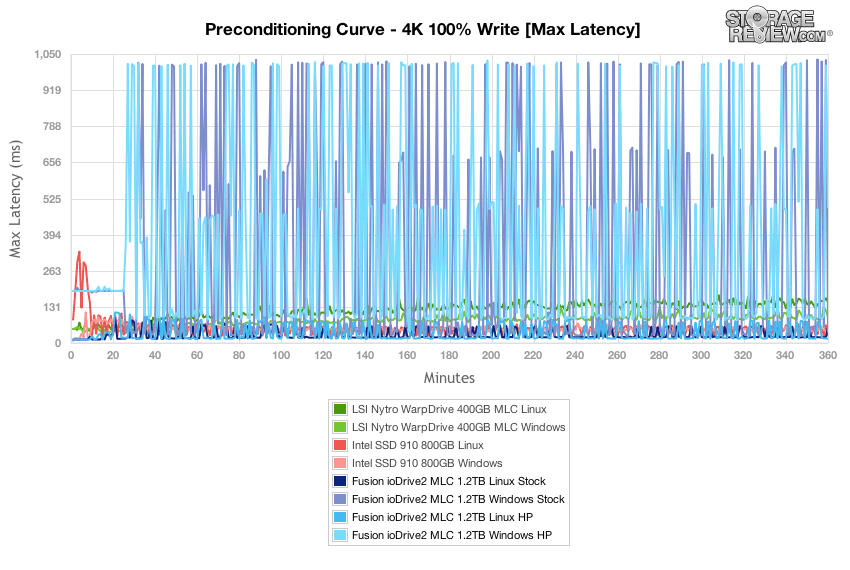
Comparing max latency, the Fusion-io ioDrive2 MLC had significantly better max response times with Linux than Windows. Additionally, its Windows HP Max latency was far behind the competition. Overall, the best figures came from the Intel SSD 910 Linux and ioDrive2 Linux HP at 26ms and 15ms, respectively.
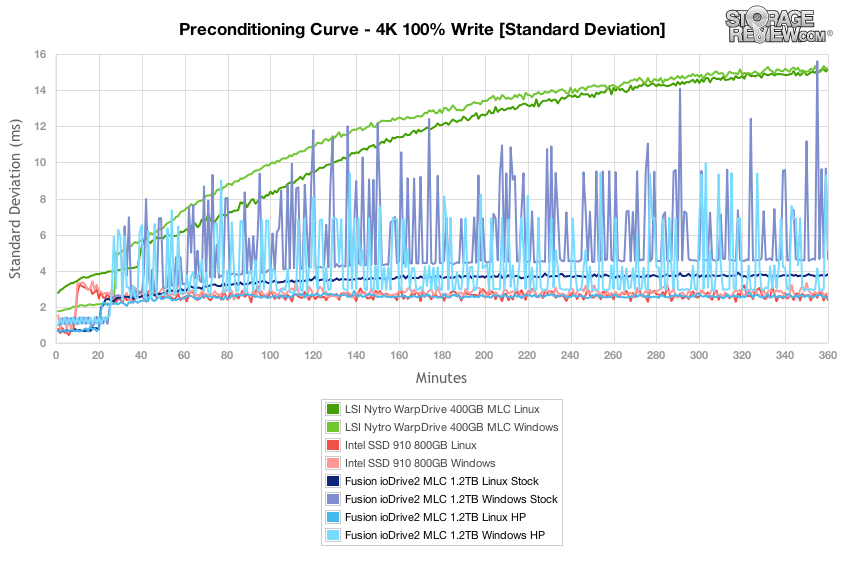
Looking even closer at latency consistency in our 4k random write workload, the Fusion-io ioDrive2 Linux and Windows HP both placed just behind the Intel SSD 910 which scored the top marks with 2.38ms for Linux and 2.72ms for Windows.
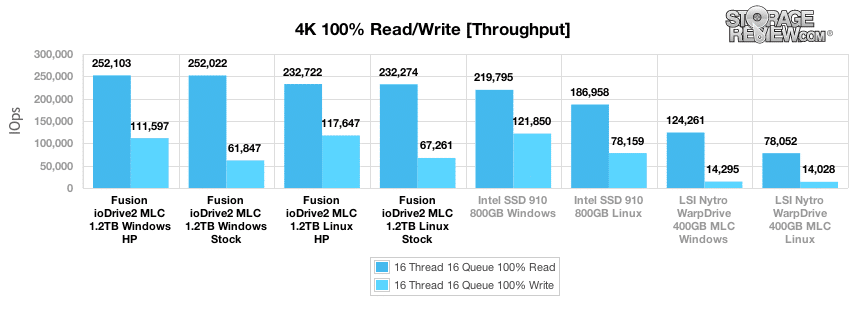
After 6 hours of preconditioning, the Fusion-io ioDrive2 Windows stock and HP offered 4k random read performance at an incredible 252,000 IOPS with write speed at 111,597 IOPS for HP and 61,847 IOPS for stock. The Intel SSD 910 delivered greater write throughput.
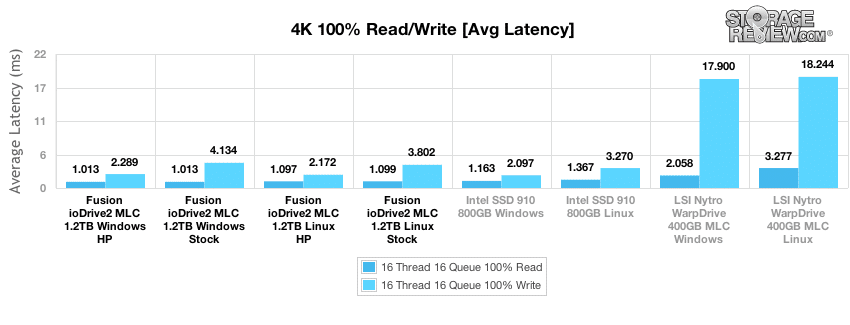
With a workload of 16T/16Q, the Fusion-io ioDrive2 Windows (HP and stock) offered an average 4k random read latency that lead the group at 1.013ms, while the best write latency performance went to the Intel SSD 910 Windows with a write latency of 2.097ms even.
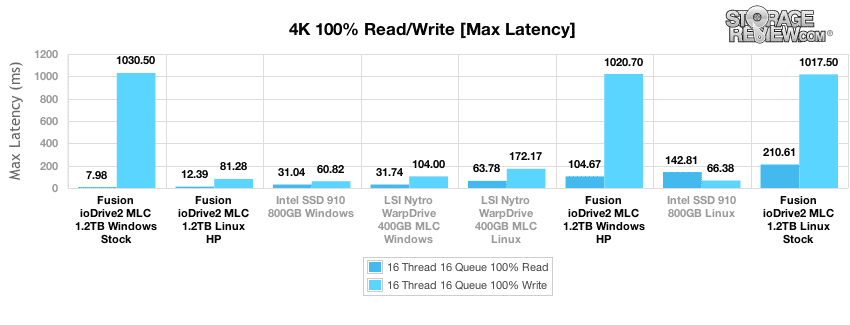
Max latency from the Fusion-io ioDrive2 Windows stock was the best for read activity at just 7.98ms, though its write activity max was the highest in the group at 1030.50ms.
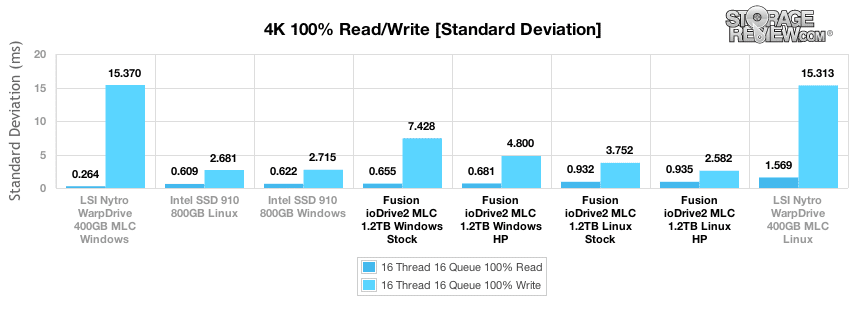
Comparing latency consistency, the Fusion-io ioDrive2 MLC posted figures near the back of the group in 4k random read and write consistency.
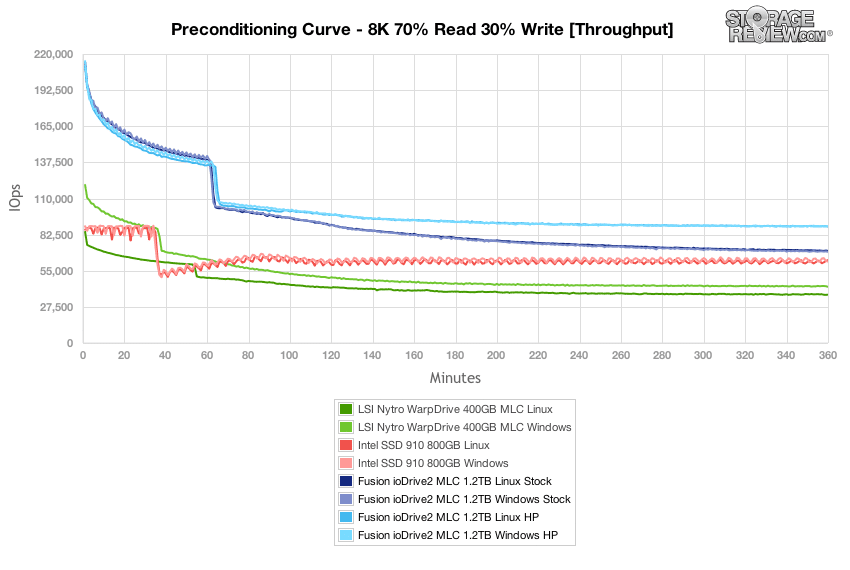
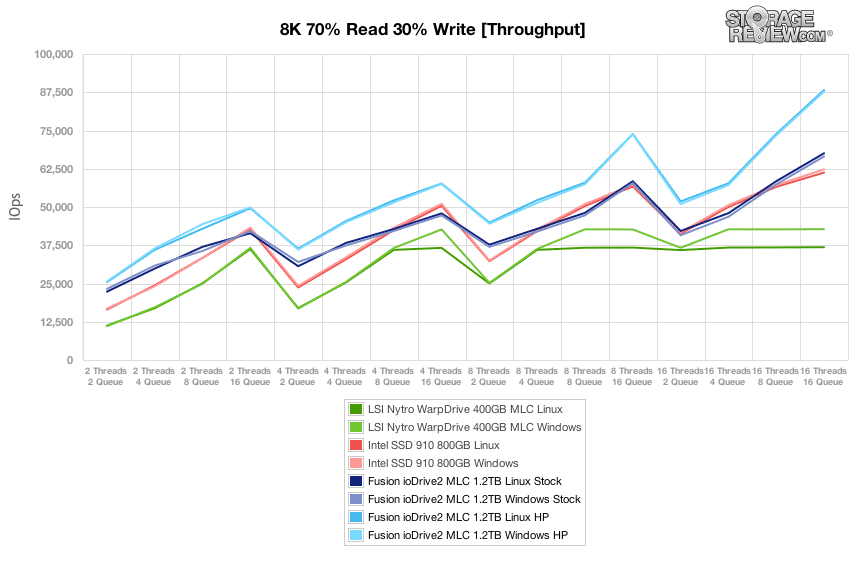
In our next workload, we look at an 8k profile with a 70/30 read/write mixed ratio. In this setting, the Fusion-io ioDrive2 in various configurations started off at 210,000+ IOPS burst which slowed to a speed around 70,000 IOPS for stock and 88,000 IOPS for HP. The burst performance was far ahead of the competition, and the steady-state rates were close to the competing drives' burst speeds, excluding the Nytro WarpDrive Windows.
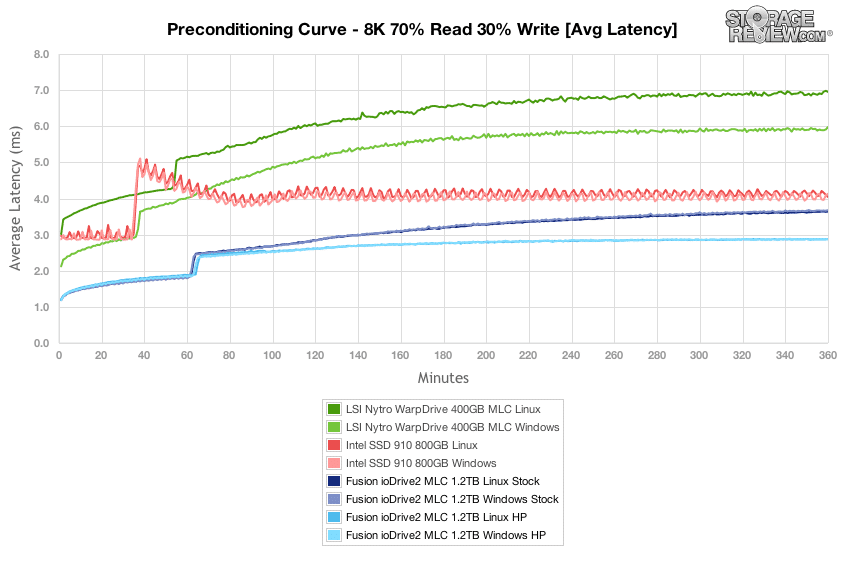
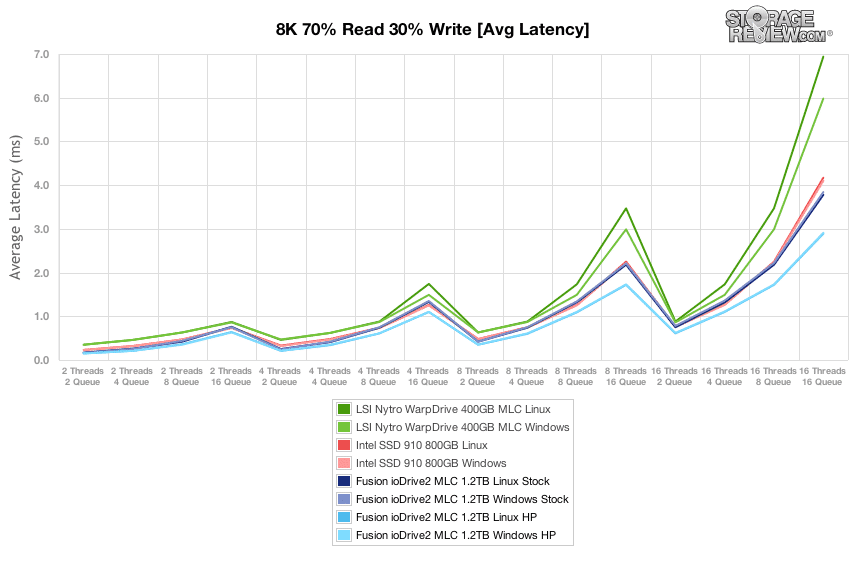
Average latency of the Fusion-io ioDrive2 in all modes measured 1.2ms at the beginning of our 8K 70/30 preconditioning test, which increased to around 2.88ms for HP and 3.65ms for stock as it neared steady-state. Those figures outperformed the competitions' marks.
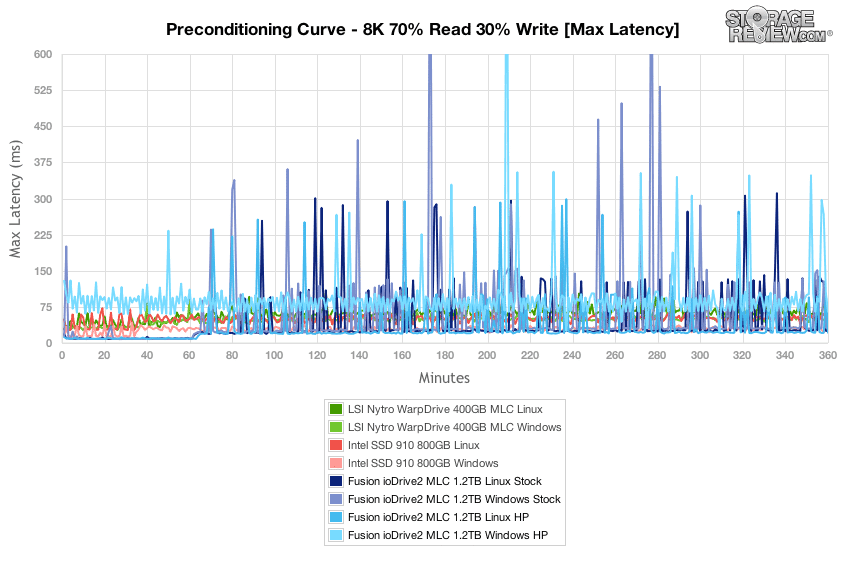
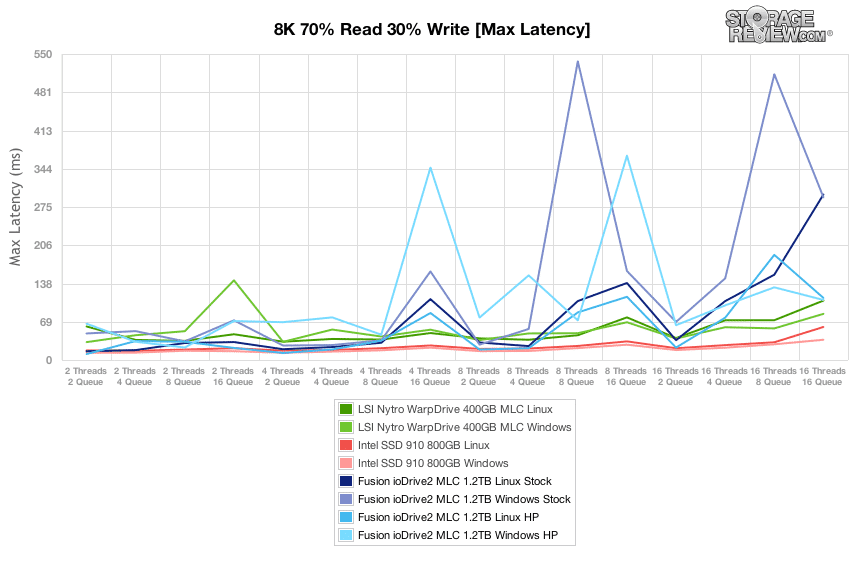
Over the duration of our 8k 70/30 test, the Fusion-io ioDrive2 Linux HP offered the best peak response times, with max latency measuring below 25ms for the bulk of the test. Again, the ioDrive2 Windows HP produced high max latency.
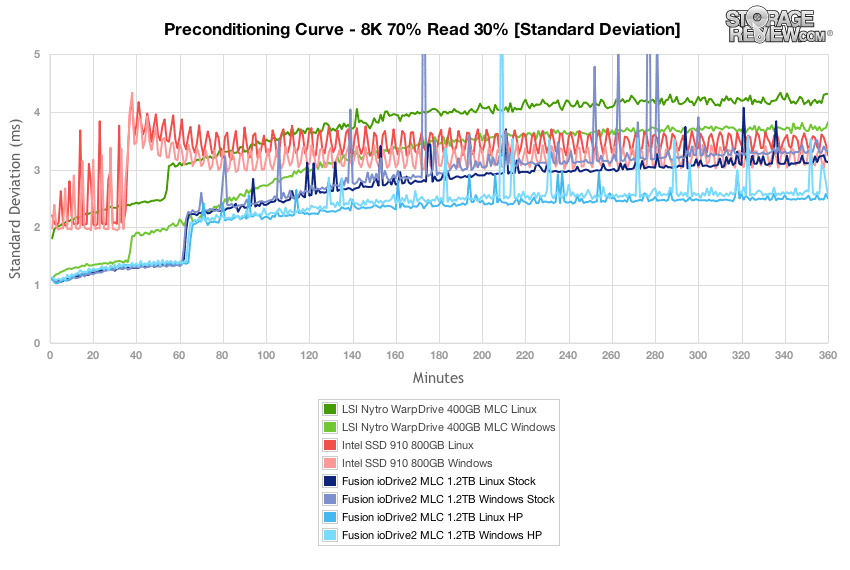
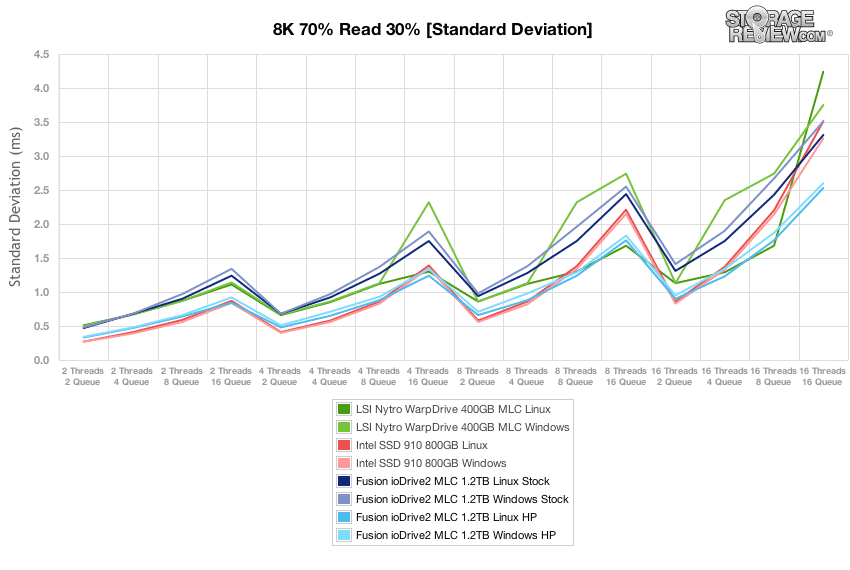
The Fusion-io ioDrive2 HP Linux and Windows latency consistency achieved the lowest marks throughout, ending at 2.5ms and 2.55ms, respectively.
Compared to the fixed 16 thread, 16 queue max workload we performed in the 100% 4k write test, our mixed workload profiles scale the performance across a wide range of thread/queue combinations. In these tests, we span workload intensity from 2 threads and 2 queue up to 16 threads and 16 queue. In the expanded 8k 70/30 test, the Fusion-io ioDrive2 HP for Linux and Windows peaked at around 88,000 IOPS which was at the top of the group, though the ioDrive2 stock also beat out the competition, though by a much slimmer margin.
Average latency for the Fusion-io ioDrive2 HP Linux and Windows was class-leading, and the stock version also bested the competition.
Over the duration of our varying load 8k 70/30 test, max latency stayed quite a bit higher than the competition with the Fusion-io ioDrive2 in all environments. The peak stayed just under 110ms for HP and ranged up to nearly 300ms for stock.
Standard deviation from the Fusion-io ioDrive2 HP in our test environment was class-best, and the ioDrive2 stock peaked right around the same marks as the Intel SSD 910.
Conclusion
The Fusion-io ioDrive2 MLC application accelerator runs in capacities up to 1.2TB in an HHHL form factor with a FHHL offering up to 3TB. Though its sibling that we recently reviewed, the ioDrive2 flagship Duo SLC, is designed to handle the most demanding applications with its SLC NAND and dual-controller configuration, the ioDrive2 single drive with MLC can still take on high-end workloads that require super low latency and high throughput. MLC NAND also means that Fusion-io can offer this model with increased capacity and at a lower price point than the SLC versions.
Having already tested the ioDrive2 Duo SLC not too long ago, we had a good point of reference for how the ioDrive2 single would perform. However, this time our testing environment has been updated as we have phased out some of our legacy synthetic benchmarks in favor of our MarkLogic and SysBench MySQL real-world testing environments. We started with those tests, and the ioDrive2 performed well. Though the ioDrive2's overall average latency was edged out slightly by the Intel SSD 910 in the MarkLogic test, its performance was competitive, and its journal write latency peaks were a fair amount lower than the Intel SSD 910's. In our SysBench test, the ioDrive2 went head to head with the LSI Nytro WarpDrive and produced several hundred more TPS while delivering less latency.
We then compared the ioDrive2 to both the Intel SSD 910 and the LSI Nytro WarpDrive utilizing the ioDrive2's over-provisioning for a high performance (HP) mode, and we tested all of the drives over both Linux and Windows. When it came to general throughput figures, the ioDrive2 consistently performed the best. Its HP mode delivered the greatest overall throughput which maxed out at over 250,000 in our 4k random test. The ioDrive2 also tested well in latency, except when it came to max latency in Windows, which we also observed from the ioDrive2 Duo SLC when we tested it. Aside from that category, the ioDrive2 performed extremely well.
Pros
- Superior management software package
- Offers the highest throughput in 4k and 8k workloads compared to entry-enterprise models
- Latency and throughput in Sysbench and MarkLogic real-world testing at parity or better than competition
Cons
- Max latency issues in both Windows and Linux
Bottom Line
The Fusion-io ioDrive2 MLC can accelerate systems to handle the most intensive workloads by delivering impressive throughput figures that are best-in-class on top of an industry-leading software management suite.


 Amazon