

Released today, the Intel SSD 660p Series is the company’s first client SSD to ship with 64-layer QLC (quad-level cell) 3D NAND. What this means to the end user is a less expensive SSD that has a reasonable performance profile. As will be true for most QLC SSD launches, the conversation is going to be about finally having an SSD that can replace HDDs both in terms of price and capacity. The 660p for its part is positioned as an NVMe SSD in a single-sided m.2 form factor that will accelerate the demise of HDDs and value-based SATA SSDs in client computing. The 660p is part of the larger Intel portfolio play that include faster drives based on TLC and Optane that hit mainstream and performance use cases.
Out of the gate the 660p comes in 512GB, 1TB and 2TB capacities with MSRP starting at $99 for the 512GB model and $199 for the 1TB. With such aggressive pricing, the natural reaction is to be concerned about performance. The 660p has a pretty good profile, especially for the intended value-centric audience. Using an on-board SLC NAND cache, the 660p is quoted to deliver sequential read/write of 1800/1800 MB/s. Random read/write 4K IOPS are also balanced at 220k/220k. Intel wants to be sure customers expect reliability and longevity out of the new QLC drives by including a 5-year warranty. Endurance figures are quoted at 100TBW for the 512TB drive, scaling to ~400TBW for the 2TB capacity.
Taking a deeper look at performance, Intel has architected the 660p for what they describe as “real world” workloads. In this case that means handling burst workloads that have a good deal of idle time in between. Further Intel takes advantage of the idle time to adjust the drive’s behavior to deliver a better experience by expanding/contracting the SLC cache into/out of the QLC NAND. Specifically this means handling the preponderance of end-user workloads like productivity applications and streaming services that often fall in the read/write bands of 60/40 to 80/20. For users desiring a little more manual control, Intel offers a performance boost mode via the Intel Toolbox software that manually flushes the SLC cache so inbound workloads are prioritized.
Our review is of the 1TB Intel 660p SSD.
Intel SSD 660p Specifications
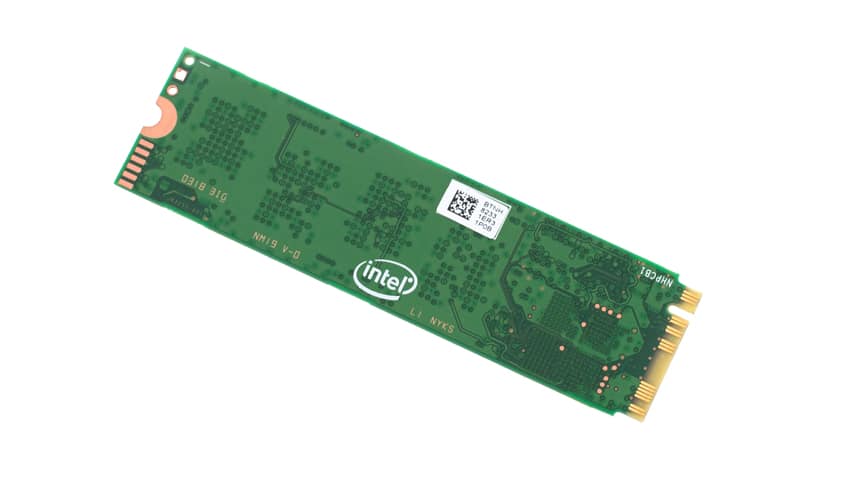
| Form factor | 80mm M.2 2280, S3, <10 grams |
| Capacities | 512, 1024 (1TB), 2048 (2TB) |
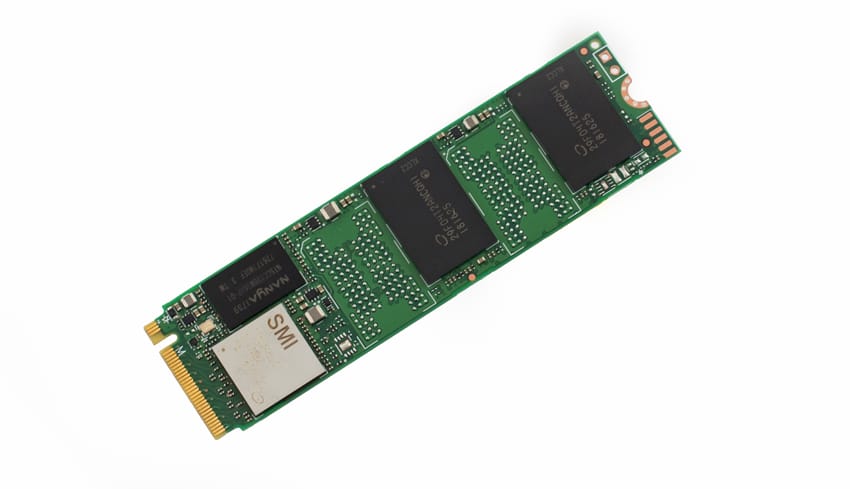
| NAND | 64-layer, QLC, Intel® 3D NAND |
| Interface | PCIe 3.0×4, NVMe |
| Controller | |
| Performance | |
| Sequential Read/Write max | up to 1,800MB/s (both) |
| Random 4K Read/Write max | up to 220,000 IOPS (both) |
| TBW | 100 per 512GB for 5 yr |
| AFR/MTBF | 0.55% / 1.6Mhrs |
| Warranty | 5-year |
Intel SSD 660p Speed
Testbed
The test platform leveraged in these tests is a Dell PowerEdge R740xd server. We measure SATA performance through a Dell H730P RAID card inside this server, although we set the card in HBA mode only to disable the impact of RAID card cache. NVMe is tested natively through an M.2 to PCIe adapter card. The methodology used better reflects end-user workflow with the consistency, scalability and flexibility testing within virtualized server offers. A large focus is put on drive latency across the entire load range of the drive, not just at the smallest QD1 (Queue-Depth 1) levels. We do this because many of the common consumer benchmarks don’t adequately capture end-user workload profiles.
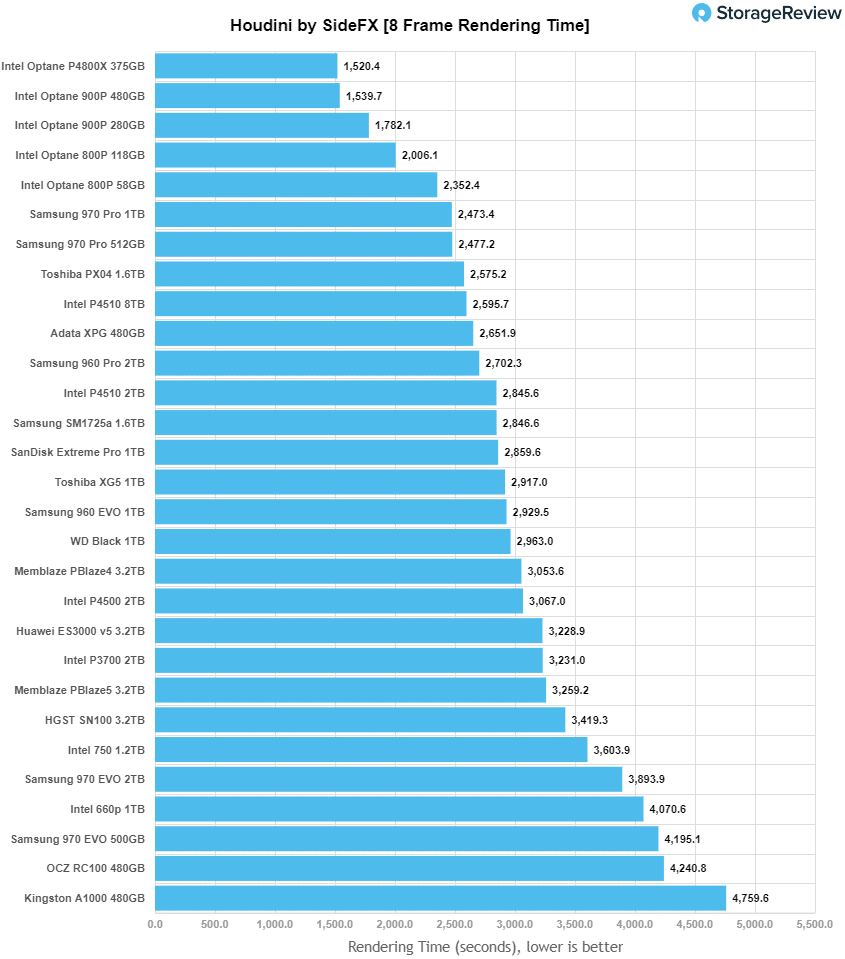
Houdini by SideFX
The Houdini test is specifically designed to evaluate storage performance as it relates to CGI rendering. The test bed for this application is a variant of the core Dell PowerEdge R740xd server type we use in the lab with dual Intel 6130 CPUs and 64GB DRAM. In this case we installed Ubuntu Desktop (ubuntu-16.04.3-desktop-amd64) running bare metal. Output of the benchmark is measured in seconds to complete, with fewer being better.
The Maelstrom demo represents a section of the rendering pipeline that highlights the performance capabilities of storage by demonstrating its ability to effectively use the swap file as a form of extended memory. The test does not write out the result data or process the points in order to isolate the wall-time effect of the latency impact to the underlying storage component. The test itself is composed of five phases, three of which we run as part of the benchmark, which are as follows:
- Loads packed points from disk. This is the time to read from disk. This is single threaded, which may limit overall throughput.
- Unpacks the points into a single flat array in order to allow them to be processed. If the points do not have dependency on other points, the working set could be adjusted to stay in-core. This step is multi-threaded.
- (Not Run) Process the points.
- Repacks them into bucketed blocks suitable for storing back to disk. This step is multi-threaded.
- (Not Run) Write the bucketed blocks back out to disk.
The Intel SSD 660p posted a score of 4,070.6 seconds, placing it near the bottom of the leaderboard.
SQL Server Performance
We use a lightweight virtualized SQL Server instance to appropriately represent what an application developer would use on a local workstation. The test is similar to what we run on storage arrays and enterprise drives, just scaled back to be a better approximation for behaviors employed by the end user. The workload employs the current draft of the Transaction Processing Performance Council’s Benchmark C (TPC-C), an online transaction processing benchmark that simulates the activities found in complex application environments.
The lightweight SQL Server VM is configured with three vDisks: 100GB volume for boot, a 350GB volume for the database and log files, and a 150GB volume used for the database backup we recover after each run. From a system resource perspective, we configure each VM with 16 vCPUs, 32GB of DRAM and leverage the LSI Logic SAS SCSI controller. This test uses SQL Server 2014 running on Windows Server 2012 R2 guest VMs and is stressed by Dell’s Benchmark Factory for Databases.
SQL Server Testing Configuration (per VM)
- Windows Server 2012 R2
- Storage Footprint: 600GB allocated, 500GB used
- SQL Server 2014
- Database Size: 1,500 scale
- Virtual Client Load: 15,000
- RAM Buffer: 24GB
- Test Length: 3 hours
- 2.5 hours preconditioning
- 30 minutes sample period
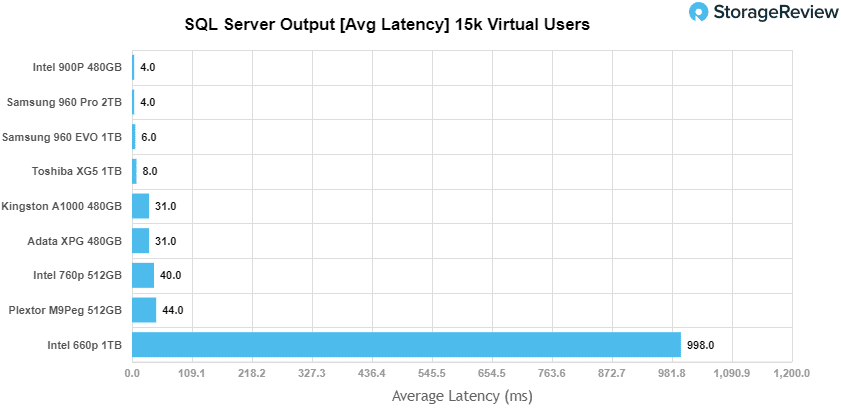
When looking at SQL Server Output, the Intel SSD 660p expectedly placed well behind the rest of the pack with a score of 2,613.3 TPS.
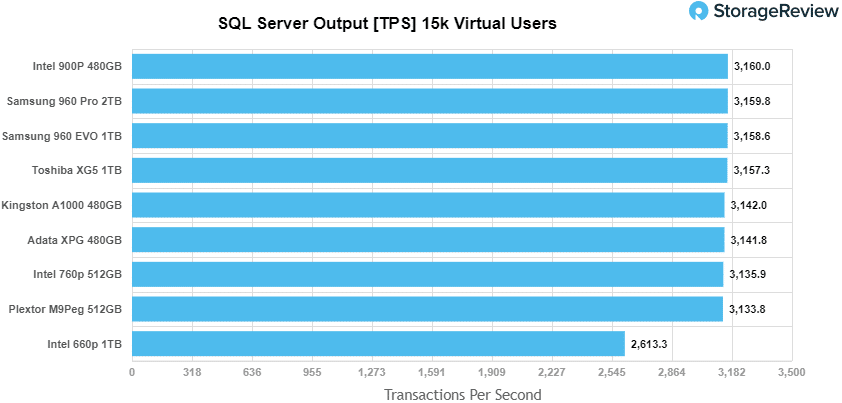
In average latency, the new Intel drive showed a very high 998.0ms.
VDBench Workload Analysis
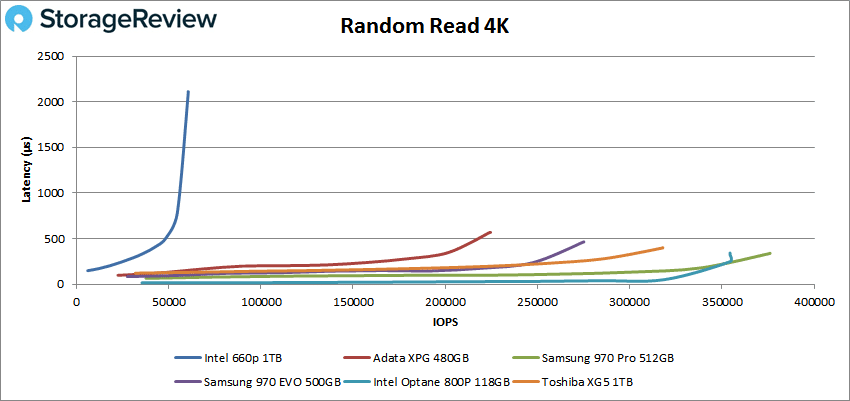
The peak 4K performance of the Intel 660p drive was 60,604 IOPS at a latency of 2,095μs, which placed it well behind even the slowest drive.
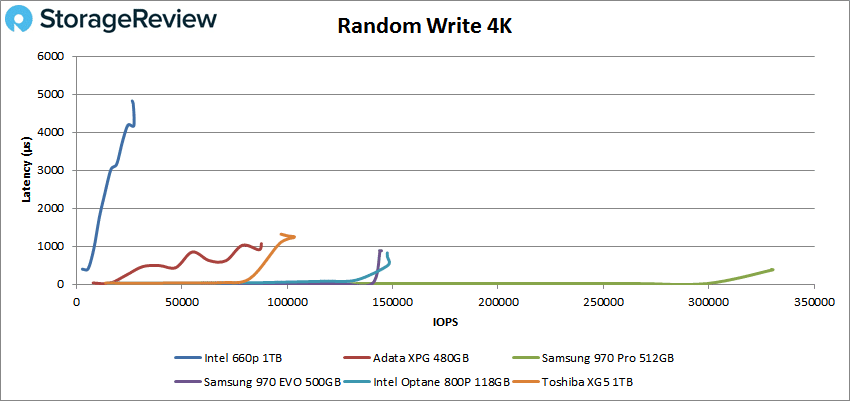
Write performance told a similar story, as the drive peaked at just 26,456 IOPS with a very high latency of 4.824ms.
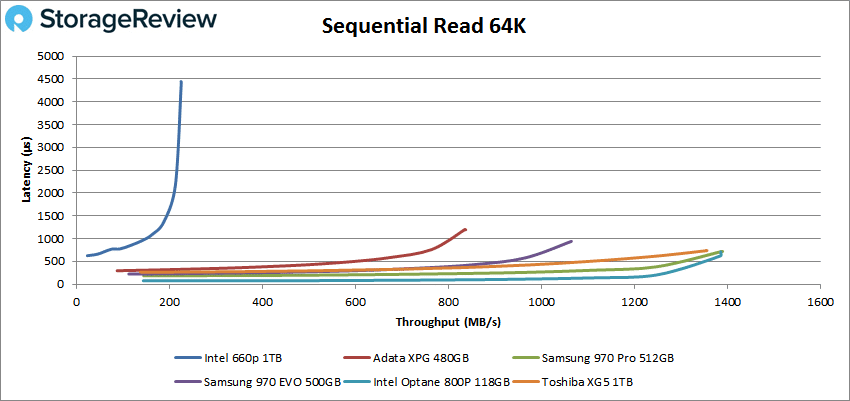
Switching over to sequential work with 64K tests didn’t show any improvements. Here, the new Intel drive had a last-place performance of 3,605 IOPS or 225MB/s at a latency of 4.44ms.
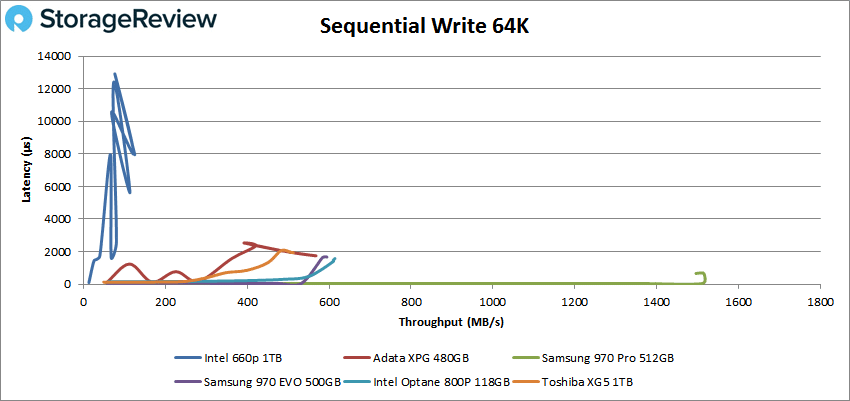
Looking at sequential 64K writes shows very uneven results as is made clear in the charts below. Here, the Intel 660p drive well behind again with a peak performance of 1235.4 IOPS or 77.21MB/s with a latency of 12.9ms.
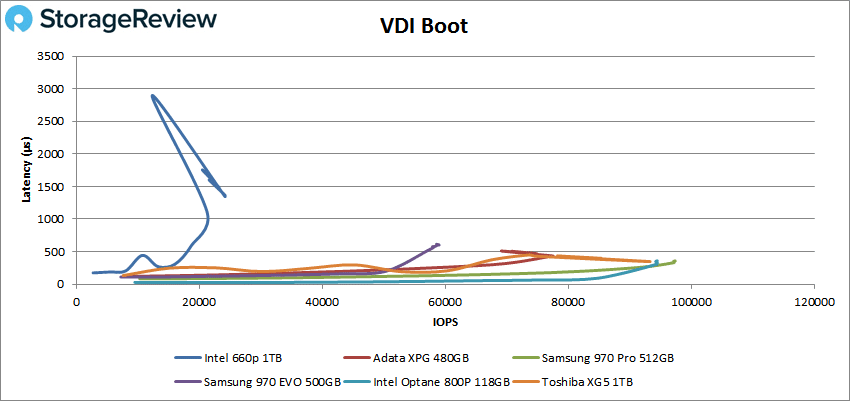
Next, we looked at our VDI benchmarks, which are designed to tax the drives even further. These tests include Boot, Initial Login, and Monday Login. Looking at the Boot test, the Intel 660p had peak performance of 24,164 IOPS with a latency of 1346.1μs, which was again well behind all other tested drives.
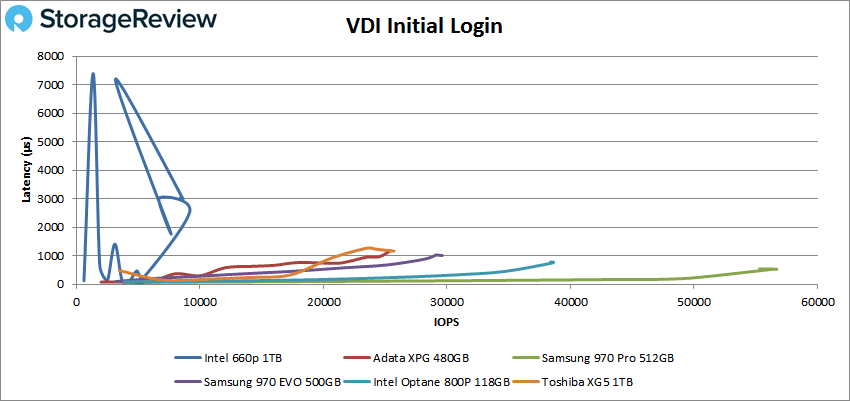
In our VDI Initial Login the Intel 660p drive come in last with more uneven performance, peaking at 8404 IOPS and 3.04ms in latency.
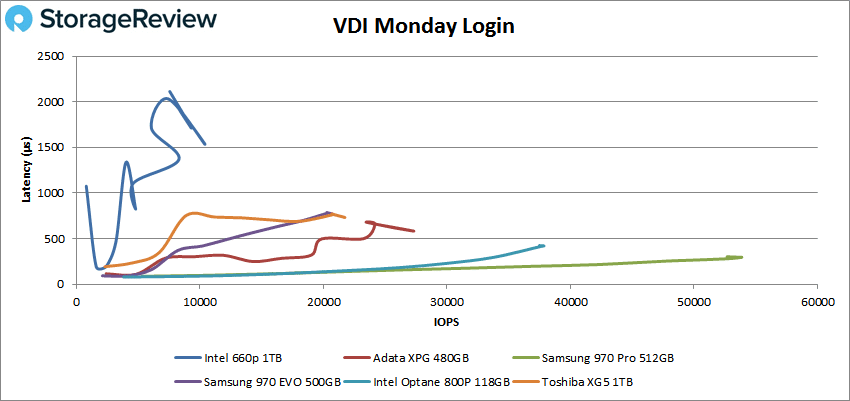
The Intel 660p drive followed the same performance path in our last test, VDI Monday Login, with a peak performance of 10,403 IOPS and a latency of 1534μs.
Conclusion
Intel’s new value-driven SSD is part of a larger portfolio that consists of much faster drives; however, the 660p is designed specifically to replace HDDs and SATA SSDs as the most viable and least expensive option for client-based systems. With its current price point, it certainly makes this case, though the 660p’s performance is low enough to cater to only those looking for a minimal upgrade from an HDD-based workstation. Intel’s new line does offer some pretty decent reliability features as well, with endurance numbers quoted at 100TBW for the 512TB drive (~400TBW for the 2TB capacity) bundled with a 5-year warranty. Users also can leverage a boost mode using the Intel Toolbox software, which manually flushes the SLC cache so inbound workloads are prioritized.
Looking at performance of the drive showed no surprises, as it was well behind the more expensive drives we compared it to. In the Houdini test the drive posted 4,070.6 seconds placing it near the bottom. In SQL Server the drive had 2,613.3 TPS and an average latency of 998ms, placing well behind the rest pack, while our VDI workload analyses showed more or less the same budget-friendly results. It was able to hit 4K peaks of 26,456 IOPS write and 60,604 IOPS read, with 64K scores of 225MB/s read and 77.21MB/s write. In our VDI tests the drive hit 24,164 IOPS boot, 8404 IOPS initial login, and 10,403 IOPS Monday login.
Alright, so against other SSDs, the 660p doesn’t look so hot, but this was to be expected going in. QLC SSDs, at least initially, aren’t going to be picked for performance. They’re going to be selected for a dollar/GB value play, as well as all of the inherent benefits of flash over magnetic HDD storage like lower power draw, resistance to physical damage like drops and less heat output. It’s been ages since we reviewed a new client 2.5″ HDD, but last time we did, the 2TB drive posted 4K random read IOPS of a little under 100, where we’re looking at 60,000 with the 660p. And while the sequential tests we run today aren’t exactly the same as they were with the HDDs, the 660p puts up large block sequential reads of 225MB/s and writes of 77MB/s where the HDD saw about 115MB/s and 110 MB/s respectively. So in terms of the market Intel is looking to address with the 660p, they hit the target successfully. The 660p is designed to fill a need at the mobile bulk storage end of the spectrum and continues the attack on 2.5″ HDDs, who’s days are clearly numbered.


 Amazon