

NVMe SSDs are taking over the data center, quickly cementing themselves as the go-to technology for mission critical applications. The NVMe interface lets flash run free, getting past legacy bottlenecks of SATA and SAS interfaces. Removing the flash floodgates though introduces new architectural challenges that aren’t easily solved with traditional HBA/RAID card server layouts. Intel has addressed this problem with a simplified solution for managing NVMe SSDs in servers. Virtual RAID on CPU, or Intel VROC for short, essentially allows the SSDs to have direct access to the CPUs, removing the need for an HBA entirely. This greatly simplifies both the data path and the components required to get the most out of NVMe SSDs in servers. In addition to enterprise-grade RAID, Intel VROC includes the expected serviceability the enterprise demands including pre-boot RAID management, hot plug support and LED management.
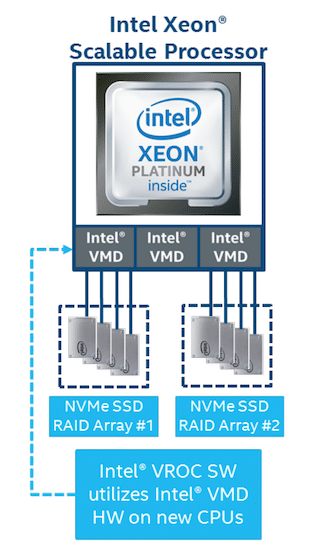
To better understand Intel VROC, it’s important to understand another technology called Intel Volume Management Device (Intel VMD). Compatible with the latest Intel Xeon Scalable processors, Intel VMD is an integrated controller inside the CPU PCIe root complex. The net result is Intel VMD enables more or less virtual HBAs for the connected NVMe SSDs. This is important because Intel VMD offers critical drive serviceability features that are simplified without sacrificing reliability. Thanks to Intel VMD, NVMe SSDs can be hot swapped without service interruption or reboot. Intel VMD redirects insertion and removal PCIe bus events to RAID storage aware drivers that handle these events and will initiate an auto rebuild. In case of a failure knowing which drive to remove is also critical, which can be difficult in data centers with dozens or hundreds of drives and inconsistent vendor drive bay labeling practices. Intel VMD supports NVMe LED Management, which is in line with the drive light specification that SATA and SAS drives have used for years, making it easy to identify and service an SSD when needed. Intel VMD is also widely supported in the industry, VMware, for instance, supports the Intel VMD NVMe driver natively in VMware ESXi 6.7 release which includes support for managing NVMe SSDs in vSAN..
Intel VROC builds on Intel VMD, bringing NVMe SSD RAID to the picture. Currently, a single Xeon Scalable CPU can support up to 12 NVMe direct attached drives and up to 6 RAID arrays. A dual-proc system would support 24 and 12 respectively. A CPU could however leverage switches to support up to 48 SSDs in a system. Intel VROC supports data volumes and boot volumes, something that has been historically difficult for NVMe drives to accomplish. RAID settings are configurable via BIOS or CLI and Intel supports management locally or remotely via RESTful agent.
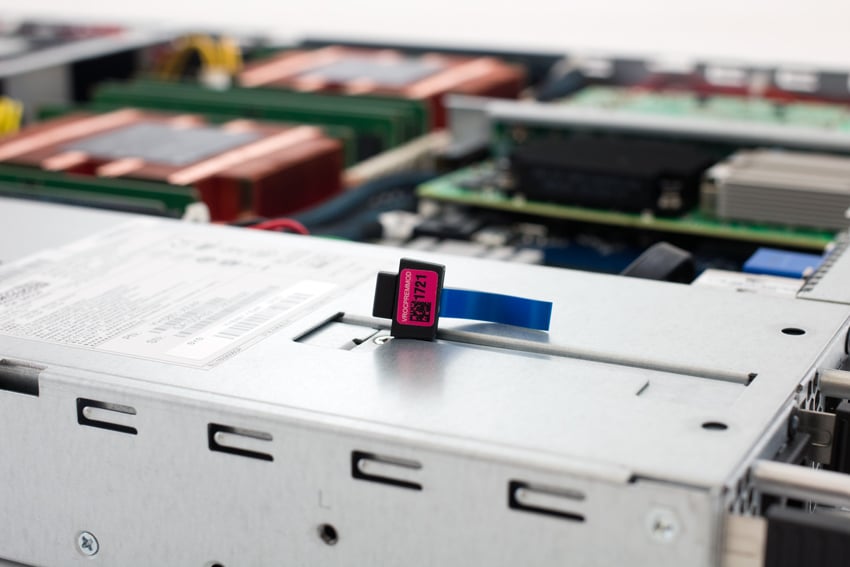
Intel VROC is sold as a physical key; there are three SKUs available. Standard supports RAID 0/1/10 with 3rd party SSD support. The Premium license adds support for RAID5. There’s also a Intel SSD Only license ,that as the name implies, supports Intel drives only but offers the full swath of RAID options.
In addition to a license, NVMe SSDs and Xeon Scalable CPUs, a compatible server is needed. While Intel VROC is widely supported, there are some server vendors that prefer their own card-based technologies for managing drives over this more modern alternative. In this review we’ve partnered with EchoStreams, who supports Intel VROC across their storage server lines.
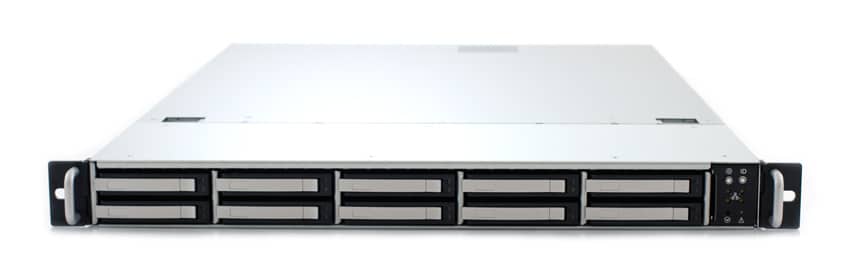
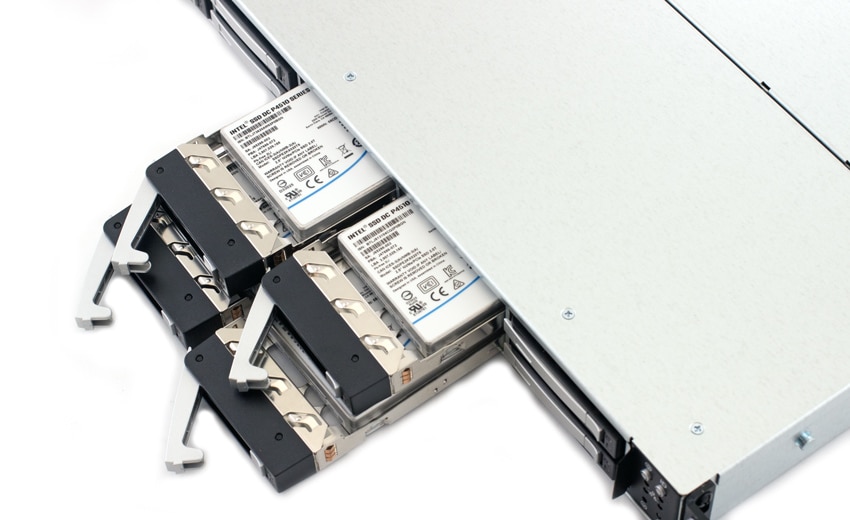
For such a small box, the EchoStreams FlacheSAN1N10U-D5 is extremely flexible. In our configuration, the server is equipped with twin Intel 8180M CPUs, 64GB RAM and eight 2TB Intel DC P4510 NVMe SSDs. The server offers three x16 PCIe 3.0 slots, allowing users to maximize the full potential of internal storage capacity with up to 160TB of NVMe flash (10x 16TB SSDs) and three 100Gbps Ethernet NICs.
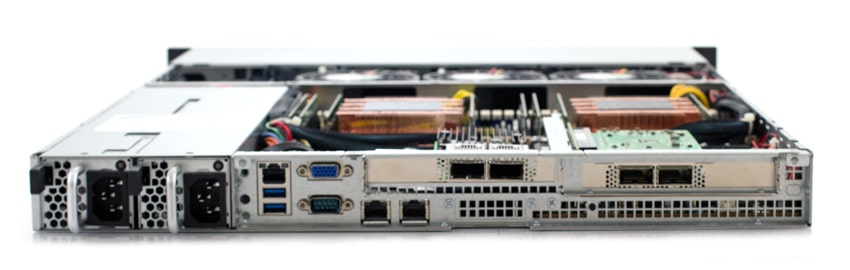
The chassis design also allows for a symmetrical layout between both CPUs, the NVMe SSDs and the outbound NICs. As a whitebox offering, the chassis can also be customized for the end user, supporting other SSD sizes as 15mm and 7mm U.2 as well as internal M.2 SSDs and Intel Optane. Finally the server can be configured with a dual 850W AC power supply offering, or be setup to support 48VDC high-efficiency power supplies. Given the high-end Intel CPUs in our configuration, the larger power supplies came in handy.
Looking at where the FlacheSAN1N10U-D5 can add value, EchoStreams points to content delivery networks (CDNs) as a primary use case. Currently customers are using these nodes as caching devices either in the data center or at edge locations to deliver popular content to end users. There are also several universities leveraging the platform for HPC and research uses where computational power and storage throughput provide a critical advantage in solving complex problems. Beyond these scenarios, the server also works well for media and entertainment post-production workflow and also pair well with software defined storage offerings that can benefit from NVMe storage and high-speed networking.
EchoStreams FlacheSAN1N10U-UN Specifications
| Form factor | 1U |
| CPU | Supports dual Socket LGA3647 Intel Xeon Scalable Processor |
| Chipset | Intel C622 |
| RAM | DDR4 up to 1.5TB RDIMM/RDIMM/LRDIMM 2666/2400 MHz |
| DIMM Slots | Up to 16 |
| Drive Bays |
|
| I/O Interface |
|
| Expansion Slots |
|
| Backplane | 5 x 2-Bay NVMe Backplanes |
| Supported OS |
|
| Power |
|
| Physical |
|
| Environmental |
|
Usability and Deployment
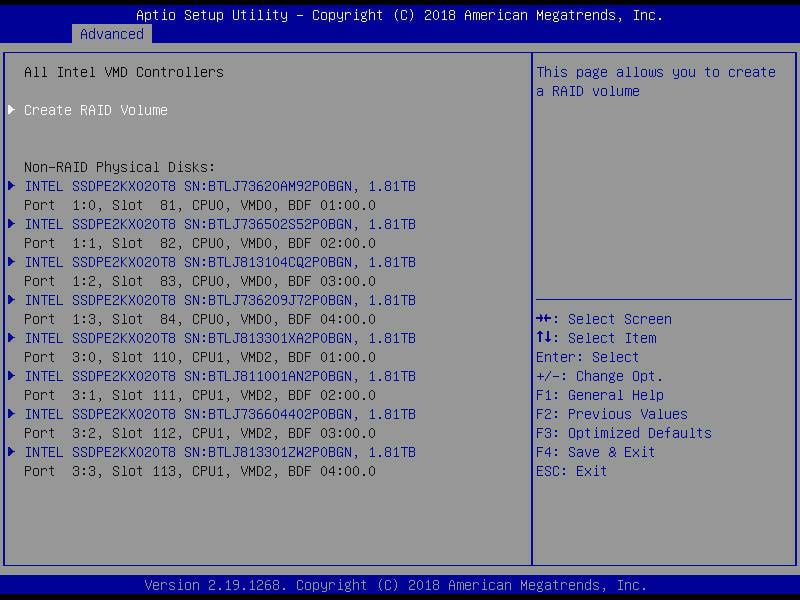
The motherboard doesn’t have a fancy GUI for configuring Intel VROC, but it sure is user friendly. For IT admins that might be familiar with using mdadm commands from a console, Intel VROC automates much of the backend work to simplify setup. While not loaded with bells and whistles, it won’t be difficult for most IT professionals to use. From the BIOS screen users can set up their RAID volumes while seeing the physical disks that are available.
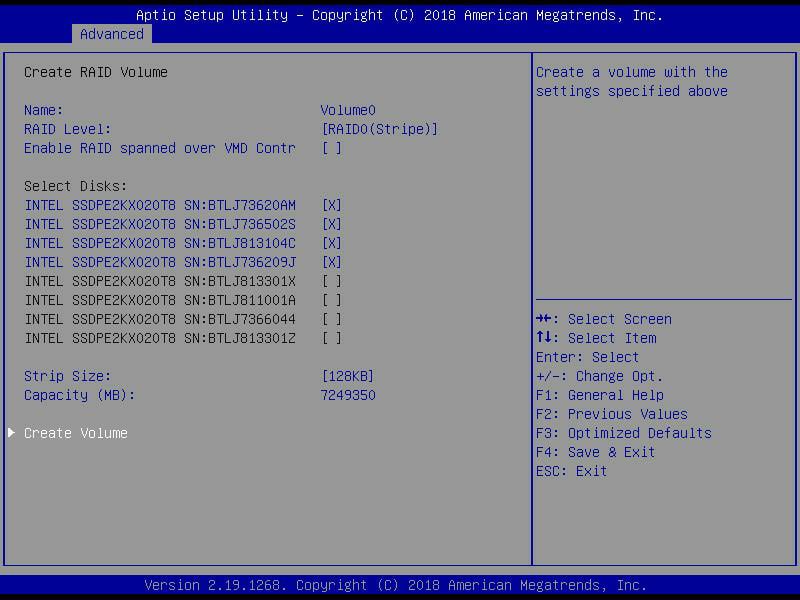
Next, one can name the volume (volume0 in this case), select the RAID level, and enable RAID spanned over both Intel VMD controllers.
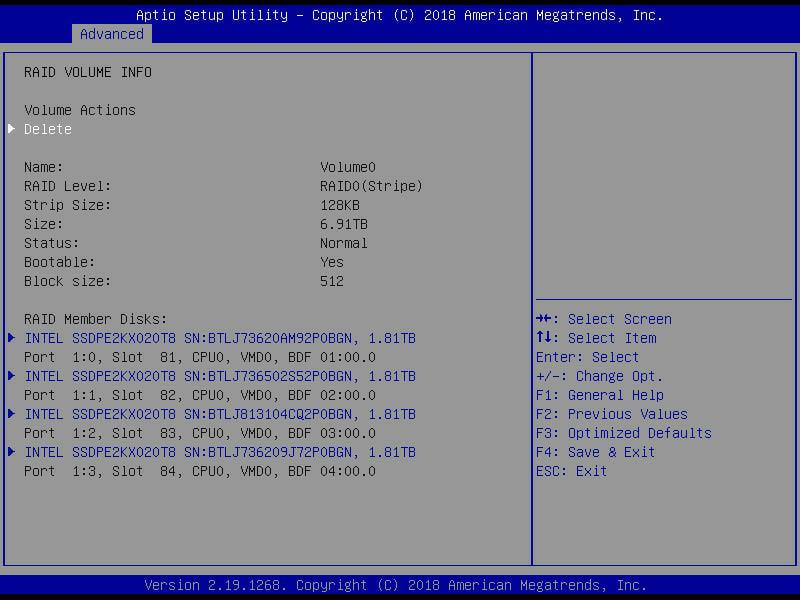
Once the RAID is set up, one can look at the volume actions such as deleting the RAID volume or making it bootable.
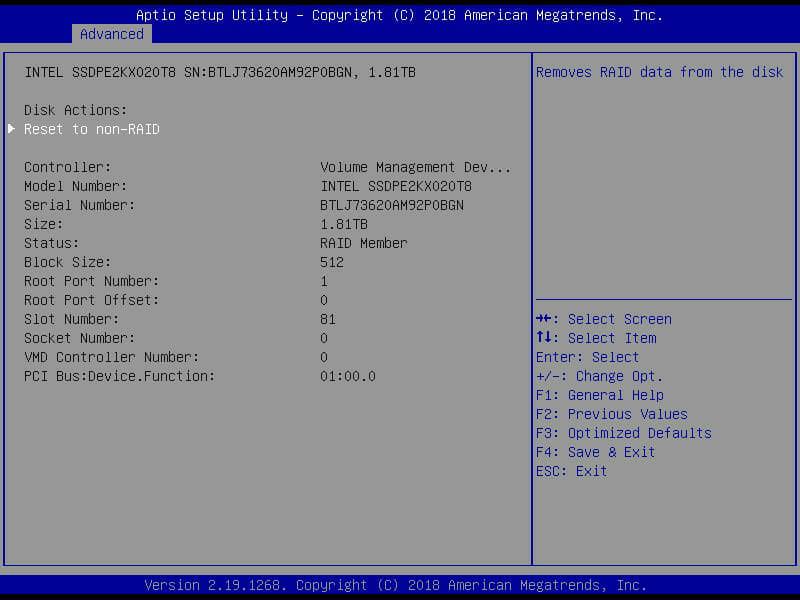
Finally, users can take disk actions such as resetting to non-RAID or removing the RAID data from the disks.
Once the system was up and running in our CentOS 7.4 environment, configuration of the RAID volumes were ready and waiting. For RAID5/10 volumes you can watch mdstat for background initialization progress, or change the entire RAID group manually if you wish. The BIOS level setup takes away much of the legwork for getting RAID up and running, but doesn’t remove or replace it for users wanting that extra level of customization.
Performance
VDBench Workload Analysis
When it comes to benchmarking storage arrays, application testing is best, and synthetic testing comes in second place. While not a perfect representation of actual workloads, synthetic tests do help to baseline storage devices with a repeatability factor that makes it easy to do apples-to-apples comparison between competing solutions. These workloads offer a range of different testing profiles ranging from “four corners” tests, common database transfer size tests, as well as trace captures from different VDI environments. All of these tests leverage the common vdBench workload generator, with a scripting engine to automate and capture results over a large compute testing cluster. This allows us to repeat the same workloads across a wide range of storage devices, including flash arrays and individual storage devices.
Profiles:
- 4K Random Read: 100% Read, 128 threads, 0-120% iorate
- 4K Random Write: 100% Write, 64 threads, 0-120% iorate
- 64K Sequential Read: 100% Read, 16 threads, 0-120% iorate
- 64K Sequential Write: 100% Write, 8 threads, 0-120% iorate
- Synthetic Database: SQL and Oracle
- VDI Full Clone and Linked Clone Traces
For this series of VDBench tests we will running our normal tests but instead of one device (e.g. SSD, server, or array), we will be running multiple configurations balanced over both CPUs:
- 8 drives in JBOD
- Two groups of four SSDs in RAID0
- Two groups of four SSDs in RAID5
- Two groups of four SSDs in RAID10
Data presented below is the aggregate of the 8 SSDs use in each configuration. This data is simply intended to highlight what this platform is capable of in the variety of configurations that Intel VROC supports. It should be noted that RAID5 posts lower write performance throughout this review due to the complexity of parity calculations and updating and is expected based on RAID level comparisons.
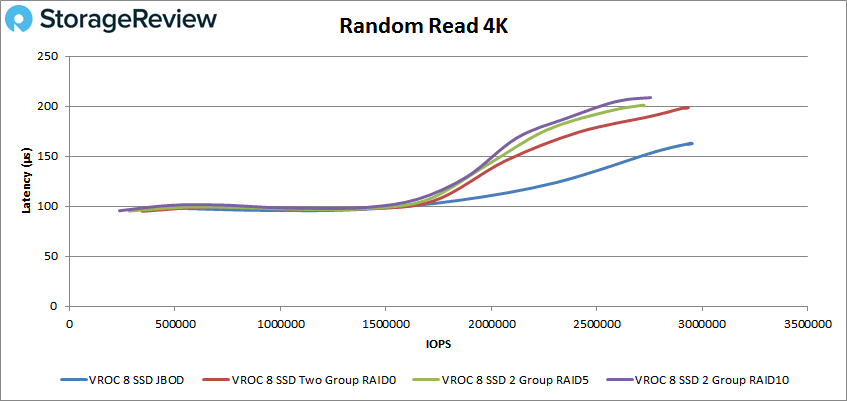
For 4K peak random performance all RAID groups were able to stay under 1ms for latency (in fact all groups were under 210μs). All groups finished between 2.5 million and 3 million IOPS with the top performance going to the JBOD group with 2,944,335 IOPS and a latency of 163μs.
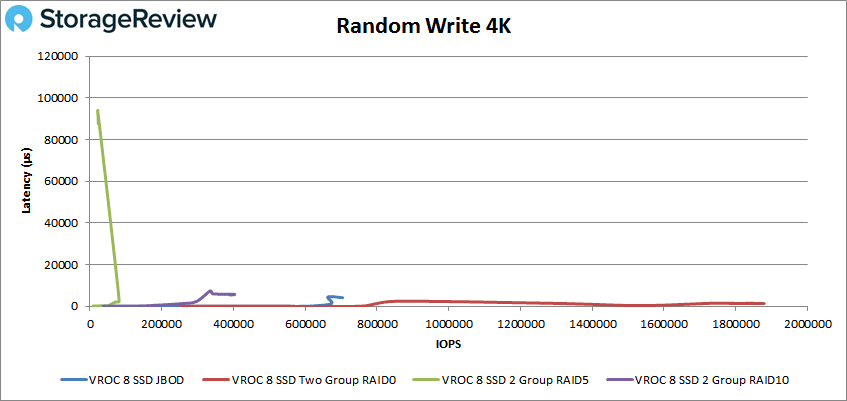
4K random write didn’t see the same unity with the different RAID groups. The RAID5 group had the lowest performance with a peak of 21,921 IOPS and a latency of 936.7ms. The other RAID groups performed better with the RAID0 group peaking at 1,879,180 IOPS with a latency of 1.35ms.
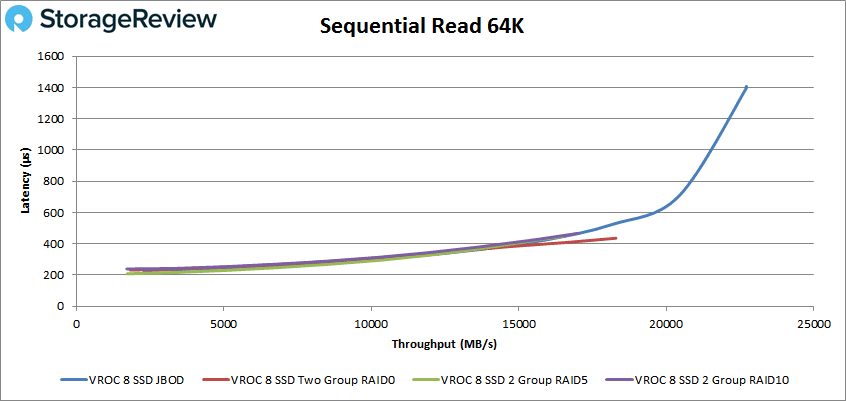
Switching over to sequential workloads, 64K read showed all RAID groups start off strong with sub-millisecond latency and only the JBOD going over 1ms around 330K IOPS or 22GB/s and peaking at 363,203 IOPS or 22.7GB/s at a latency of only 1.4ms.
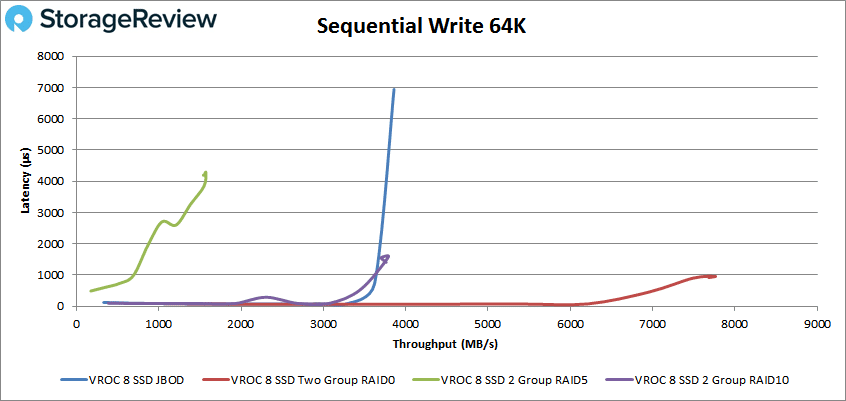
Again with writes the RAID groups break up delivering very different performances. Once again the RAID5 group petered out around 25K IOPS with 4.3ms latency and RAID0 went on to 124,104 IOPS with a latency of 958μs.
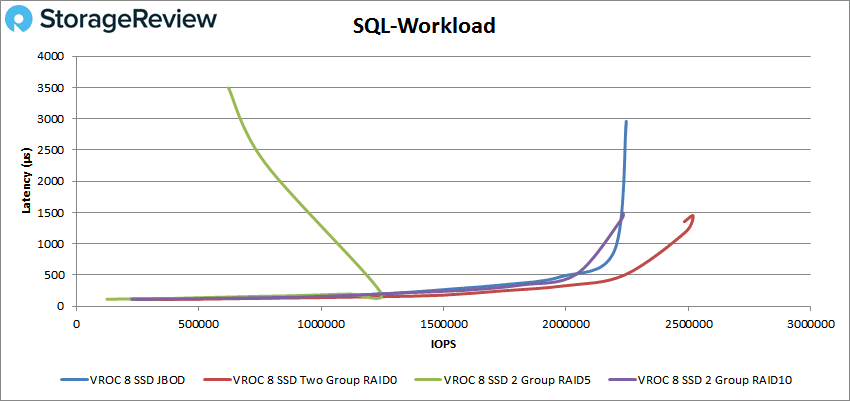
Next up are our SQL workloads. All RAID groups had sub-millisecond latency performance until about 1.4 million IOPS. Here the RAID5 group spiked in latency and dropped off in performance. The other three groups continued on under 1ms until they all broke 2 million IOPS. The highest numbers are once again bestowed to the RAID0 group with peak performance of 2,519,727 IOPS at a latency of 1.45ms.
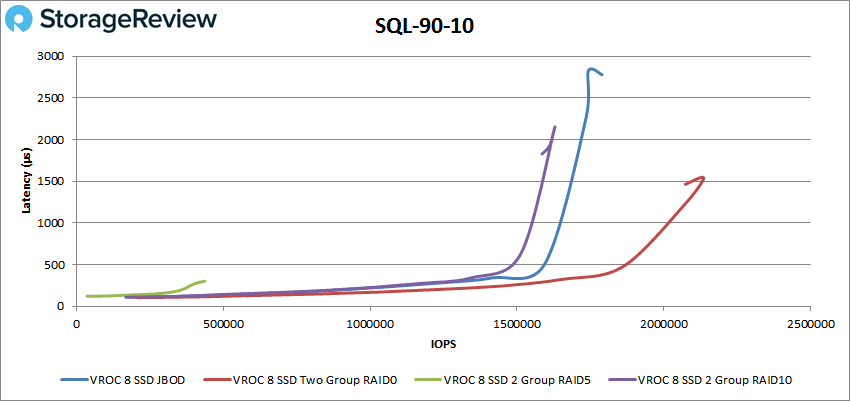
For SQL 90-10 we saw a better latency profile for the RAID5 group with a peak of 302μs but its peak performance was only 436,439 IOPS. The other groups made it over 1.5 million IOPS before breaking 1ms, with both the JBOD and RAID10 groups peaking shortly there after. The RAID0 group peaked at 2,135,362 IOPS with a latency of 1.54ms.
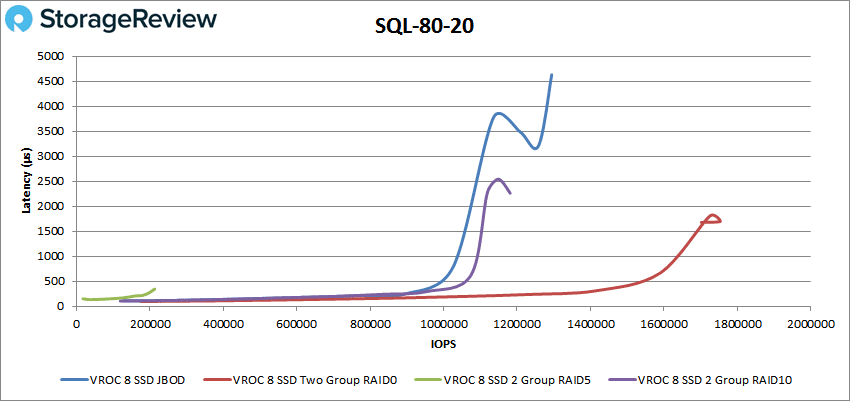
Once again in SQL 80-20, the RAID5 group had sub-millisecond latency with lower performance compared to the others, 345μs to 212,980 IOPS. The other groups passed 1 million IOPS below 1ms with the JBOD and RAID10 peaking shortly after once again and the RAID0 peaking at 1,753,622 IOPS at a latency of 1.7ms.
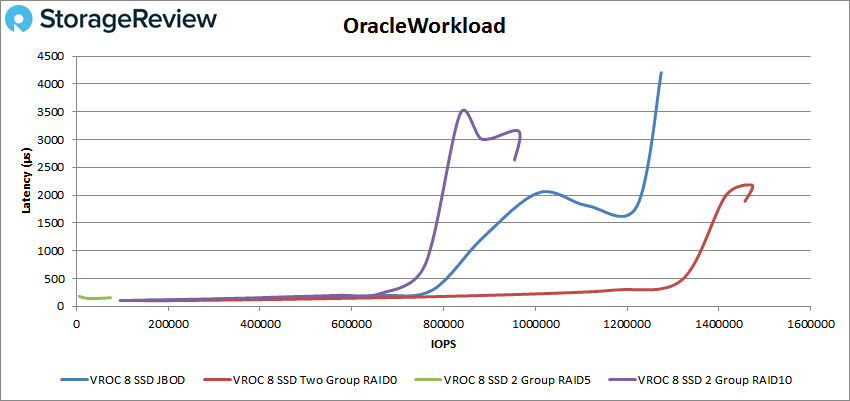
Our Oracle benchmarks, unsurprisingly gave us similar placement to the above. The RAID5 group peaked first at 61,695 IOPS with a latency of 153μs. The other drives made it to about 780K IOPS together at less than 1ms before the RAID10 broke above and peaked (954,567 IOPS at a latency of 2.63ms), followed by the JBOD (peaking at 1,274,172 IOPS with a latency of 4.2ms), and finally the RAID0 group with a peak of 1,472,338 IOPS with a latency of 2.18ms.
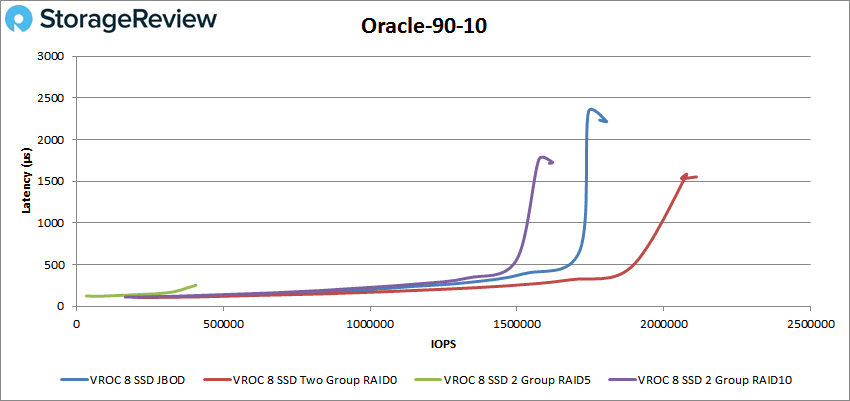
Oracle 90-10 had the RAID5 group peak first with 406,693 IOPS and a latency of 255μs. The other groups had sub-millisecond latency until over 1.5 million IOPS and peaked in the same manner we’ve been seeing: RAID10, JBOD, and RAID0 with the top spot of 2,110,799 IOPS and a latency of 1.55ms.
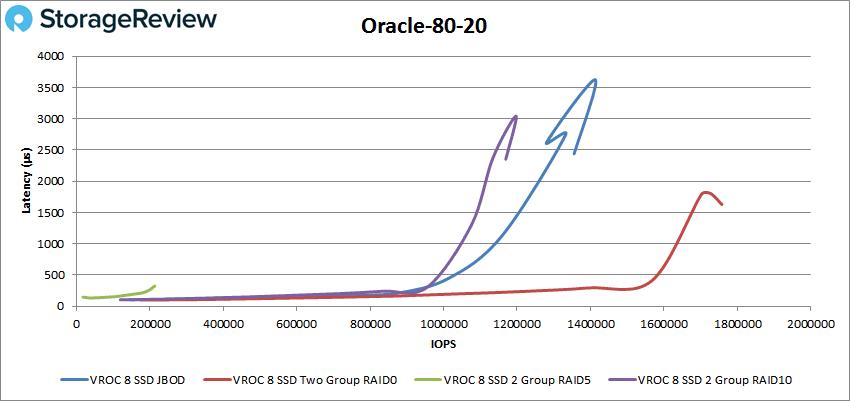
For Oracle 80-20 the RAID5 group peaked at 213,479 IOPS and a latency of 327μs. The other groups made it to over 1 million IOPS before peaking with the RAID0 making it to 1.65 million IOPS at less than 1ms and peaking at 1,757,722 IOPS with a latency of 1.63ms.
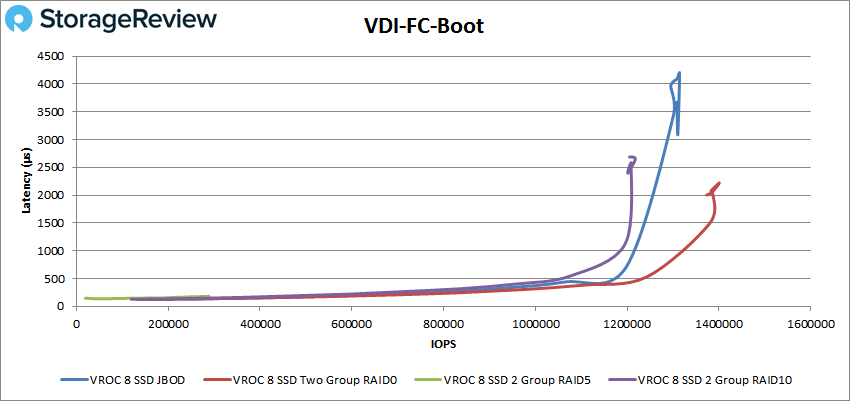
Next, we switched over to our VDI clone test, Full and Linked. Here we continue to see the same familiar pattern of placement for the different RAID groups: RAID5, RAID10, JBOD, and RAID0. For VDI Full Clone Boot, The RAID5 group peaked at 288,613 IOPS with a latency of 182μs. The other groups made it to nearly 1.2 million IOPS with sub-millisecond latency before first the RAID10 group shot up to 1,217,620 IOPS with 2.65ms latency followed by the JBOD group with 1,314,075 IOPS with 4.19ms latency and then the RAID0 group with 1,400,765 IOPS with a latency of 2.22ms.
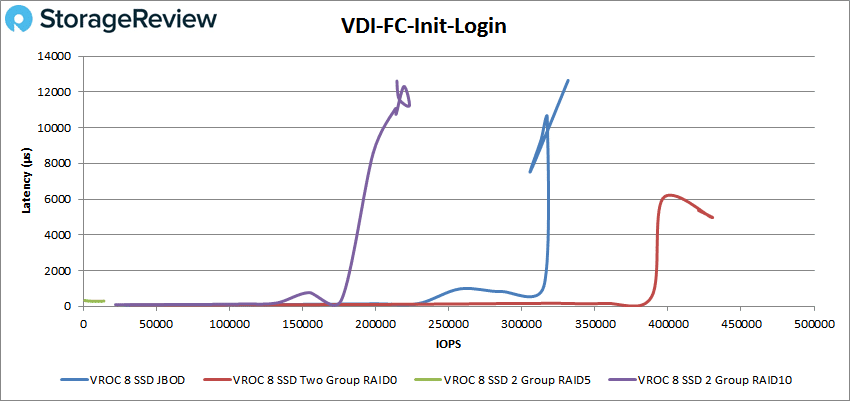
With VDI FC Initial Login, the RAID5 group had a very short run peaking at 13,296 IOPS and 286μs for latency. The other drives made it to 175K IOPS before breaking 1ms. The RAID0 group made it all the way to 390K IOPS with sub-millisecond latency and peaked at 429,692 IOPS with a latency 4.98ms.
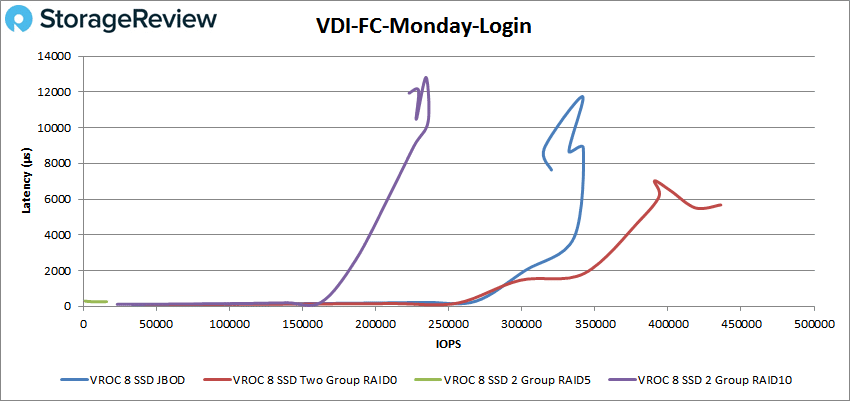
With VDI FC Monday login the RAID5 group peaked at 15K IOPS with 262μs. The other RAID groups made it past 150K before breaking 1ms with the RAID10 group and JBOD seeing fairly high latency 12.8ms and 11.7ms respectively, though the performance was impressive, 234,431 IOPS and 341,483 IOPS. The RAID0 group had the overall best performance with 435,641 IOPS and a latency of 5.67ms.
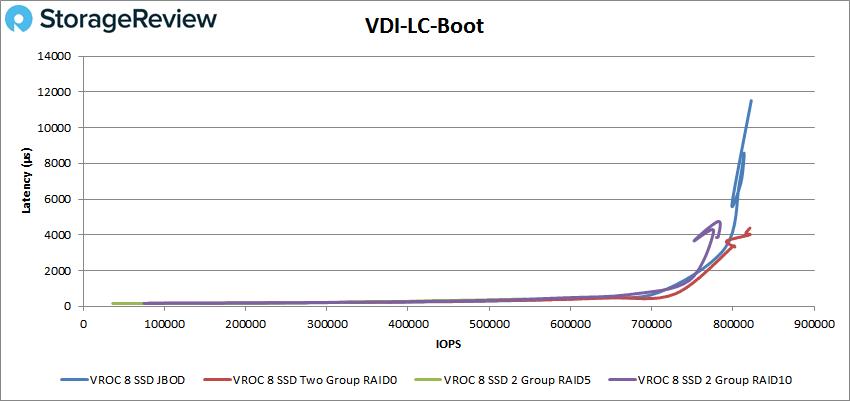
Switching over to our VDI Linked Clone tests we see much stronger performance from all groups in our boot with RAID5 group peaking at 543,680 IOPS and 407μs latency, RAID10 peaking at 782,224 with 4.76ms latency, JBOD peaking at 822,555 IOPS with 11.52ms latency, and RAID0 peaking at 820,998 IOPS with 4.39ms latency.
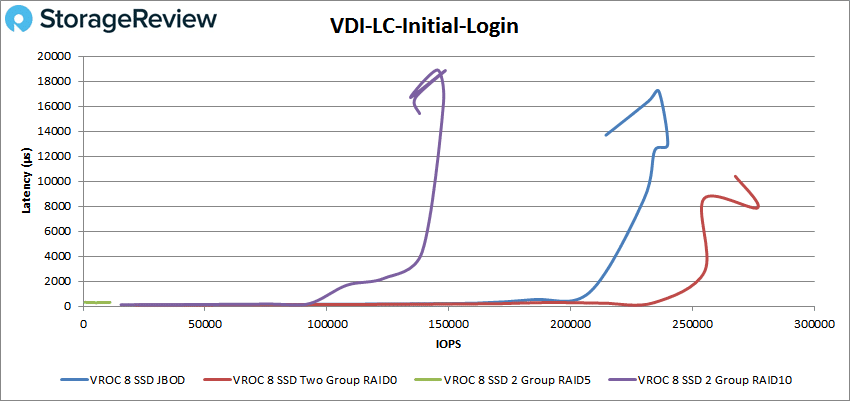
With VDI LC Initial Login we see peak performances ranging from 10,998 IOPS with 312μs latency from the RAID5 to 276,814 IOPS with 7.88ms latency for the RAID0.
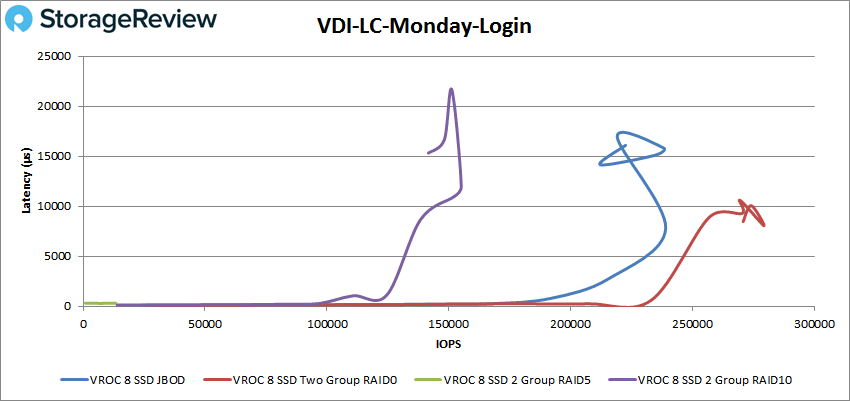
Finally with VDI LC Monday Login we continue to see the pattern of RAID5 finishing first (11,591 IOPS at 315μs) followed by RAID10 (roughly 155K IOPS at 1.2ms for peak) then JBOD (roughly 238K IOPS at 15.8ms peak) and finally RAID0 (279,332 IOPS at 8.06ms).
Conclusion
Looking at Intel VROC performance on this 1U EchoStreams platform, we looked at four different test groups that each used aggregate data from 8x of the Intel P4510 NVMe SSDs. It’s easy to declare RAID0 as the “winner” from the group, but that’s for expected reasons due to how RAID works. Looking at the performance results bottom up; as noted at the outset, RAID5 has a heavy data redundancy penalty with parity calculations and that is clearly reflected in the data. RAID10 uses mirroring, so the redundancy penalty is much lower and thus the results take a big leap forward compared to RAID5. That group is followed by JBOD, with aggregate pass-thru performance. RAID0 leads the numbers since it is solely performance focused and takes advantage of the drives working in concert via data striping, but sacrifices data resiliency. All of the data, from a RAID functionality perspective, supports the fact that Intel VROC is implemented well and provides consistent and expected results on a well-engineered platform.
Instead of going over every result in detail (with four groups this will generate 64 results total), we will instead look at some of the highlights. In our 4K test we saw the JBOD group nearly hit 3 million IOPS at sub-millisecond latency for reads and RAID0 hit 1.9 million IOPS at just 1.35ms latency. For 64K sequential we saw numbers as high as 22.7GB/s read and 7.8GB/s write. Our SQL tests saw 2.5 million IOPS, 2.1 million IOPS for 90-10, and 1.75 million IOPS for 80-20 all under 1.7ms latency. Oracle saw 1.47million IOPS, 2.1 million IOPS for 90-10 and 1.76 million IOPS for 80-20 all at 2.18ms latency or less. Our VDI test showed FC Boot of 1.4 million IOPS, FC Initial Login of 430K IOPS, and VDI FC Monday Login of 436K IOPS and LC Boot of 821K IOPS, LC Initial Login of 277K IOPS, and LC Monday Login of 279K IOPS.
Ultimately, what Intel VROC provides systems vendors like EchoStreams is a simplified way of delivering RAID with NVMe SSDs. The result is EchoStreams can deliver excellent throughput and latency with less complexity and cost. Further, thanks to the additional features from Intel VMD, EchoStreams customers get improved system serviceability with features like NVMe SSD hot swap, NVMe drive light support and bootable RAID with pre-boot configuration. As noted, the use cases are varied, but clearly there’s huge potential for CDNs and others who can benefit from enterprise-grade RAID across the fastest storage and networking interfaces widely available.


 Amazon