

Imagine if your exercise app only recorded you doing a simple regimen that never changed or required any adjustment in your level of effort. The 2D graph plot of your workout would look like the flat line on a heart monitor, providing little enlightenment about your overall performance. Unfortunately, that’s what a plot line of a synthetic benchmark for workstation storage performance looks like. These types of benchmarks are designed to extract peak values out of the storage device using access specifications that are heavily optimized across firmware, drivers and hardware.
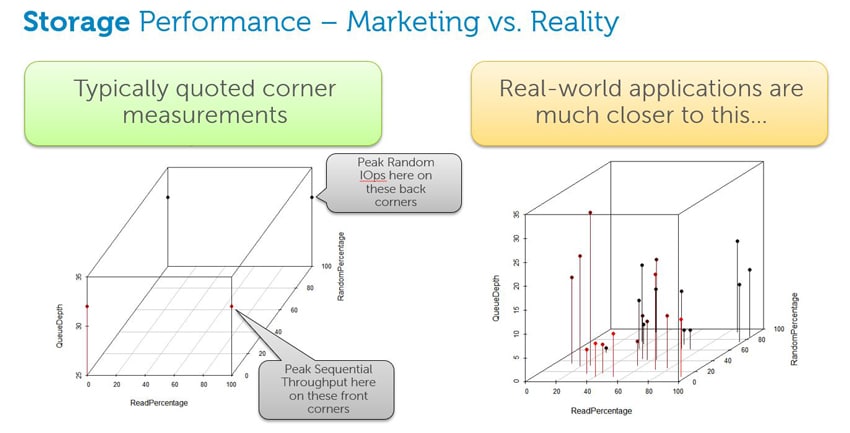
The classic case is measuring random IO at 4K block sizes with very high queue depth. In this scenario, there is ample opportunity for vendors to optimize the storage queue and maximize the IOPS (input/output operations per second) score for the device. In contrast, real workstation applications have an average IO range of one or two. With queue depths this low, reordering and other optimizations don’t have as dramatic of an effect on performance; the bottleneck shifts down to raw hardware capabilities, even with RAID or aggressive hybrid/tiered caching architectures.
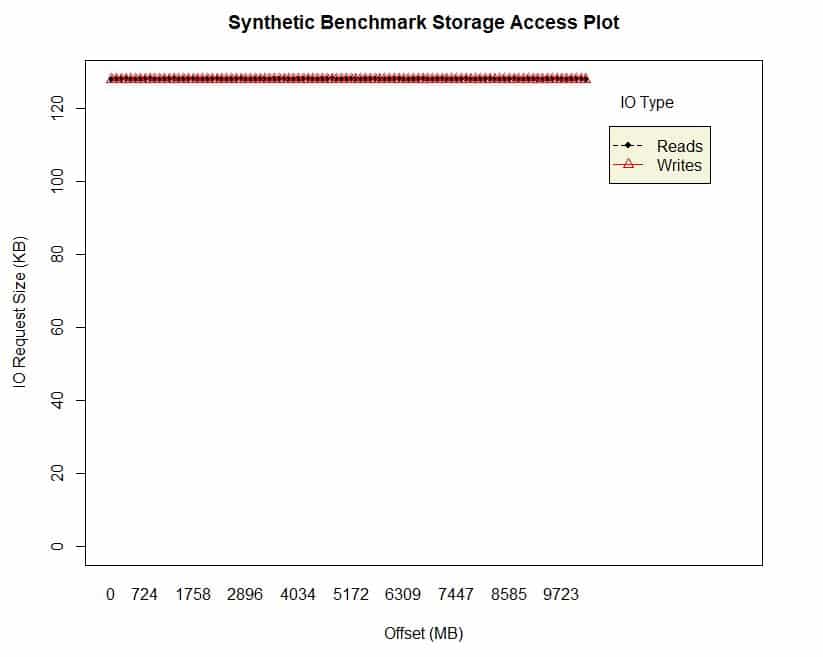
A graph plotting storage reads and writes for a synthetic benchmark. The X axis is the offset from a starting location where an IO occurs. The Y axis is the block size of the transaction made to that location. A 128K block size, for example, would try to read 128K of data from the drive at some offset location, all in one request.
Unpredictable storage paths
Real workstation applications don’t follow predictable paths for optimal storage accesses. In the world of non-linear video editing, for example, a block size more closely aligns with the container format or encoding method rather than an optimal block size for very large file transfers.
It would be significantly faster for an application to use 128K block sizes for all large files read into memory, and then traverse that data in a smaller size. But, the fact that the application dictates other, less optimal, methods of accessing storage makes any synthetic measurement less representative of how real work is processed.
Video editing is just one example. Almost all applications, even those within the same industry, use different read/write methods, making the measurement of peak performance states largely irrelevant. The only way to measure storage accurately is to mimic the operations as they occur within the actual applications.
Improving the methodology
For its SPECwpc 2.1 benchmark, released in early 2016, the SPEC Workstation Performance Characterization (SPECwpc) subcommittee used IOMeter — an IO subsystem measurement and characterization tool — to simulate IO activity for a variety of professional applications. The size and frequency of storage transactions were gathered from these applications and IOMeter used the data to generate a string of storage transactions over a specified amount of time.
While this technique was better than measuring a workstation’s maximum bandwidth and latency, it still wasn’t very close to what applications actually do. With its next release, SPECwpc wanted to better mimic application behavior, while also reflecting the impact of new solid-state devices, technologies like NAND and 3D Xpoint, and various PCIe connectivity options.
In developing the SPECworkstation 3 benchmark, released in November 2018, SPECwpc used the Windows Process Monitor to trace the storage transactions from a wide variety of professional applications engaged in real work. SPECwpc then wrote a playback utility to translate the traces into streams of storage transactions that are nearly identical to those from the actual applications.
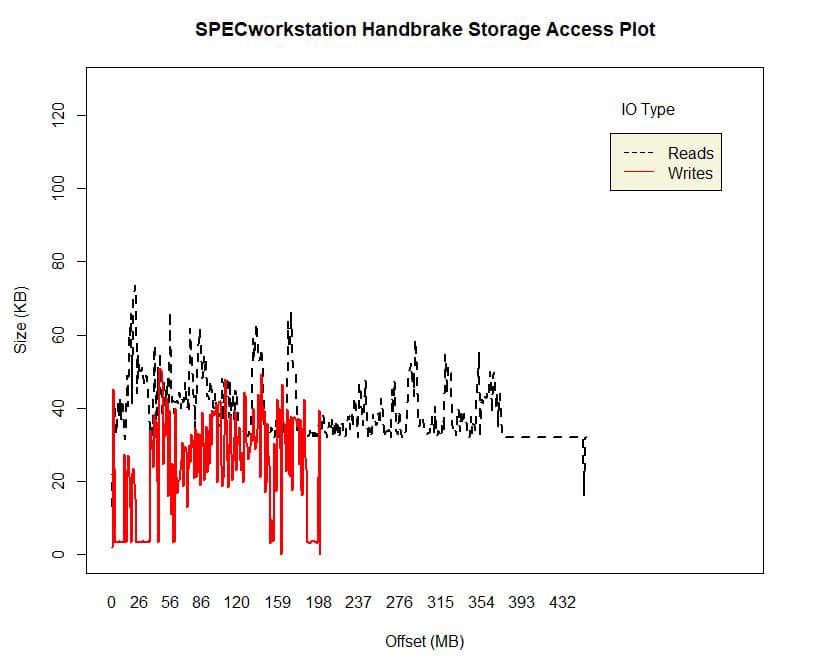
Read/writes for the SPECworkstation 3 Handbrake application
Rather than use the actual data from the applications, which would be hundreds of gigabytes in size, SPECwpc filled the storage requests with data that was selected randomly. The playback utility then uses multiple threads to write to multiple files, just like the actual application.
The SPECworkstation 3 benchmark incorporates traces from a wide variety of applications, including media and entertainment (3D animation, rendering), product development (CAD/CAM/CAE), life sciences (medical, molecular), financial services, energy (oil and gas), general operations, and GPU compute.
Applications traced for the SPECworkstation 3 storage workload include 7zip, Adobe Media Encoder, Adobe Premier Pro, Ansys Icepak, Ansys Mechanical, Autodesk 3ds Max, Autodesk Maya, Autodesk Revit, Blender, CalculiX, Dassault Systémes Solidworks, Handbrake, Lammps, Microsoft Visual Studio 2015, Namd, the SPECviewperf 13 energy viewset, and the SPECworkstation 3 WPCcfd workload.
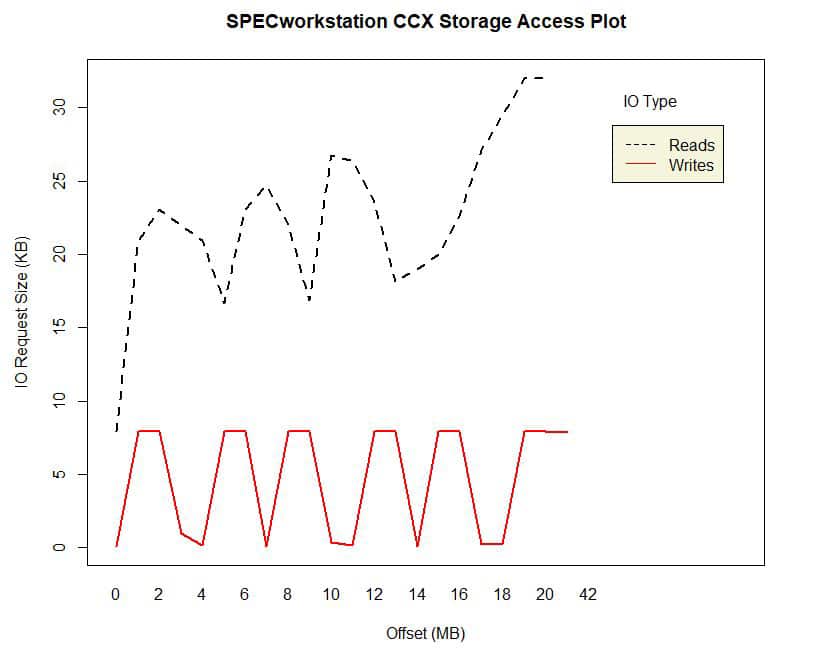
Read/writes for the Calculix (CCX) application in the SPECworkstation 3 benchmark
Looking ahead
The playback method used in SPECworkstation 3 spawns threads in a way reasonably close to the real application, but it still has a central issue: The chronology of the IOs and any synchronization across threads is not preserved accurately. This leads to cases where some threads complete certain IOs faster and the concurrency of IOPs across the various threads isn’t perfectly synchronized, resulting in occasional run-to-run variation.
For SPECworkstation 4, slated for release sometime in 2020, SPECwpc will work on preserving the IO chronology in a way that prevents IOs from coalescing when they reach the bus to the storage device.
A call for participation
While not perfect, the tracing of storage operations from real applications processing commands like those generated by workstation users in diverse industries is a major step forward.
The SPECwpc subcommittee — which includes representatives from AMD, Dell, Fujitsu, HP, Intel, Lenovo and Nvidia — welcomes input on future workloads from device vendors, application developers, and users with a stake in storage performance.
As with other SPEC benchmarks, delivering the most accurate means of capturing and reporting real-world workstation storage performance will help set a path for developers to improve their processes in the future.
– Alex Shows
Alex Shows is chair of the SPEC Workstation Performance Characterization (SPECwpc) subcommittee and a Distinguished Engineer at Dell. His 23 years of industry experience includes 19 years of software design, development and documentation; 17 years of hardware and driver design validation; and 10 years of applied research in hardware and software technologies. He holds 12 patents with six patents pending.
To find out more about graphics and workstation benchmarking, visit the SPEC/GWPG website, subscribe to the SPEC/GWPG enewsletter, or join the Graphics and Workstation Benchmarking LinkedIn group.
SPEC/GWPG benchmarks are available for free downloading to everyone except vendors of computers and related products and services that are not members of the SPEC Graphics and Workstation Performance Group (SPEC/GWPG).


 Amazon