

The Dell EMC SC9000 is Dell’s highest-performing all-flash and hybrid-storage-server solution of the SC Series, built on the legacy of the PowerEdge family and leveraging the latest Storage Center Operating System 7. During the last several months, the StorageReview Enterprise Test Lab has put the SC9000 through our application benchmark protocol to understand how it performs with real-world workloads. Our review also explores the ways that the SC9000 and SCOS 7 fit into Dell EMC’s evolving midrange storage ecosystem, which includes the SC Series and Unity products.
Looking back, our evaluation of the Compellent SC8000 two years ago found several clues about the direction that the Dell Enterprise Storage Group would be taking to arrive at the SC9000. In early 2014, Dell was making a concerted effort to pitch flash-based storage in the datacenter. Dell’s pitch wasn’t just built on the decreasing prices of flash; it was based on the company’s “Data Progression” technologies and other new functionality under the hood.
When the SC9000 was announced in 2015, it was heralded as Dell’s SC Series flagship array that would bring together Dell’s 13G PowerEdge technologies with new 12Gb SAS disk enclosures. Then in mid-2016, Dell released SCOS 7, a major update to its Storage Center Operating System. Dell not only rolled out new features like best-in-class deduplication and compression, but also introduced tight management integration between Storage Center servers and the EqualLogic PS Series.
As we were beginning our evaluation of the SC9000, Dell announced its acquisition of EMC, making Dell Technologies the world’s largest privately owned technology company. The SC9000 and Storage Center Operating System 7 may offer clues about the direction that the Dell Infrastructure Solutions Group will be moving its technology portfolio, as well as the market segments that Dell EMC may be prioritizing in 2017 and 2018.
Whatever direction the company may be going with its midrange and enterprise storage offerings, there is a lot to be optimistic about when it comes to the Dell EMC SC9000 itself, as we found out during the course of our evaluation.
Dell EMC SC9000 Specifications
- Processors: Dual 3.2GHz 8-core Intel Xeon processors per controller
- Controllers per array: 2 (active/active)
- Operating system: Dell Storage Center OS (SCOS) 6.7 or greater
- System memory: 256GB per controller (512GB total per array)
- Expansion capacity
- Min/Max Drives: 6/1024 per array, more in federated systems
- Max raw capacity (SAN): 3PB per array (SSD or HDD), more in federated systems
- Max raw capacity (NAS):
- 3PB per array with optional FS8600
- 6PB in single namespace (with FS8600 and multiple SC9000 arrays)
- Storage media
- Architecture: SAS and NL-SAS drives; different drive types, transfer rates and rotational speeds can be mixed in the same system
- SSDs: write-intensive, read-intensive
- HDDs: 15K, 10K, 7.2K RPM
- Expansion enclosures
- SC420 (24 2.5” drive slots, 12Gb SAS)
- SC400 (12 3.5” drive slots, 12Gb SAS)
- SC280 (84 3.5” drive slots, 6Gb SAS)
- SC220 (24 2.5” drive slots, 6Gb SAS)
- SC200 (12 3.5” drive slots, 6Gb SAS)
- Network and expansion I/O
- PCIe3 slots: 7 per controller, 4 full-height (cache card consumes one) and 3 low-profile
- Any slot may be used for either front-end network or back-end expansion capacity connections
- Front-end network protocols: FC, iSCSI, FCoE (supports simultaneous multiprotocol)
- Max 16Gb FC ports: 32 per array (SFP+)5
- Max 8Gb/4Gb FC ports: 24 per array (SFP+)5
- Max 10Gb iSCSI ports: 20 per array (SFP+ optical or copper card, BASE-T, iSCSI DCB, IPv6)
- Max 1Gb iSCSI ports: 20 per array (BASE-T)
- Max 10Gb FCoE ports: 12 per array (SFP+ optical or copper card, BASE-T)
- Back-end expansion protocols: 12Gb SAS (auto-negotiates to 6Gb)
- Max back-end expansion ports: 32 per array
- Array configurations: All-flash, hybrid or HDD arrays
- Storage format: Block (SAN) and/or file (NAS) from same pool
- Data optimization
- Auto-tiering method: Policy-based migration based on real-time data usage, customizable 512KB-4MB page size
- Auto-tiering structure: Up to 3 primary (media-based) tiers total, up to 2 SSD tiers (write- and read-intensive SSDs)
- Tiering customizations: Default and user-defined profiles, option to “pin” volumes to any tier
- RAID support: RAID 0, 1, 5, 6, RAID 10, and RAID 10 DM (dual mirror); any combination of RAID levels can exist on a single array
- RAID tiering: Auto-provisions and dynamically restripes multiple RAID levels on the same tier; no need to pre-allocate RAID groups
- Thin provisioning: Active by default on all volumes, operates at full performance across all features
- Deduplication and compression: Selectable option per volume on SSD and/or HDD tiers; compression-only option also available
- HDD optimization: FastTrack moves frequently accessed data to outer tracks for quicker response times
- Physical
- Power supplies: Dual, redundant 1100W 80 PLUS Platinum certified power supplies
- Max power: 425W
- Inlet type: NEMA 5-15/CS22.2, n°42
- Height: 2U/87.3 mm (3.44 inch)
- Width: 482.4 mm (18.98 inch) with rack latches; 444 mm (17.08 inch) without rack latches
- Depth: 755.8 mm (29.75 inch) with bezel
- Weight: 19.73 kg (43.5 lb)
- ReadyRails II static rails for tool-less mounting in 4-post racks with square or unthreaded round holes or tooled mounting in 4-post threaded-hole racks
- Environmental
- Operating temperature: Operating: 41°F to 104°F (5°C to 40°C)
- Non-operating temperature: -40°F to 149°F (-40°C to 65°C)
- Operating humidity: 10% to 80% (non-condensing)
- Non-operating humidity: 5% to 95% (non-condensing)
- Services: Dell Copilot support with deployment and consulting services; Dell Copilot Optimize available for additional ongoing strategic counsel and guidance from a highly trained system analyst
- Diagnostics engine: Integrated Dell Remote Access Controller (iDRAC)
- System sizing: Dell Performance Analysis Collection Kit (DPACK) tool
- Drive warranty: All SSDs and HDDs are warrantied for full lifetime wear-out replacement with valid service agreement
Build and Design
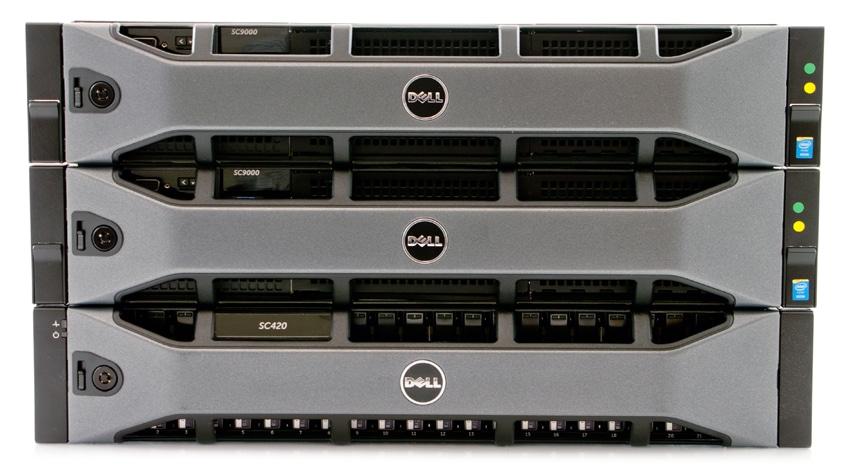
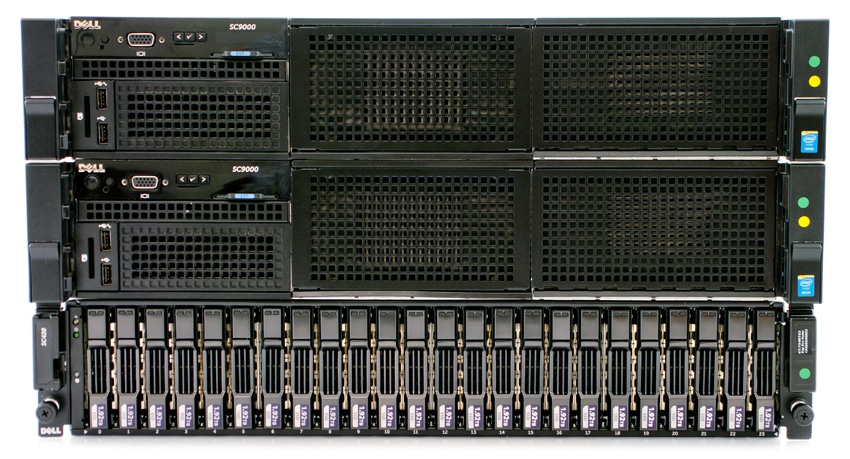
The Dell EMC SC9000 is a 6U device encompassing two 2U controllers and at least one 2U storage shelf. What’s a bit surprising here are the two separate 2U units for controllers, as many modern servers can fit 2 controllers in one 2U unit or find another method in which to place them. On the front of the device and beneath the bezel, the right-hand side to middle of the device is covered with filler plates that cover empty bays. The left-hand side hosts all of the controls including the power indication/button, NMI button, System ID button, video connector, information tag, vFlash memory card slot, iDRAC USB port, Management USB port, and LCD screen and buttons for system ID, status, and errors.
Moving around to the back of the device, the top part is mainly filed with IO card slots, and the basic connections run across the bottom. The bottom right has two power supply units with fans, and a Cache card above them. Moving to the left are 4 Ethernet connectors, 2 USB ports, video and serial connectors, iDRAC8 port, system ID connector, and system ID button. On our build, we have populated the IO slots with two 10GbE dual-port cards and two 16GbE dual-port cards.
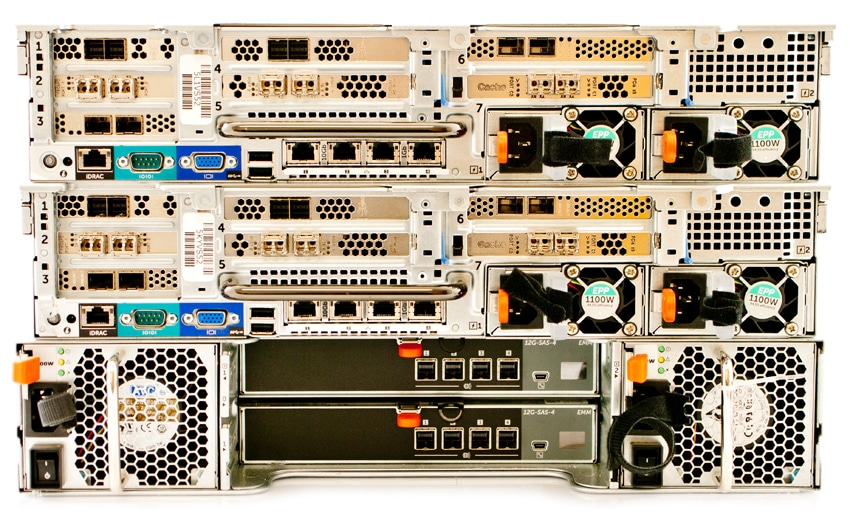
The Dell EMC SC9000 also supports a variety of storage or expansion shelves. In our case, we are using the SC420. The SC420 has 24 2.5” bays and supports both HDD and SSD SAS drives. The 24 drive bays take up a bulk of the front of the device with power, status, and ID button on the left-hand side. The rear of the device has PSUs on both sides with fans and power switches located there as well. The middle has two enclosure management modules, one stacked on the other.
Overview of SCOS 7
Dell’s Storage Center Operating System (SCOS) 7 is the OS and software stack that runs directly on Storage Center controllers. However, as of SCOS 7, it is no longer a management interface itself. The distinction between operating system and management tool is significant due to the advent of Dell Storage Manager (DSM) that unifies management of the SC Series and Dell’s EqualLogic PS family of systems. In other words, SCOS 7 provides the underlying hooks for management and functionality of the SC9000, which DSM uses to provide an administrative interface.
One of our key findings about SCOS 7 is the superiority of Dell’s latest deduplication and compression technology in terms of performance. While deduplication has become more and more common among storage systems from many vendors, the way that deduplication is implemented makes a difference. Dell has employed a schedule-based deduplication process, which avoids the performance hit that we usually see from solutions that use inline deduplication. With the SC9000’s schedule-based processing, the data stream is being written directly to the fastest available storage.
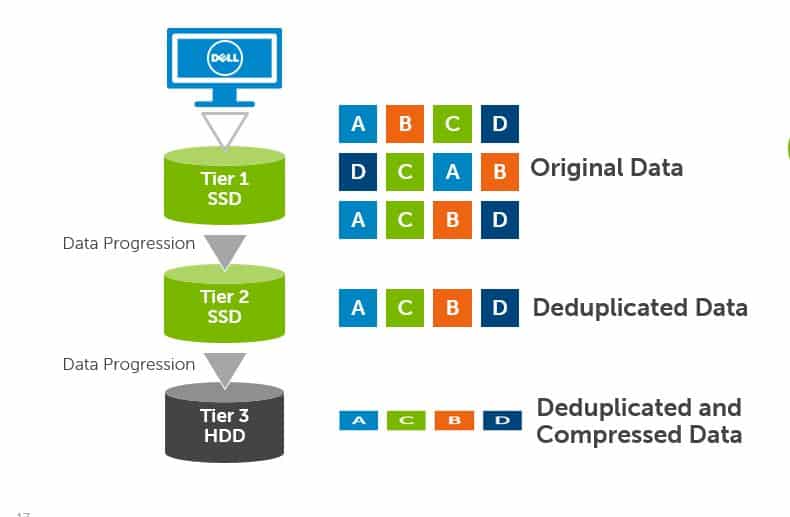
By default, when data first is written to the SC9000, it is placed in the fastest tier of flash storage in a RAID 10 array while it awaits deduplication, compression, and automated tiering. After dedupe and compression, Dell’s Data Progression keeps hot data on this fastest tier until it cools and is migrated to RAID 5/6 for long-term access. The downside to this approach compared to inline dedupe and compression is that all data hits storage in its full, unoptimized size. That means that the fastest tier of storage must have enough capacity to handle the incoming data until the next scheduled round of deduplication, compression, and tiering.
With the Dell EMC SC9000 and SCOS 7, deduplication and compression are now configurable at the sub-LUN level. For example, administrators may designate specific volumes to only be processed by the compression algorithm. SCOS 7 could also be configured to disable dedupe and compression for everything except inactive data that has been stored in snapshots.
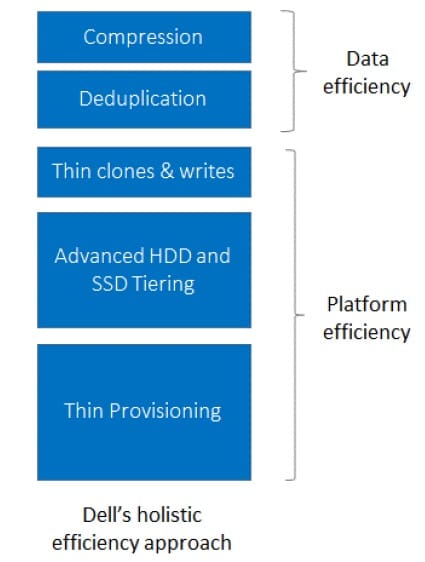
Deduplication and compression may be the headlines for the SCOS 7 update, but data efficiency underpins the entire architecture. This means that the SC9000 can take advantage of thin clones and writes, thin provisioning, and tools like “Remote Instant Replay,” which applies the concept of thin provisioning to disaster recovery in order to provide thin replication.
One of the fruits of Dell’s decision to consolidate the SC family with the EqualLogic PS family is the new availability of VMware Virtual Volumes (VVol) for the SC9000, a feature that has been brought over from the PS Series side. VVols is a scheme that makes SCOS 7 controllers virtual machine aware in order to optimize performance for VMs. This means that administrators can configure SCOS 7 services on a per-VM basis as well as per-volume.
Dell’s SCOS 7 also incorporates new volume-based QoS features, which allow administrators to throttle down “noisy-neighbor volumes” with demanding I/O requirements so that these volumes can better, co-exist in shared storage environments.
In addition, SCOS 7 introduces Dell’s Live Migrate technology, meaning that multi-array federation is part of the operating system that runs directly on the SC9000. Live Migration allows SC9000, SC8000 and SC4020 administrators to relocate volumes from one array to another via Dell Storage Manager, without taking the volumes offline or requiring additional hardware and software. Similarly, Dell’s Live Volume technology provides transparent auto-failover to standby volumes on another array for disaster recovery scenarios. This approach means that applications can continue execution during outages without any specialized virtualization hardware or software.
Management
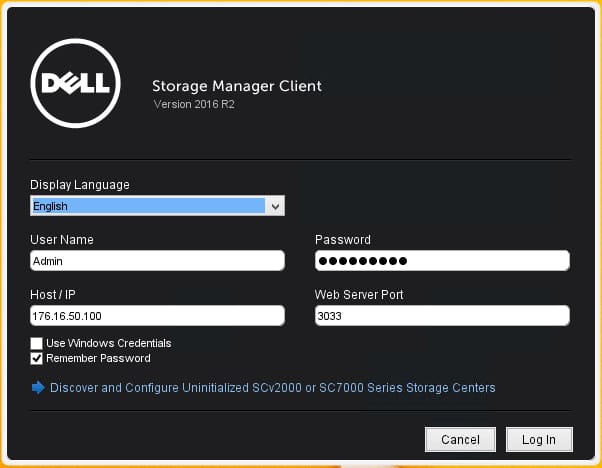
The Dell EMC SC9000 is managed using Dell EMC’s standalone Storage Manager Client. The version tested here is the 2016 R2 version. When first launching the Storage Manager Client, you are presented with a Login screen asking for a username/password, IP address/Hostname, and port to which to connect. Clicking “Log In” connects to Dell EMC Storage Manager and allows you to manage your systems.
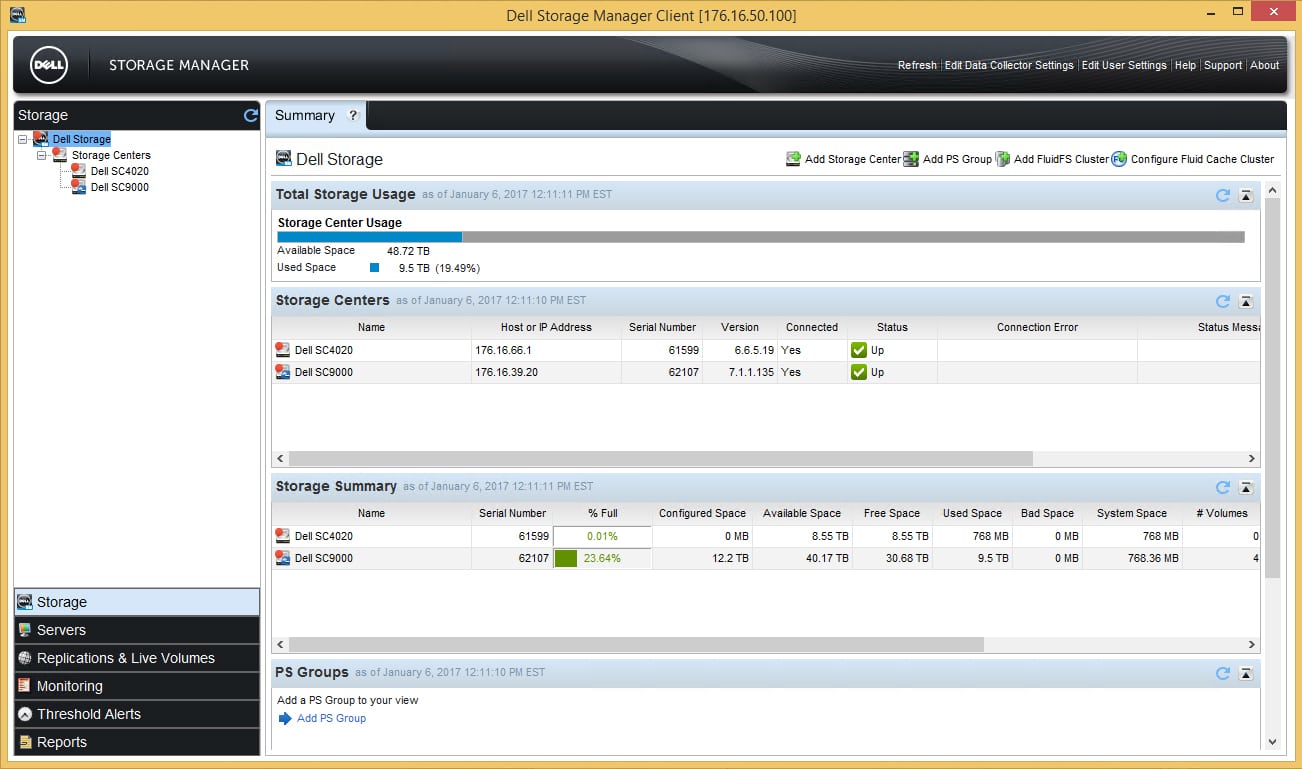
The first page presented is a summary screen with all Storage Center systems connected to the Storage Manager system. It gives a brief summary of the storage systems, IP addresses, Versions, and Status, as well as capacities for the systems under management.
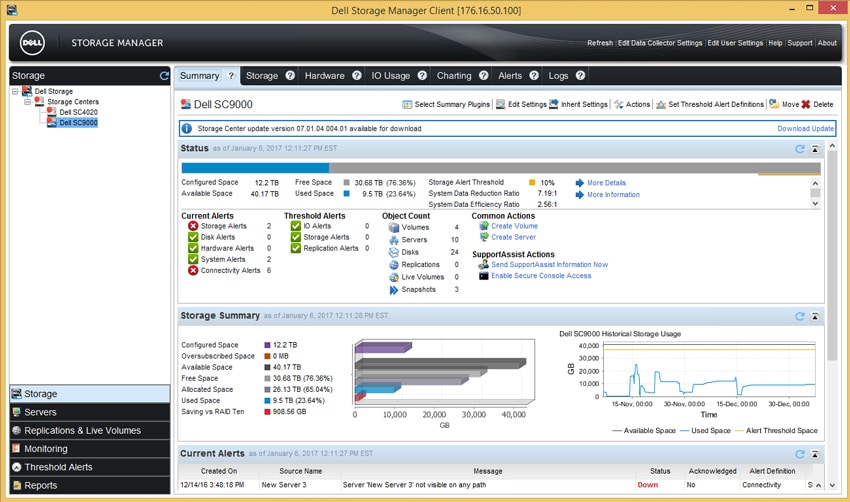
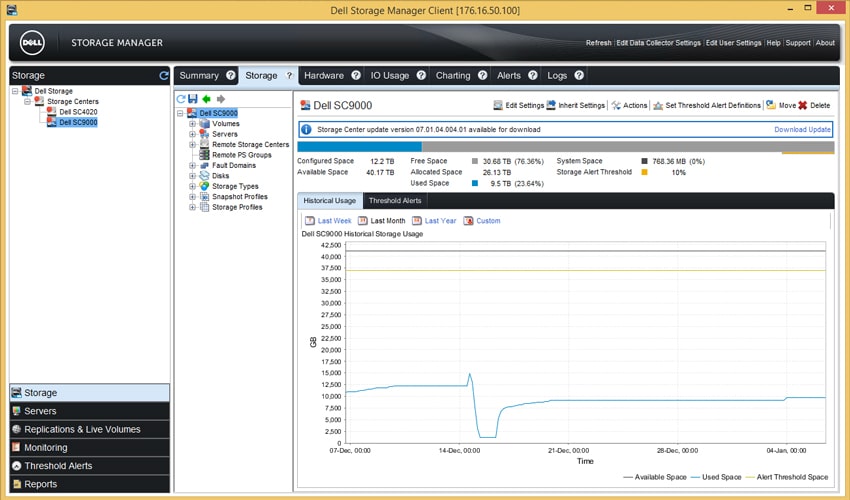
Drilling in to a system gives you a multitude of tabs that detail System Summary, Storage, Hardware, IO Usage, Charting, Alerts and Logs. The first tab presented is an overall summary giving information about Configured Space, Free Space, and many different Alerts that could be triggered by the system.
Selecting the “Storage” tab gets into the guts of the system where configuration of Volumes, Servers, Remote Storage Centers, Remote PS groups, Fault Domains, Disks, Storage Types, Snapshot Profiles, and Storage Profiles are displayed. Each of these will be detailed in the coming sections.
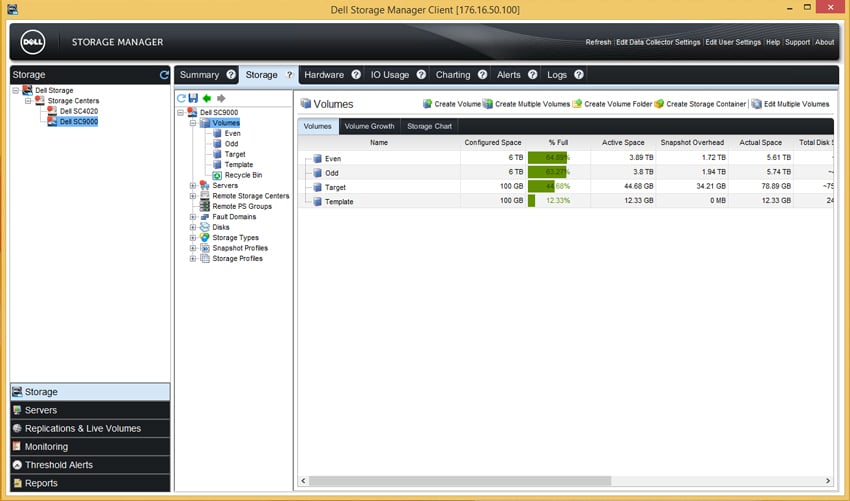
The Volumes section shows the volumes that have been configured in the system. It shows capacities of those volumes, usage of those volumes, Active (used) space, Snapshot overhead, Actual Space, and a multitude of other statistics for the volumes. This is also the area where you will create volumes and manage volume hierarchy.
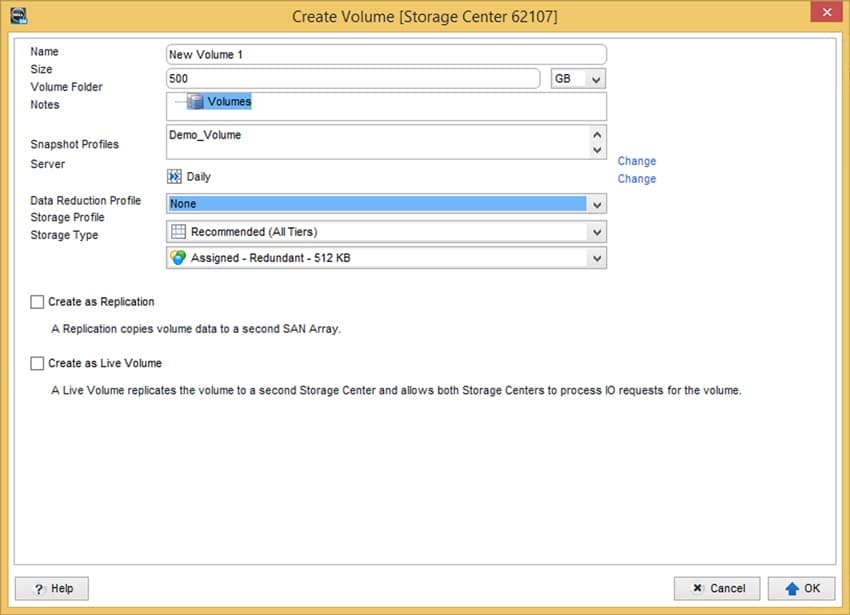
Clicking the “Create Volume” link launches the Create Volume wizard, which allows you to name your volume, select a size for the volume, select a snapshot profile, assign it to a server, and set different profiles for the volume. Data reduction capabilities (Compression or Compression and Deduplication) leverages software-based data reduction to enhance the capacity of the system. Storage Profile and Storage Type select the type of disk and parity that is used for the backend of the system.
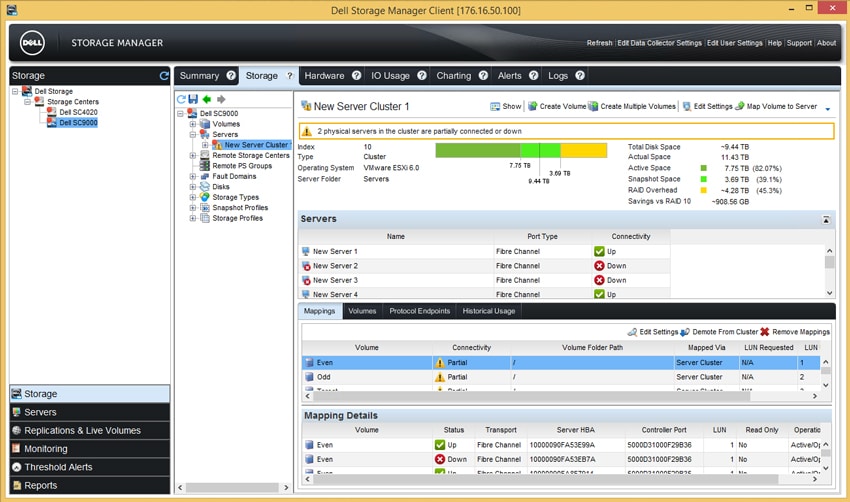
Selecting the Servers drill-down shows you the servers, server clusters, and the disk assignments for those systems. This is the area that would be considered the “mapping and masking” part of the system.
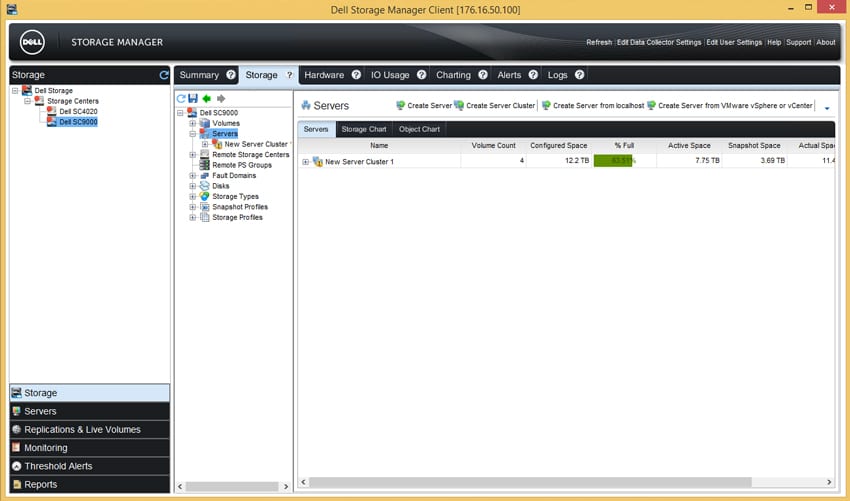
Selecting the Server Cluster shows the servers that are participating in the server cluster, space information, and most importantly, LUN IDs and HBA information. Selecting a LUN from the list and right clicking brings up options to edit the LUN and allows modification of the LUN ID assignment.
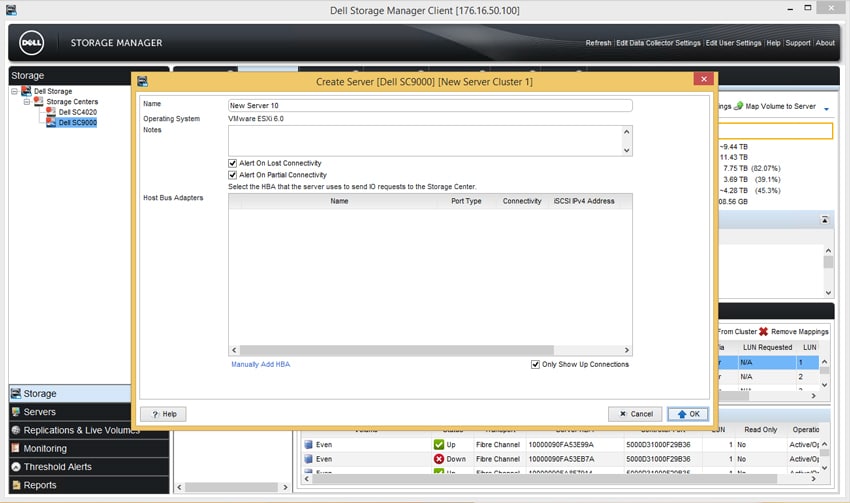
Going back to the main Servers area and clicking on “Create Server” allows creation of a new server and assignment of the HBAs that are on that server. This list would be populated with unused servers that have registered with the system that have not been assigned as of yet.
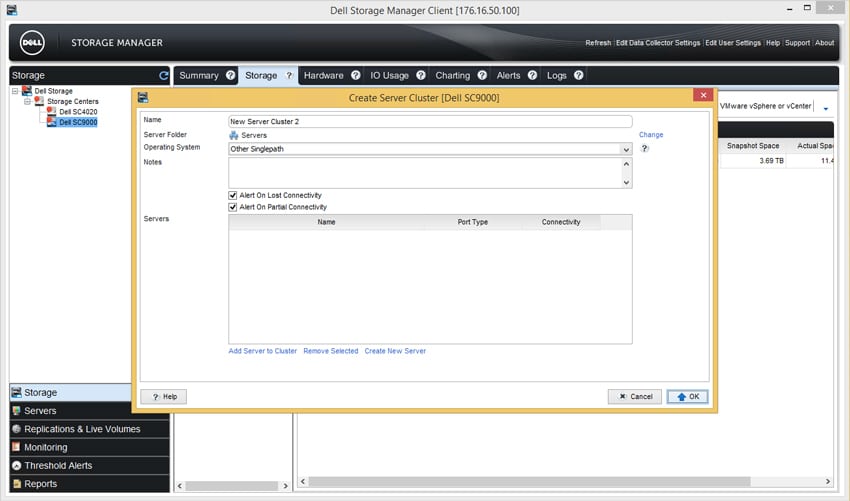
Clicking on the “Create Server Cluster” allows creation of a cluster of systems that will share the same LUNs from the system. There are options to Add Server to Cluster, Remove Selected, and Create New Server, allowing the population of systems that will access single or multiple LUNs.
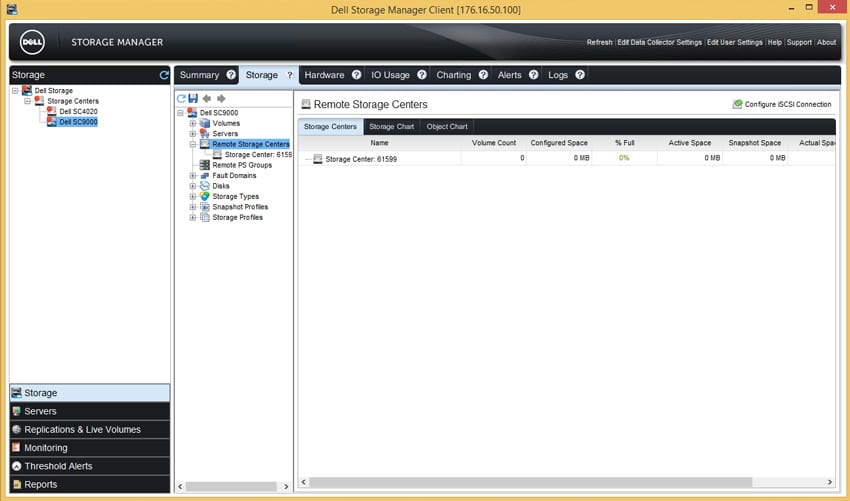
The Remote Storage Centers menu allows users to see multiple different Storage Centers that are connected to the system for replication. This is all configured via iSCSI. As there are no remote systems being replicated to, this screen is currently blank.
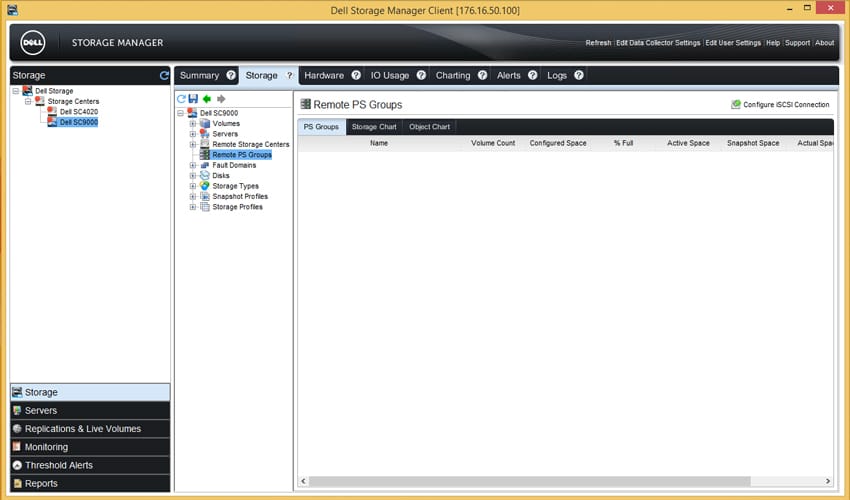
The Remote PS Groups menu shows remote PS Series arrays that are configured for replication, again configured via iSCSI. As with the Remote Storage Centers menu, since there are none configured, there are none to show here.
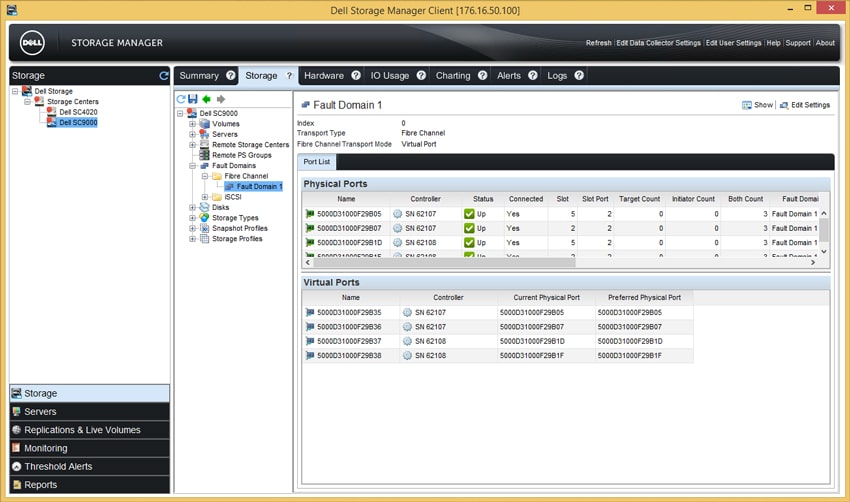
The Fault Domains menu shows the front-end ports and the failover mechanisms assigned to them. The number of fault domains configured will directly reflect the number of fabrics configured in the environment. Given a single storage fabric, there will be one fault domain. If an HBA, Port, SFP, or switch fails and the WWN (or IQN in iSCSI configurations) can be transferred to another physical interface, those connections will be moved to another available interface. More information can be found in the Dell configuration guides about how Fault Domains work and how they should be configured.
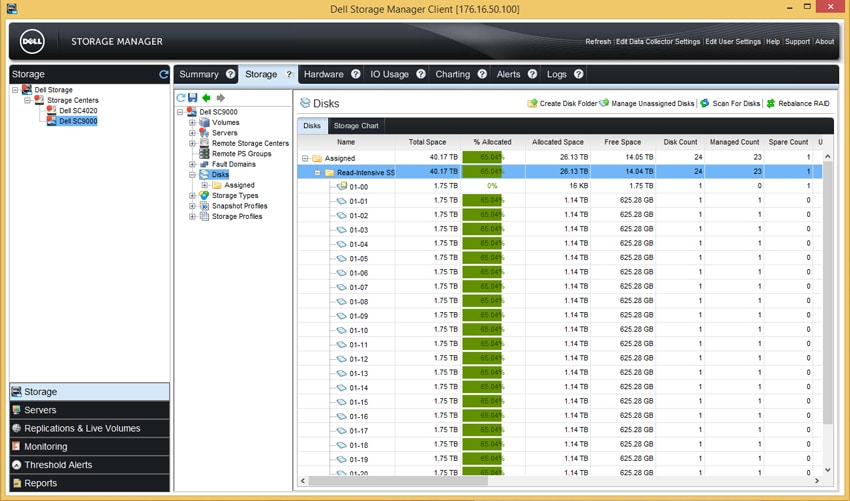
The Disks menu displays the disks in the system and all associated information of those disks. This is where management of disk resiliency is also configured. As configured, the disks are in a “redundant” state, meaning one parity bit (RAID5) or one mirror bit (RAID10) is configured. Double redundancy can be configured, which would be a RAID6 configuration.
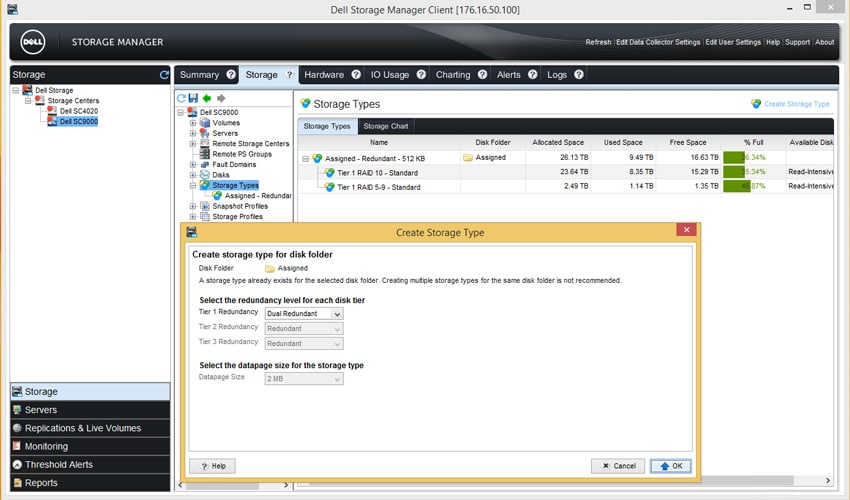
On the Storage Types tab is where different types of data protection can be configured. The system under test has RAID10 and RAID5-9 configured as it stands, and shows where the capacity is allocated. Clicking on the “Create Storage Type” link allows creation of another class of storage that has double parity enabled, protecting from double-disk failure.
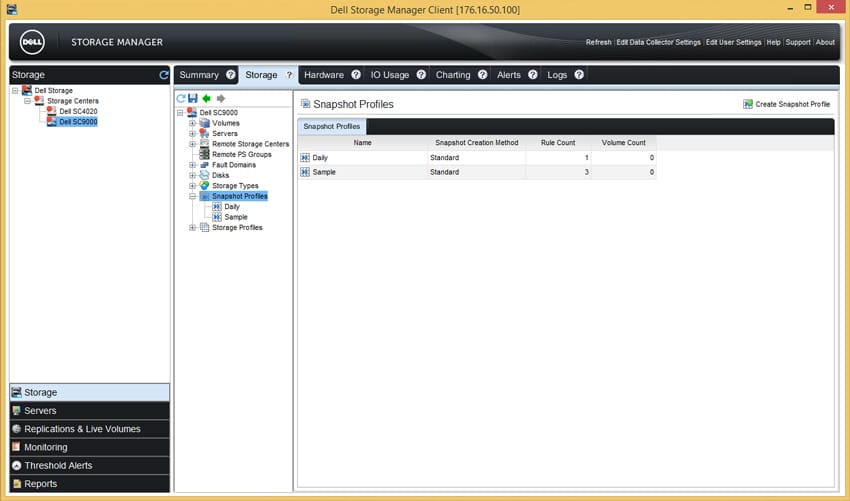
Snapshot Profiles is where configuration of all snapshot rules is managed. This allows for setting different policies that can be applied to any LUN in the system to create a snapshot regime for quick disaster recovery.
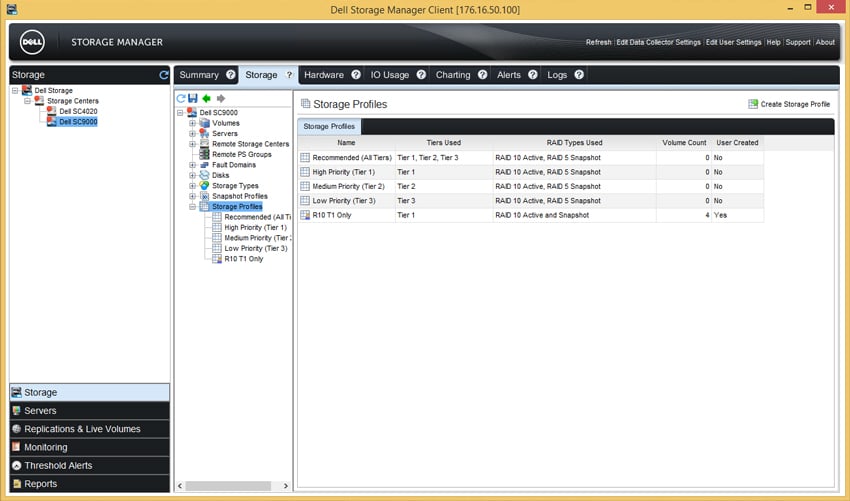
The final menu under the Storage heading is the Storage Profiles tab. This allows configuration of how a tier is allocated on the system. Default tiers that are specified are Recommended, High Priority, Medium Priority, and Low Priority. On the system under test, there has been another profile created that specifies that all data live on RAID10 rather than pushing snapshots to a lower RAID level (RAID 5).
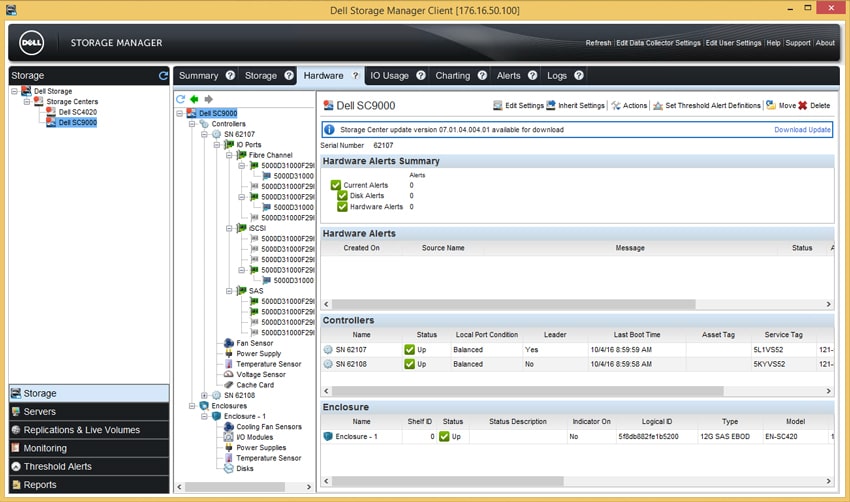
Moving over to the Hardware tab, there is a full breakdown of all controllers and their associated hardware. This shows the status of FC ports, iSCSI ports, SAS ports, Cache, Fans, PSUs, Disks, and voltages of the system. This is also where alarms/alerts are configured to notify if there is an issue with any of the hardware.
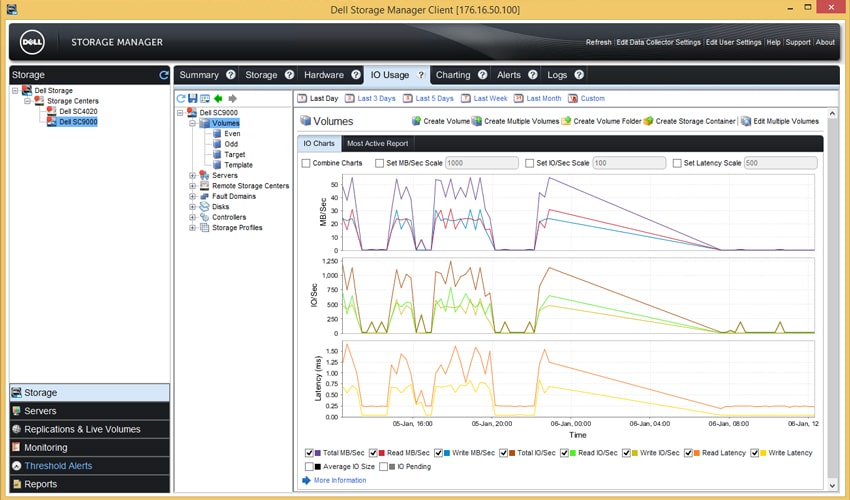
The IO Usage tab shows the performance of the system as an aggregate, or gives the ability to drill down into each volume (or server, or other component) individually to report on a per-component performance value.
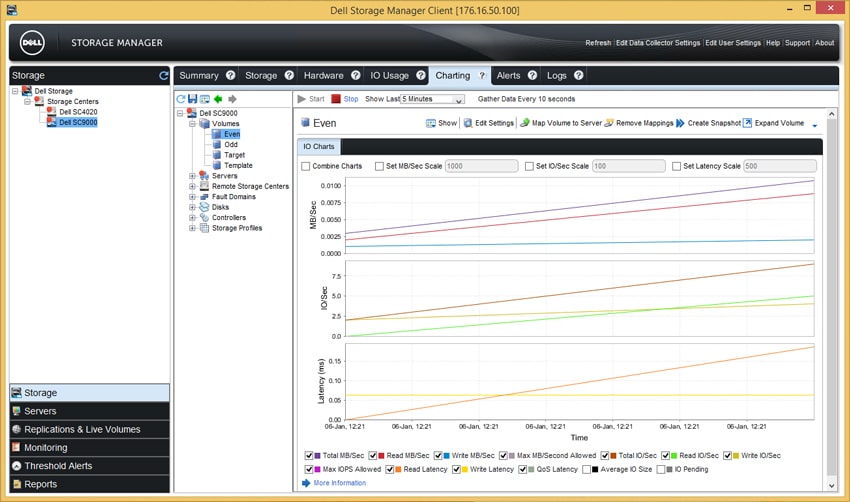
The Charting tab provides similar information to the IO Usage tab, but allows more granular selection of metrics. It also allows more real-time collection of data (showing as granular as the last 5 minutes, in 10 second intervals) vs. the IO Usage tab, which has the smallest display range of one day.
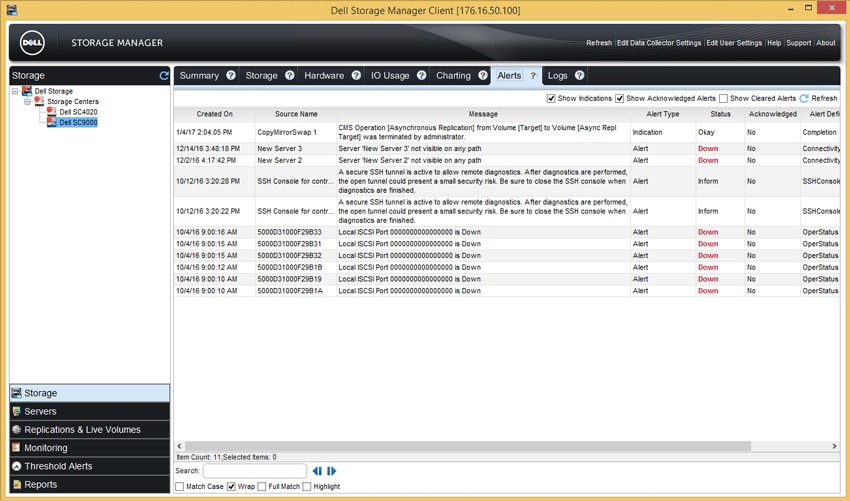
The Alerts tab shows any alerts on the system that could cause unavailability. This includes initiators that are offline, disk failures, hardware failures and security warnings. This is a valuable place to look for information if there are any issues with the system.
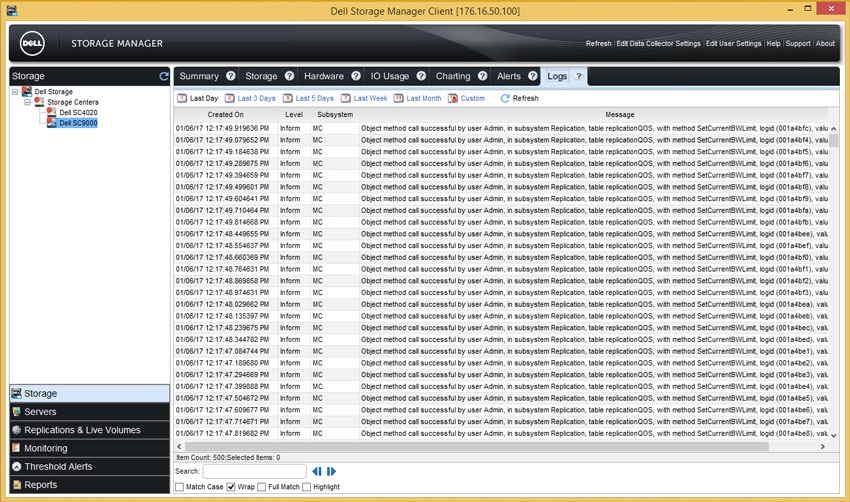
The Logs tab is simply the log of all events on the system. This will include user logins, configuration changes and things of that nature.
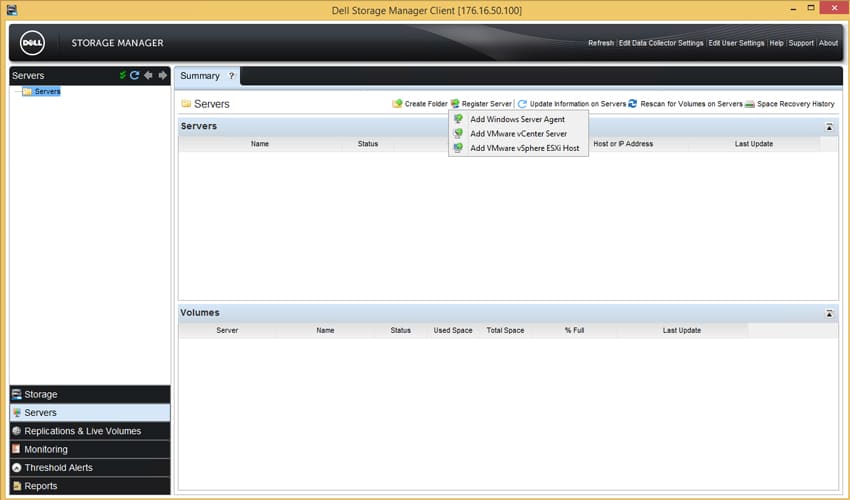
The Servers submenu shows servers that have been registered with Dell EMC Storage Manager. This allows monitoring and management of systems (Windows, vCenter, ESXi) that are associated with Storage Manager.
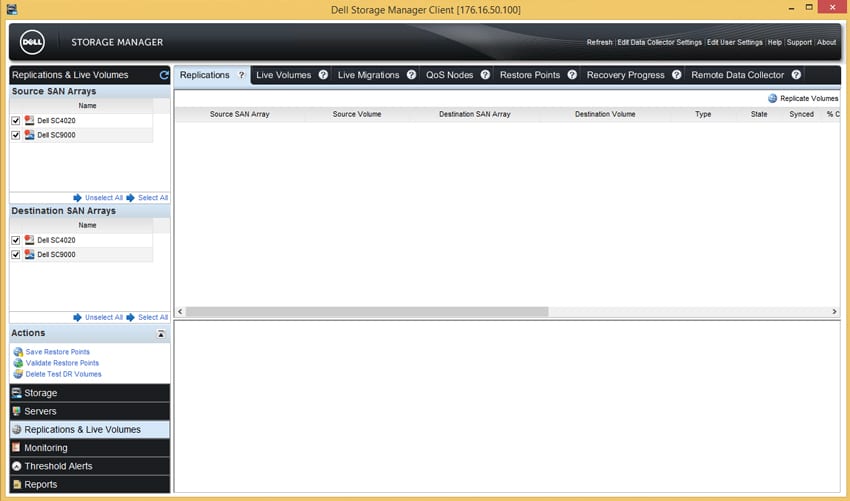
The Replications & Live Volumes submenu shows the active data replications that are running on the system. This is where monitoring and management of any replications would happen.
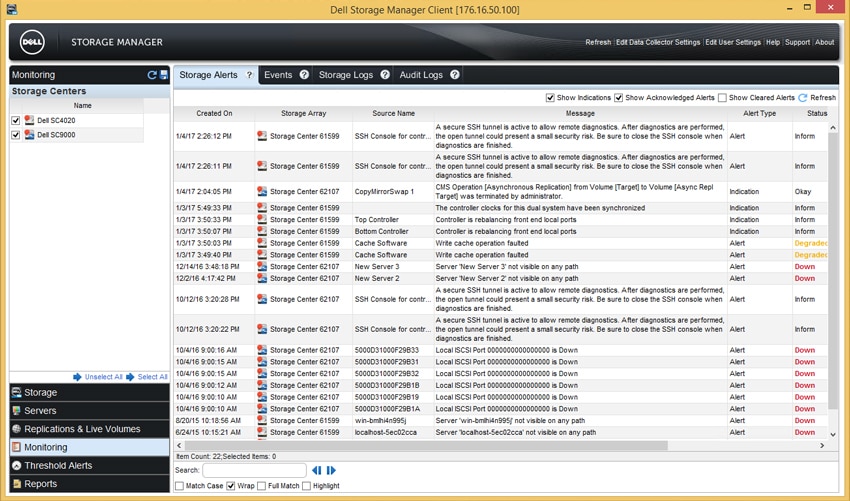
The Monitoring submenu shows everything from events and alerts. Anything that happens on the system will show up in one of the tabs in this section and makes it a great place to look for anything out-of-the-ordinary if the system is having any sort of problems.
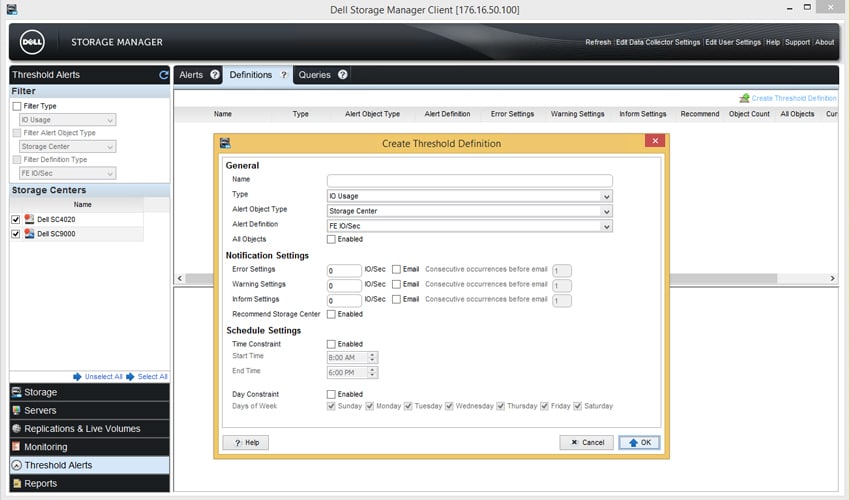
The Threshold Alerts submenu is where thresholds can be configured for alerts and alarms. This allows for configuration of values to define when alarms and alerts are triggered. There are options to set time of day, object types, and the definition of that object type to trigger the alarm.
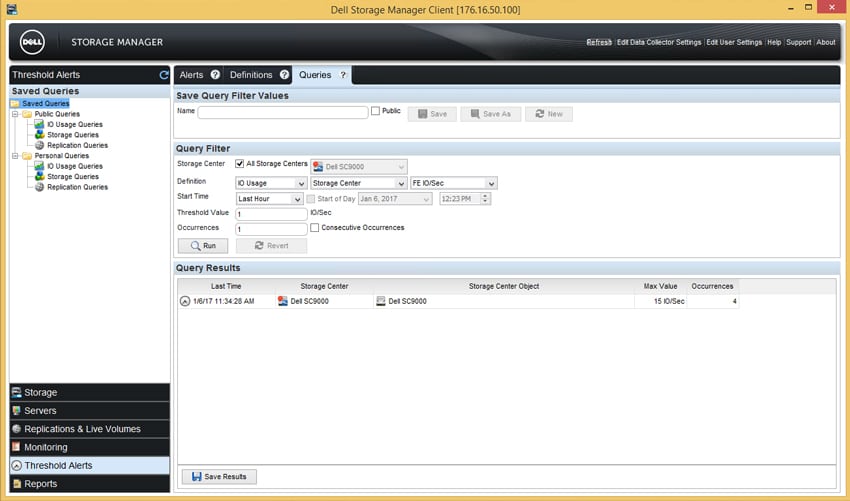
Selecting the Queries tab allows interactive polling of the system to see where thresholds sit during normal usage. This will assist in setting values for alerting and alarming on values that are outside of normal operational parameters.
The final submenu is the Reports submenu. By default, there are no automated reports configured, but turning them on is as simple as selecting “Edit Automated Report Settings.” Once enabled, this should push reports based on the configured selections and allow long-term collection of report data for forecasting.
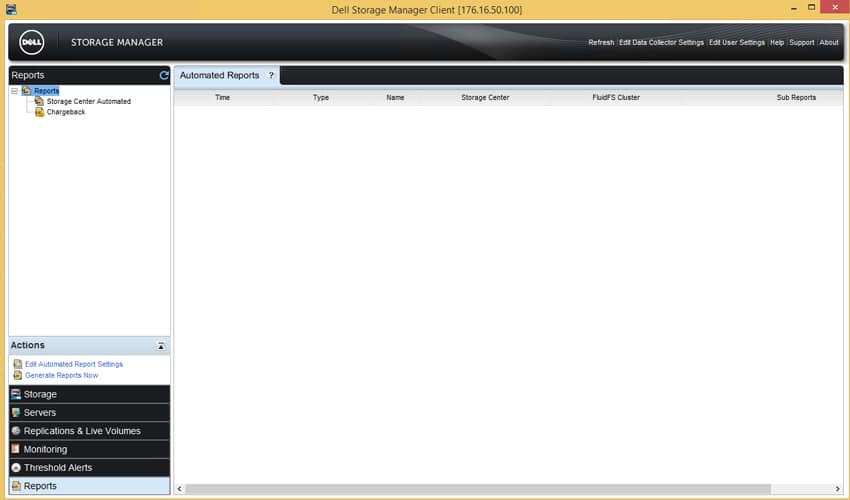
Overall the interface is functional, but dated. It is surprising to still see a fat client as the primary management interface for configuring the system. Many competitors are running full HTML5 interfaces to manage their arrays. Dell EMC Enterprise Storage Manager relies on a Virtual Machine that has had some stability issues in our testing. Enterprise Storage admins may find it cumbersome and unintuitive to perform tasks that have been streamlined by products such as the EMC VNX and NetApp FAS devices.
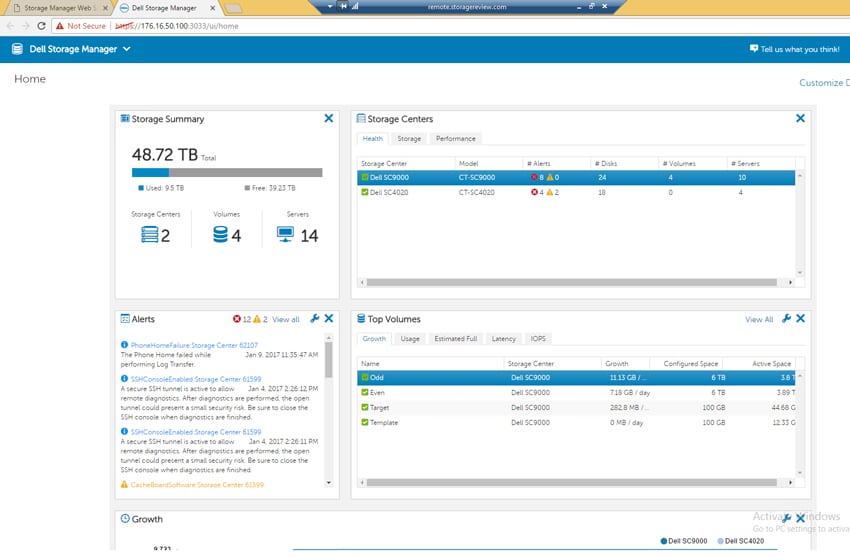
Dell EMC Storage Manager also has a new Web UI available. While not the focus of this review, it is a large improvement in visual usability over the fat client. It does still suffer from some of the naming convention issues that the fat client suffers from (Mapping and Masking is not specifically called out, but rather labeled “Servers”) and managing mapped volumes is not as simple as on other vendors’ systems. It also does not support Hardware management, Replications and Live Volumes, and FluidFS clusters, and as such, it cannot be seen as the sole management point for the SC9000 or Dell Enterprise Storage Manager. That being said, the visual improvements of the interface indicate that Dell EMC is working on improving the usability of the system. If those additional tasks could be implemented in the Web UI, it would be a welcome change from the fat client.
Application Workload Analysis
The first benchmarks consist of the MySQL OLTP performance via SysBench and Microsoft SQL Server OLTP performance with a simulated TPC-C workload.
SQL Server Performance
Each SQL Server VM is configured with two vDisks: 100GB volume for boot and a 500GB volume for the database and log files. From a system resource perspective, we configured each VM with 16 vCPUs, 64GB of DRAM and leveraged the LSI Logic SAS SCSI controller. While our Sysbench workloads tested previously saturated the platform in both storage I/O and capacity, the SQL test is looking for latency performance.
This test uses SQL Server 2014 running on Windows Server 2012 R2 guest VMs, being stressed by Dell’s Benchmark Factory for Databases. While our traditional usage of this benchmark has been to test large 3,000-scale databases on local or shared storage, in this iteration we focus on spreading out four 1,500-scale databases evenly across the SC9000 (two VMs per controller).
SQL Server Testing Configuration (per VM)
- Windows Server 2012 R2
- Storage Footprint: 600GB allocated, 500GB used
- SQL Server 2014
- Database Size: 1,500 scale
- Virtual Client Load: 15,000
- RAM Buffer: 48GB
- Test Length: 3 hours
- 2.5 hours preconditioning
- 30 minutes sample period
SQL Server OLTP Benchmark Factory LoadGen Equipment
- Dell PowerEdge R730 Virtualized SQL 4-node Cluster
- Eight Intel E5-2690 v3 CPUs for 249GHz in cluster (Two per node, 2.6GHz, 12-cores, 30MB Cache)
- 1TB RAM (256GB per node, 16GB x 16 DDR4, 128GB per CPU)
- SD Card Boot (Lexar 16GB)
- 4 x Mellanox ConnectX-3 InfiniBand Adapter (vSwitch for vMotion and VM network)
- 4 x Emulex 16GB dual-port FC HBA
- 4 x Emulex 10GbE dual-port NIC
- VMware ESXi vSphere 6.0 / Enterprise Plus 8-CPU
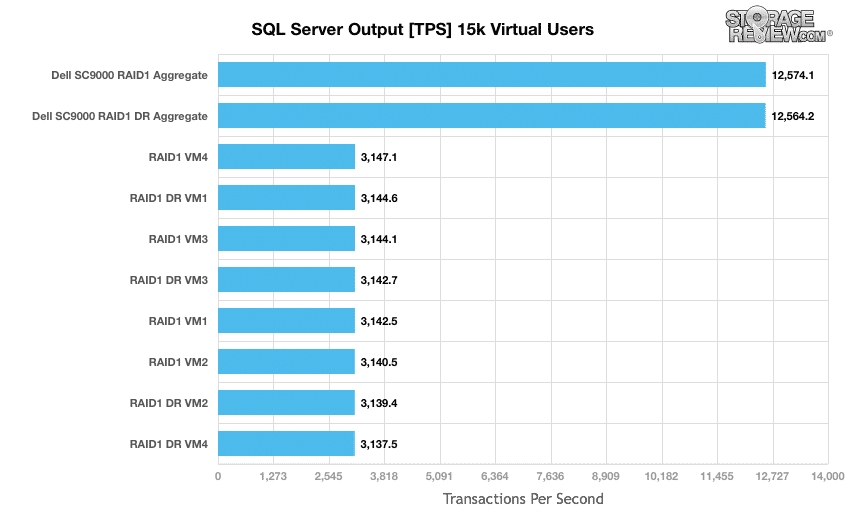
Looking at transactional performance of the Dell EMC SC9000 in our SQL Server test, we don’t see a significant impact from enabling full data reduction on the array.
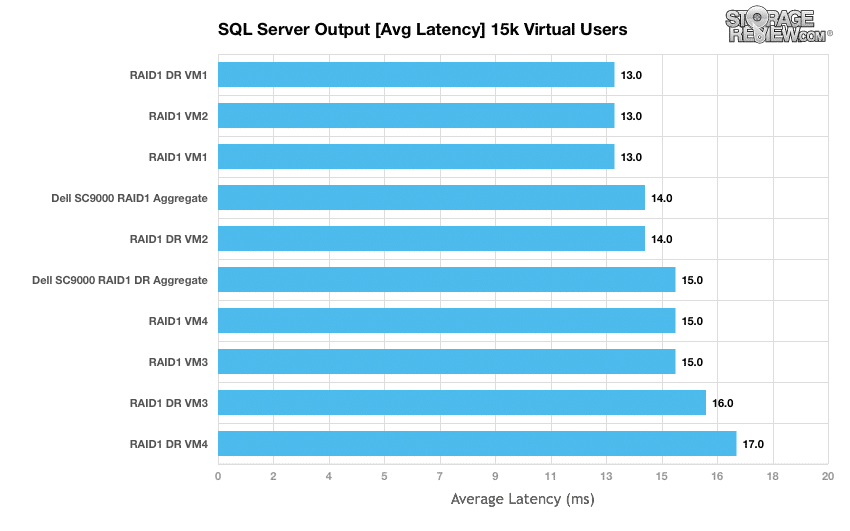
While our transactional performance metric didn’t show much change between the Raw and DR SC9000 results, we do see some subtle differences looking at latency measurements. Aggregate performance for the raw storage averaged out at 14ms, while performance with DR enabled came in at 14ms. This is easily the smallest incremental difference added by data reduction that we’ve seen on a storage array thus far.
Sysbench Performance
Each Sysbench VM is configured with three vDisks, one for boot (~92GB), one with the pre-built database (~447GB) and the third for the database under test (270GB). From a system resource perspective, we configured each VM with 16 vCPUs, 60GB of DRAM and leveraged the LSI Logic SAS SCSI controller. Load gen systems are Dell R730 servers; we range from four to eight in this review, scaling servers per 4VM group.
Dell PowerEdge R730 Virtualized MySQL 4-8 node Cluster
- Eight-sixteen Intel E5-2690 v3 CPUs for 249GHz in cluster (Two per node, 2.6GHz, 12-cores, 30MB Cache)
- 1-2TB RAM (256GB per node, 16GB x 16 DDR4, 128GB per CPU)
- SD Card Boot (Lexar 16GB)
- 4-8 x Mellanox ConnectX-3 InfiniBand Adapter (vSwitch for vMotion and VM network)
- 4-8 x Emulex 16GB dual-port FC HBA
- 4-8 x Emulex 10GbE dual-port NIC
- VMware ESXi vSphere 6.0 / Enterprise Plus 8-CPU
Sysbench Testing Configuration (per VM)
- CentOS 6.3 64-bit
- Storage Footprint: 1TB, 800GB used
- Percona XtraDB 5.5.30-rel30.1
- Database Tables: 100
- Database Size: 10,000,000
- Database Threads: 32
- RAM Buffer: 24GB
- Test Length: 3 hours
- 2 hours preconditioning 32 threads
- 1 hour 32 threads
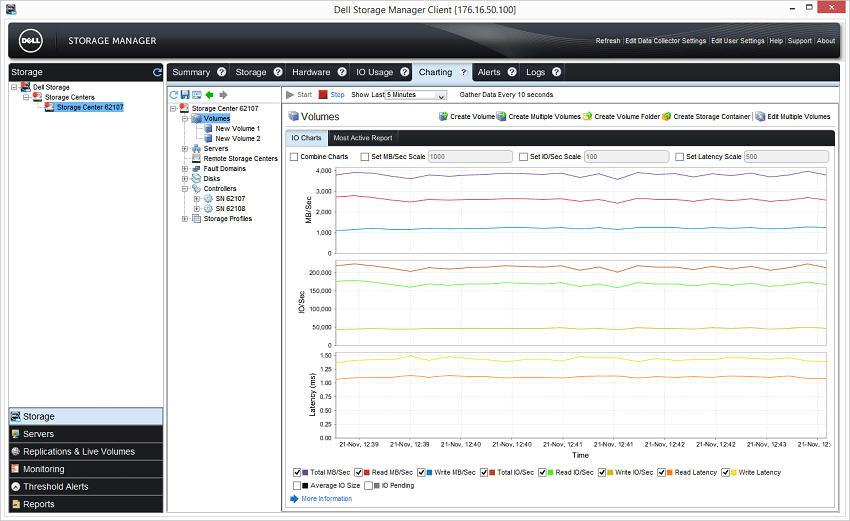
Below is a screenshot of our Sysbench test at a load of 32VMs running on the SC9000 as seen by Dell Storage Manager. In total across both volumes (one per controller), we measured an aggregate bandwidth of around 4GB/s read/write, and just over 200k IOPs R/W.
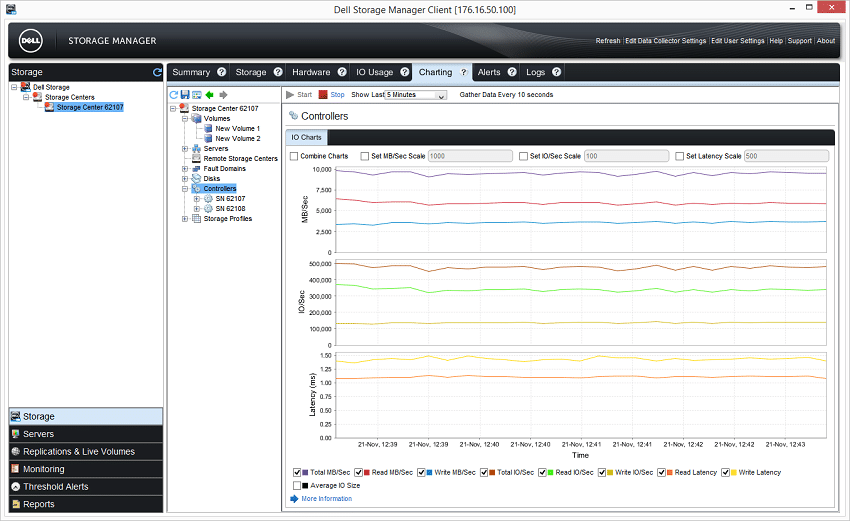
Switching that view to the controllers themselves (which see double the work factoring in RAID parity overhead), that load jumped to around 10GB/s combined, pushing around 500k IOPS mixed R/W.
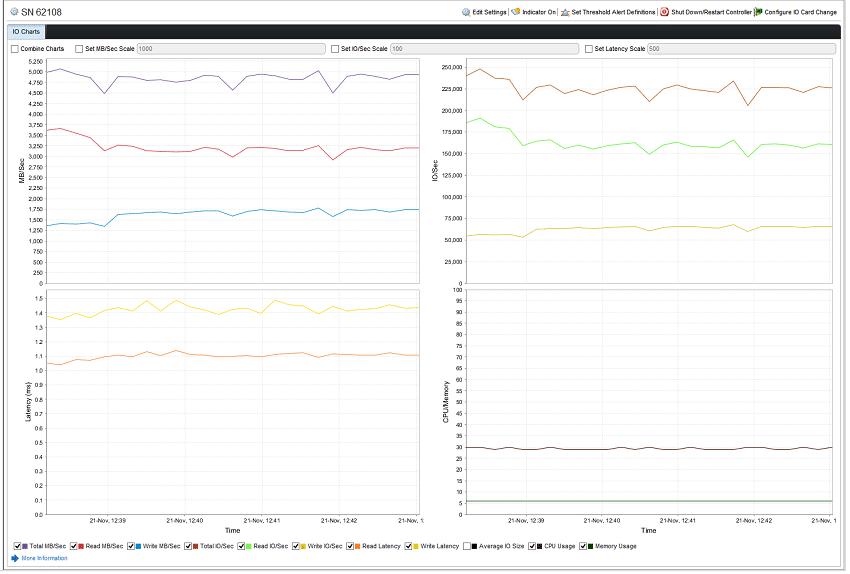
Drilling in further to look at a single controller to monitor its CPU/RAM usage at the 32VM level, we see the controller floating at roughly 30% usage. This tells us the controller still has plenty of headroom available for additional load, which could be captured with high-performance SSDs or additional shelves added to the array. So even pushing 5GBs and 200k+ IOPS, the controller still had a huge amount of headroom left!
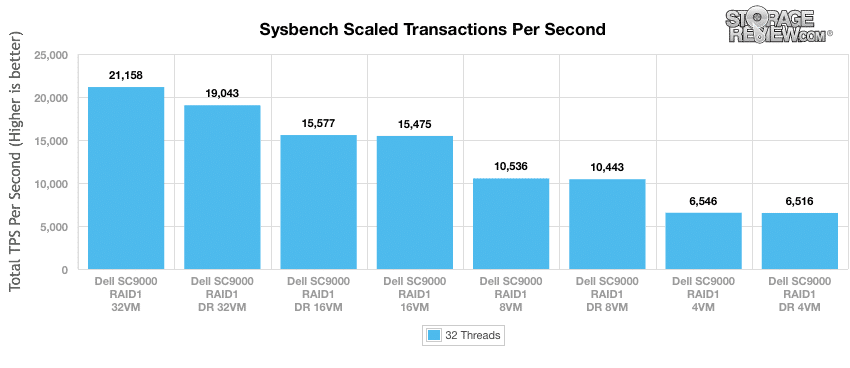
As we look at Sysbench transactional performance stepping up from 4 to 32VMs, the part that’s most impressive is that up until the highest workload, there is negligible difference between running storage with or without data reduction turned on. Only at the highest level do we see that aggregate performance dips, in this case from 21,158TPS down to 19,043TPS.
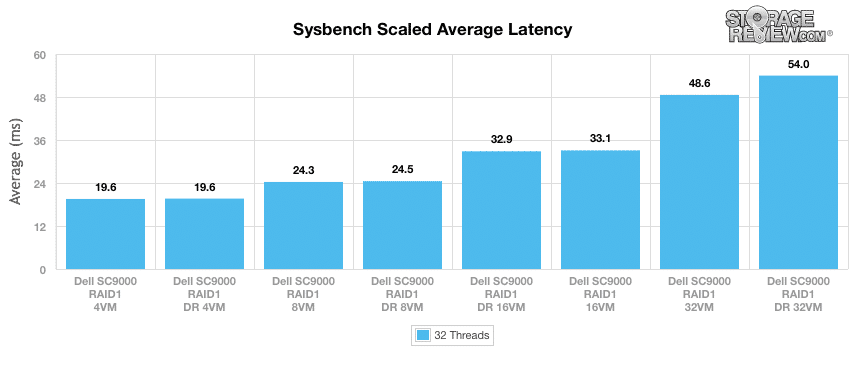
Focusing on average aggregate latency in our Sysbench test, we note minimal difference between DR turned on or off up until the 32-VM increment. At that stage, latency increases from 48.6ms (non-DR) to 54ms (DR).
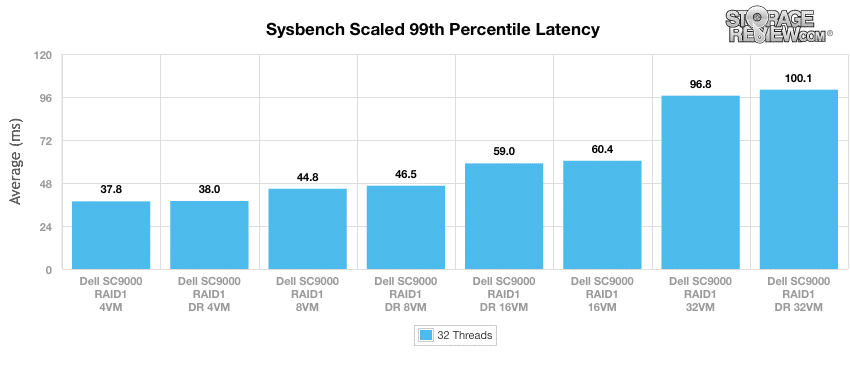
Our next test focuses on the 99th percentile latency, showing more of the attributes of the peak measurements recorded over the testing period. This is another area that surprised us in our review of the Dell EMC SC9000, as data reduction enabled didn’t cause any spike in peak latencies.
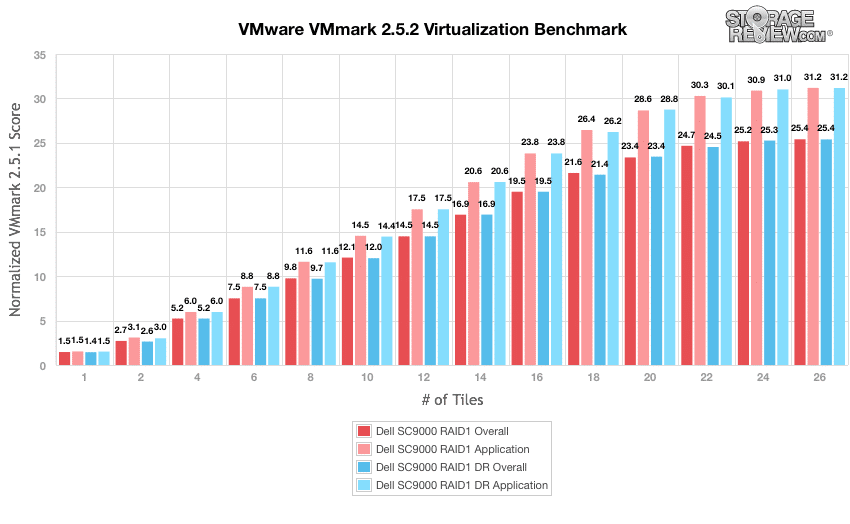
VMmark Performance Analysis
Each of the Application Performance Analysis benchmarks attempts to show how products perform in a live production environment compared to the company’s claims. We believe it is essential to evaluate storage devices in the context of larger systems in order to understand how responsive storage is when interacting with key midrange applications. One important tool for evaluating application performance is the VMmark virtualization benchmark by VMware.
VMmark by design is a highly resource-intensive benchmark, with a broad mix of VM-based application workloads stressing storage, network and compute activity. This means that appropriately configured VMmark benchmarks can provide insight into the range of performance including covering storage I/O, CPU, and even network performance.
With the multiple clones of VMs, our VMmark test worked quite well with the SC9000’s compression and post-process deduplication capabilities. After loading on the tiles for the test, we had consumed roughly 6TB of storage, with 12TB used in the storage pool based on our RAID1 storage type. After leaving the array to settle overnight and allow its snapshot-based DR process to take place, we saw a small bump in overall storage footprint to 15TB and then witnessed a graceful slide down in footprint to slightly over 1TB, as data was reduced in size and de-staged to RAID5-9.
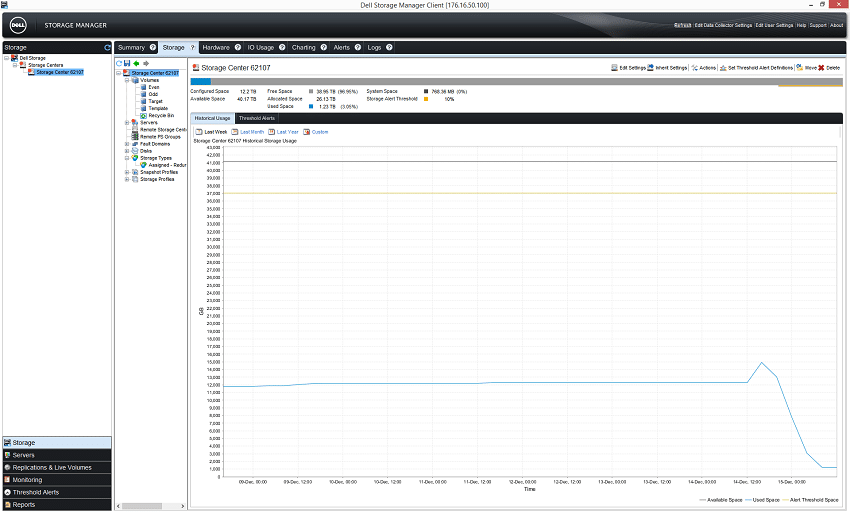
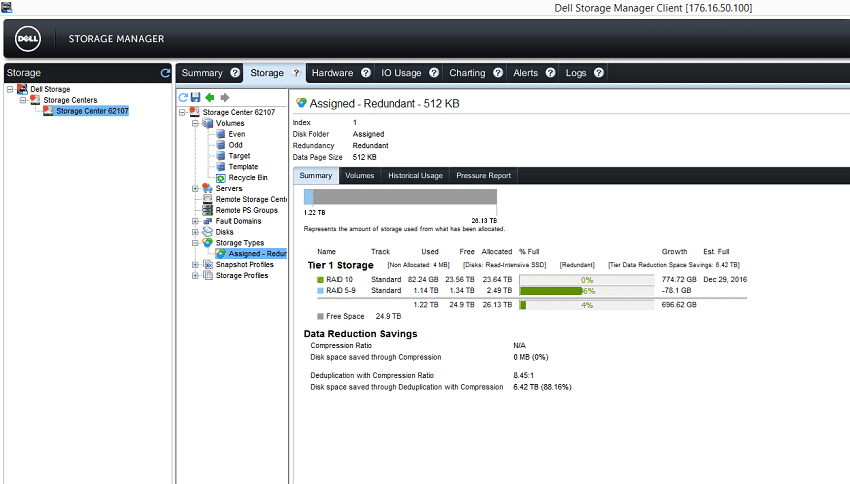
Looking at the storage allocation when the data-reduction process had completed, the amount of storage left in RAID 10 was down to 82GB, while RAID 5-9 storage consumed 1.14TB. This gave us a 88% reduction in storage consumed, saving us just over 6.4TB (12.8TB on disk)
Dell PowerEdge R730 VMware VMmark 4-Node Cluster Specifications
- Dell PowerEdge R730 Servers (x4)
- CPUs: Eight Intel Xeon E5-2690 v3 2.6GHz (12C/24T)
- Memory: 64 x 16GB DDR4 RDIMM
- Emulex LightPulse LPe16002B 16Gb FC Dual-Port HBA
- Emulex OneConnect OCe14102-NX 10Gb Ethernet Dual-Port NIC
- VMware ESXi 6.0
In our final application test looking at the results of our VMmark test on the Dell EMC SC9000, we again see there is minimal impact of the post-process data reduction on our benchmarks. From 1 to 26 tiles, we measured only minor decreases in overall and application scores in VMmark with data reduction enabled. At the 26-tile mark, both configurations matched one another, where our fixed compute cluster fully saturated its CPU resources.
Conclusion
The Dell EMC SC9000 is one of the fastest, most capable, and scalable midrange storage systems we have evaluated at the StorageReview Enterprise Test Lab. The SC9000, running SCOS 7 and managed by Dell Storage Manager (DSM), is a formidable combination that is hard to outperform or underprice. SC9000 systems can manage up to 960 drives with 3PB raw capacity and 2PB addressable capacity. This scalability is possible, in part, due to a variety of available enclosures including 5U enclosures with 84 drive bays and 12Gb SAS connectivity. Moreover, Dell EMC has made sure that adding a new enclosure is straightforward, with new capacity available for existing and new storage pools. With new integrated EqualLogic PS management support via DSM, Dell EMC has a lot to offer here for its existing customers, as well as for administrators evaluating the Storage Center family for new deployments.
One other advantage to working with a large and established vendor like Dell Technologies is the company’s extensive library of supported third-party integrations. SC9000 controllers running on SCOS7 can take advantage of integrations with Microsoft, Oracle, OpenStack, IBM, CommVault, Symantec, Foglight and others. While the VMware VVol feature was described in detail previously, it should be mentioned that SC9000 administrators can also take advantage of a VMware vSphere plug-in, vCenter SRM adapter and VAAI support.
Given the combined portfolios of Dell and EMC, it’s important to understand where the SC family fits in. Dell EMC views the SC Series and Unity families as firmly midmarket storage, with XtremIO, ScaleIO and VMAX as enterprise and webscale-oriented solutions. Don’t mistake the SC’s targeting for a lack of capabilities though. As the review data shows, the system performs extremely well with fresh data, as well as with data that’s gone through the SC’s post process data reduction (or migration in hybrid configs). The SC is fully featured in terms of data services too, providing options like cross-platform replication amongst SC and legacy Compellent and EqualLogic storage within the DSM framework. If there’s anything to complain about here, it’s that DSM is dated (Java). And set next to Unity (HTML5), for instance, it’s night and day. That said, Dell has been investing in a web-GUI for SC storage that shows a lot of promise and will be getting regular updates, bringing the installed DSM application features to a modern look and feel. Lastly, SC storage will continue on, as Dell has a large installed base of SC customers that aren’t going to be abandoned. Long term, however, it’s reasonable to expect SC and Unity storage to be merged together, similar to what Dell has been working on with Compellent and EqualLogic merging into SC storage.
Turning to performance, the Dell EMC SC9000 excelled across the board, earning top merits across some benchmarks even though it was leveraging read-intensive SAS SSDs instead of higher-performing (and more expensive per TB) write-intensive drives. In a first for us, looking at a storage platform with data-reduction capabilities, there was nearly no overhead impact going from raw storage to full compression and post-process deduplication turned on. Both VMmark and SQL Server showed minimal changes, with performance dropping just a hair. In our scaled Sysbench tests, we did see a drop at the very top end, but until that point, DR and raw results were neck and neck. This even included our 99th percentile latency measurements, which showed peak latencies staying roughly the same even with data reduction running its course. There is one big difference between the SC9000 and other systems that support data reduction, and in this case, it’s post-process, not in-line. By going this route with SC storage, the heavy lifting of deduplication is handled when the system is relatively under-taxed (overnight), netting the very good performance profile for both new and old data. This architecture is not without its weaknesses though; the array has to be sized large enough that new writes can grow during the day, and contract at night when a snapshot and data migration process hits. This is different to data reduction that is inline, which doesn’t require scratch space, but generally takes a performance hit when the array is under load.
The SC9000 has shown itself to be a highly impressive storage array, surpassing all of our expectations. Given the maturity of the SC platform, perhaps this is taken for granted. Or perhaps with the flurry of vocal startups in the flash space, we lost sight of what SC can do. Either way, Dell EMC has a complete line of SC storage that can address the needs of any organization across the SMB, making it easy to start small and grow as needed. The all-flash SC9000 we tested sits atop the SC portfolio, bringing a deep set of data services and class-leading support to the table. Combined with a performance profile that is simply astounding for this class of storage, we proudly bestow our first Editor’s Choice award of 2017 on the Dell EMC SC9000.
Pros
- Best-in-class data deduplication and compression technology
- Integrated management with Dell EqualLogic PS arrays via the Dell Storage Manager
- Dell Copilot integrated support platform
Cons
- The installed Dell Storage Manager interface feels dated
The Bottom Line
The Dell EMC SC9000 sets the standard for midmarket storage performance and functionality, and it does so at an affordable price and with a comprehensive support package.


 Amazon