Tower workstations have their place, but for remote work and security, the HP Z4 Rack G5 rack workstation offers admirable performance in a 1U form factor.
HP Z4 Rack G5 Specifications
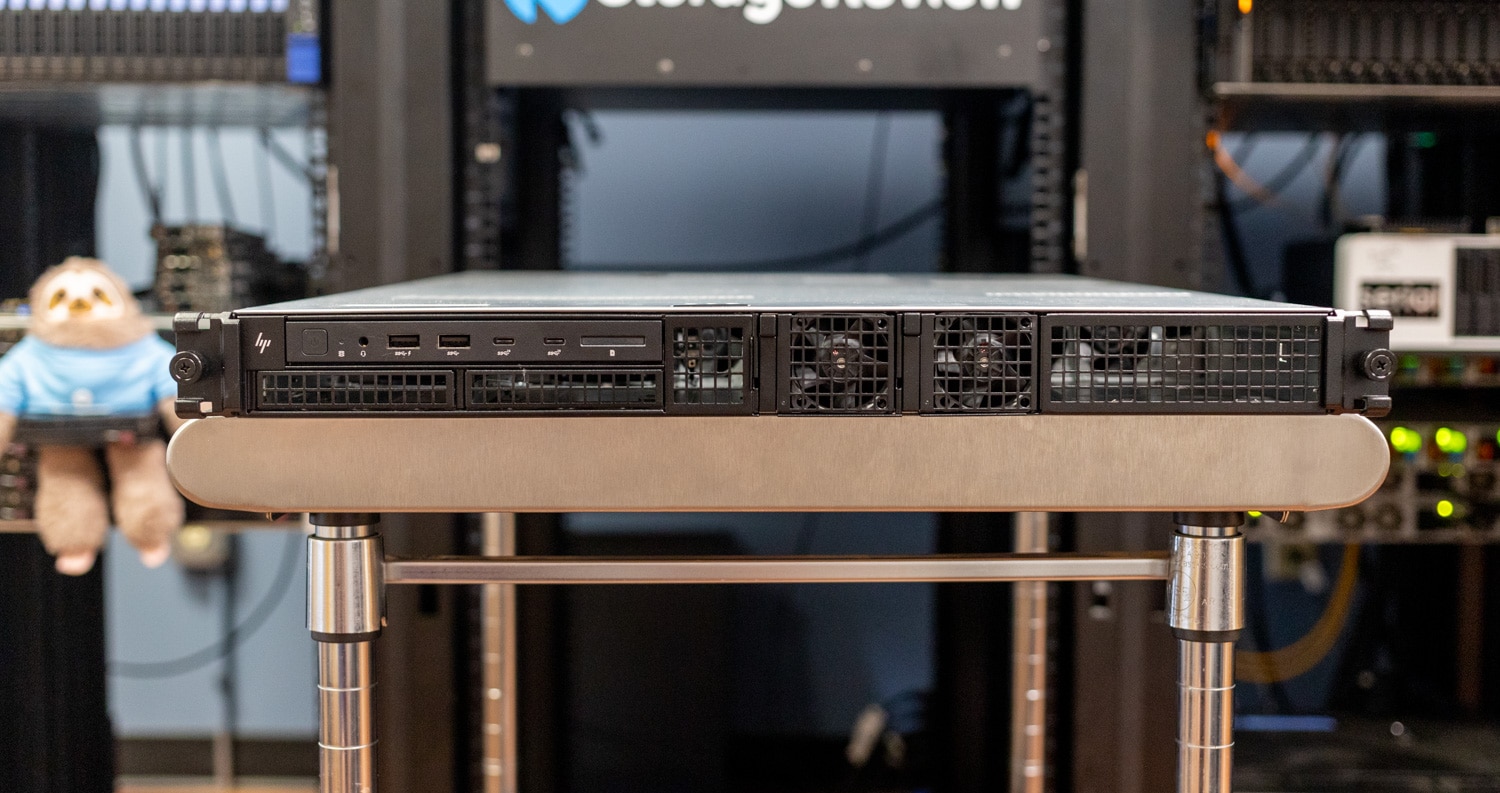
We’re reviewing HP’s Z4 G5 as a blade server, but it’s also available as a tower workstation. The Z4 Rack G5 is a 1U rack server featuring a single Intel Xeon W-2400 CPU, support for the NVIDIA RTX 6000 Ada Generation GPU, and 256GB of RAM. Its 1U form factor is highly notable; many workstation towers offer rackmount kits but will take much more than 1U of space.
Remote access comes from HP’s Anyware solution, for access from any device. The Z4 Rack G5 is also covered by HP Wolf Security for Business, which is hardware and software level protection.
The Z4 Rack G5’s specifications are as follows:
| Operating System |
|
| Processor | Intel Xeon W-2400 |
| Chipset | Intel W790 |
| Memory |
|
| Graphics |
|
| Bays |
|
| Controller |
|
| Networking/Communication |
|
| Front I/O | Premium:
Entry:
|
| Rear I/O |
|
| Optional Port |
|
| PCI Express Connectors | Standard PCIe slot:
Optional PCIe slots
M.2 slots:
|
| Security |
|
| Power Supply | Entry:
Entry (redundant mode):
Premium:
|
| Form Factor | 1U |
| System Weight | Starting at 9.52 kg(21.6 lb) |
| Chassis Dimensions (HWD) | With front bezel and rack brackets: 4.3 x 48.7 x 67.5 cm (1.68 x 18.96 x 25.8 in) |
HP Z4 Rack G5 Build and Design
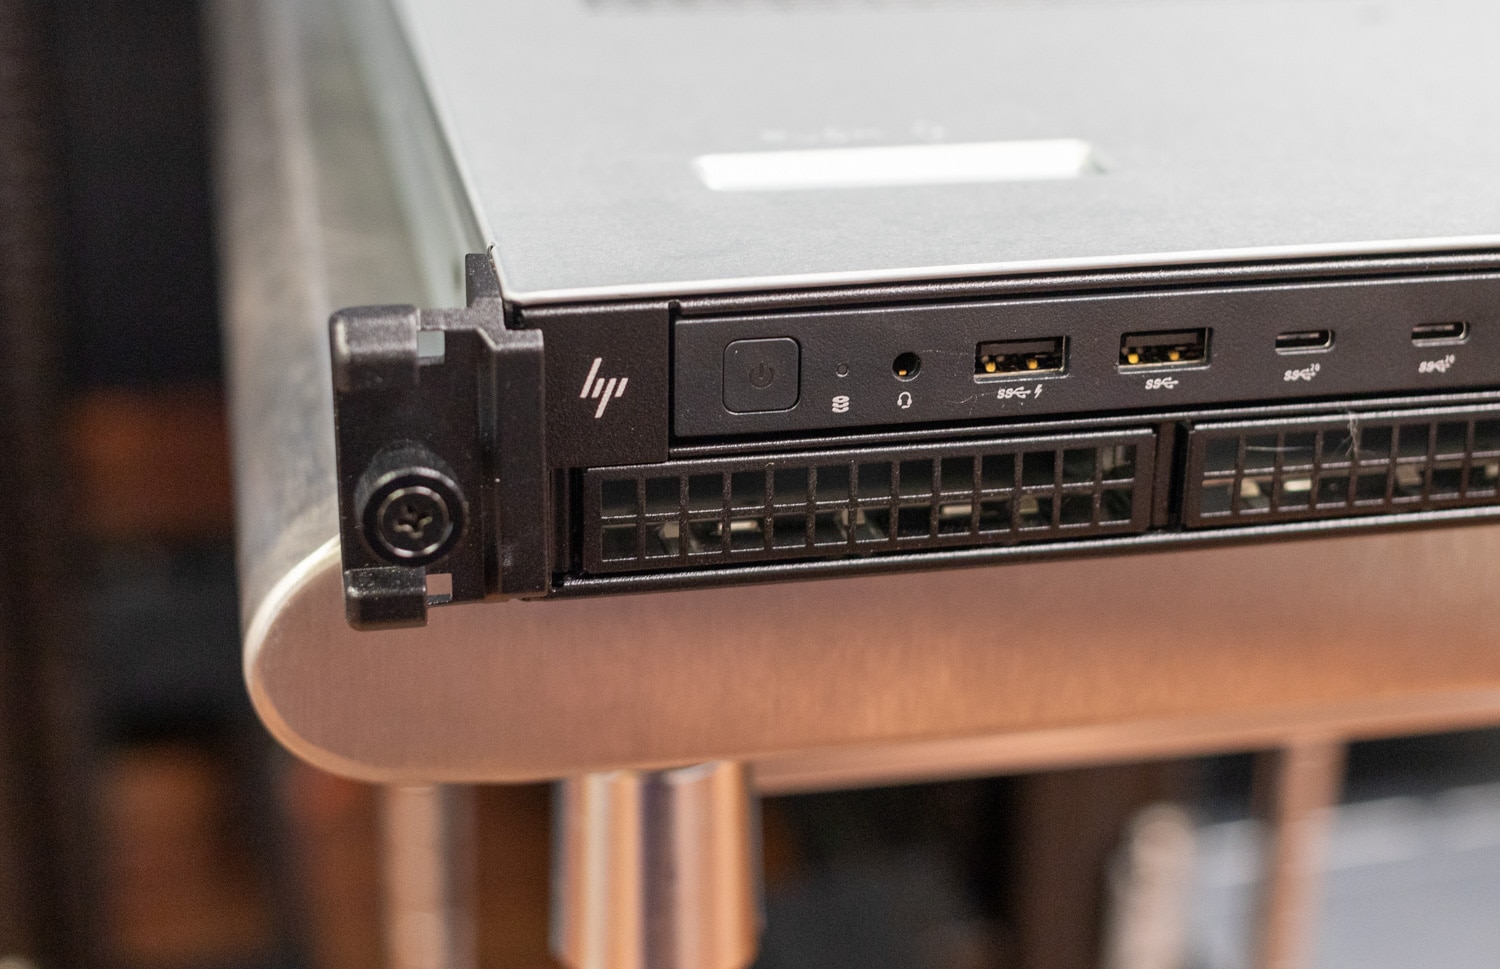
The Z4 Rack G5 has standard 1U rack server dimensions (1.68 x 18.96 x 25.8 inches, HWD; up to 21.6 pounds depending on configuration), but the plentiful front-panel connectivity tells you it’s not the average rack server, where you’ll find the power button, a headphone/microphone jack, two 5Gbps USB Type-A ports, and two 20Gbps USB Type-C ports. There’s even an optional SD card reader.
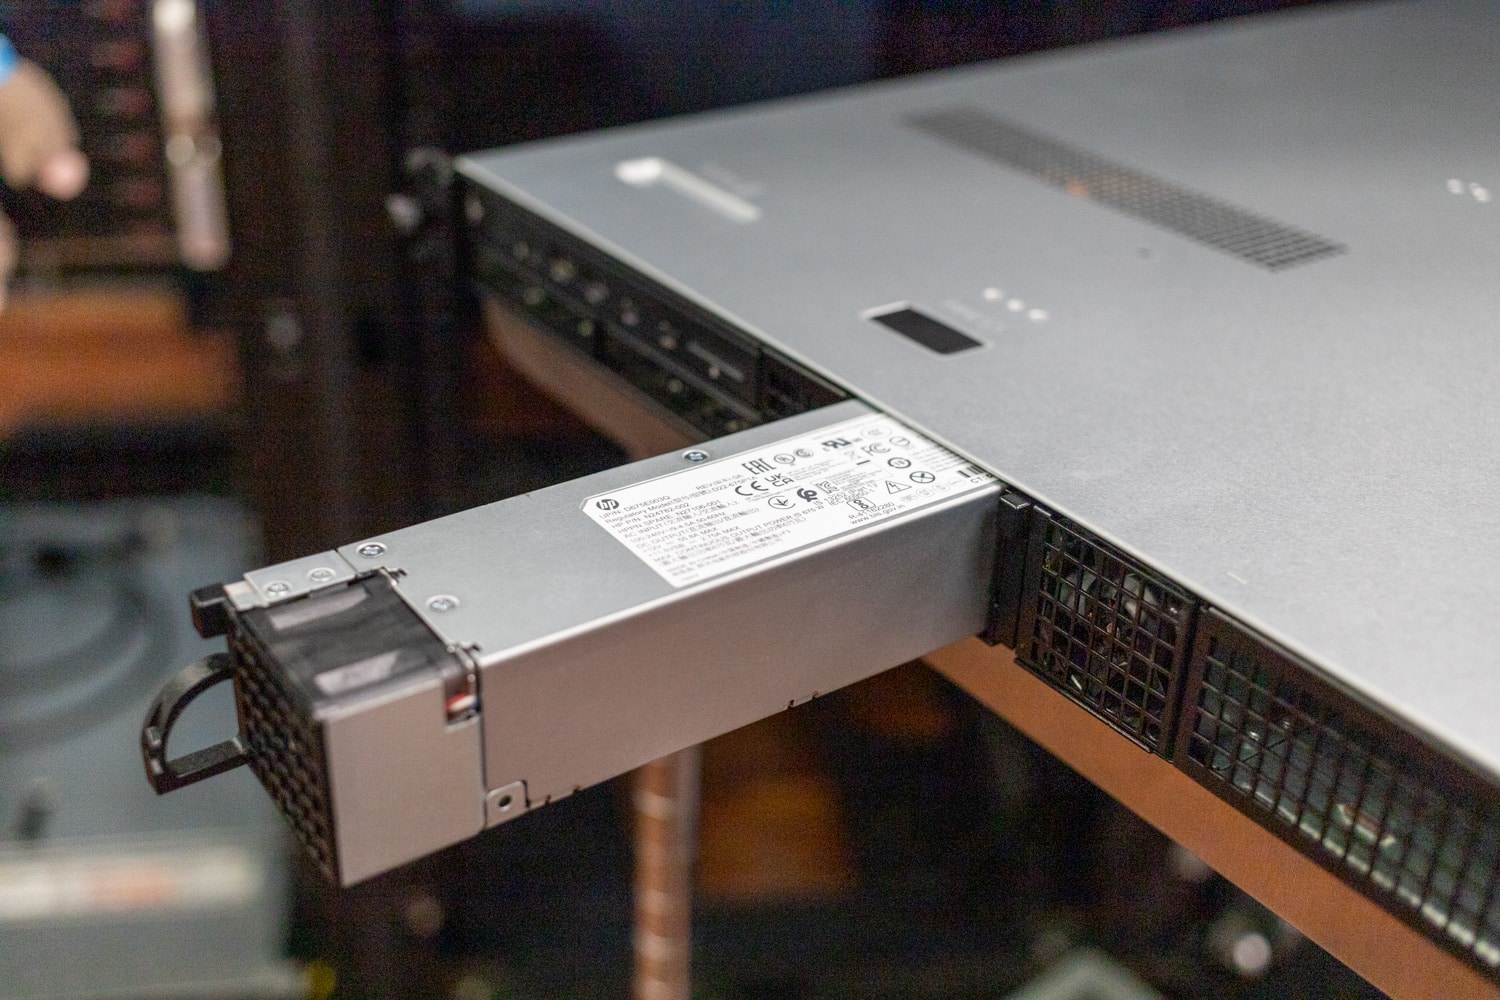
Storage is also readily accessible from the front panel, with one 3.5-inch and two 2.5-inch bays. The power supply bays sit in the middle. The entry-level Z4 Rack G5 has a single 675W model, but ours has two. Top-end configurations slave the two power supplies together for a combined output of 1,350W. A locking front security bezel is optional; there’s also a Kensington lock slot around back.
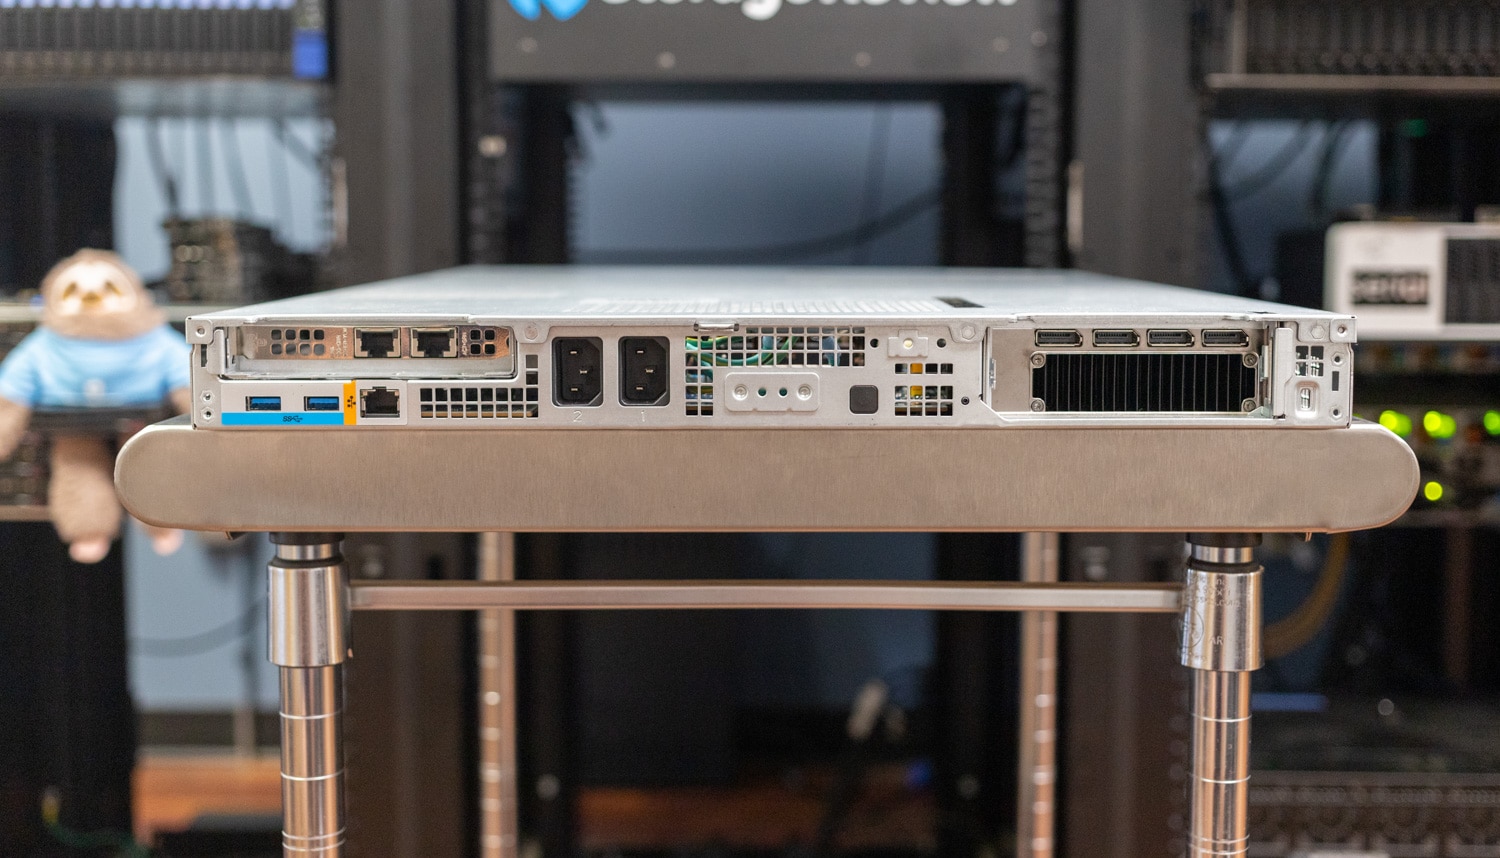
Rear connectivity includes two more 5Gbps USB Type-A ports and 1GbE (Intel AMT enabled). The NVIDIA RTX A6000 graphics card in our unit has four DisplayPort video outputs. The power cable connectors and a power button are also back here.
HP also allows an optional port to be configured to the right of the power button; you can choose from a Serial port; 1GbE, 2.5GbE, or 10GbE networking; or a Z Desktop Power and Signal interface for supporting the HP Anyware remote system controller. For more connectivity or features, the Z4 Rack G5 has a dual-slot PCIe Gen5 riser on the right.
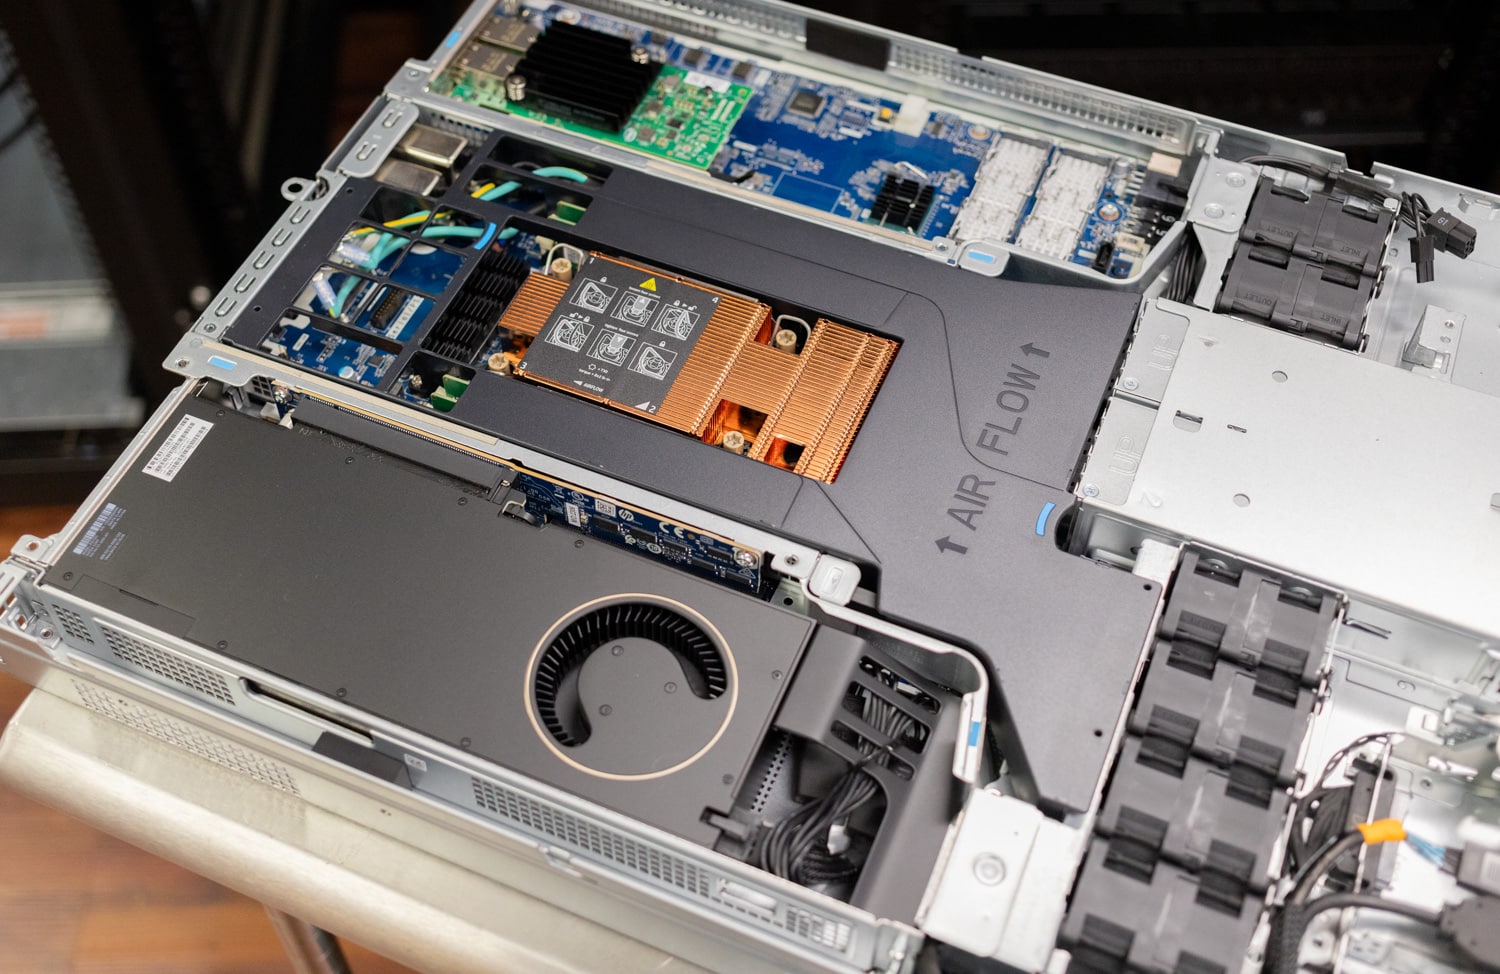
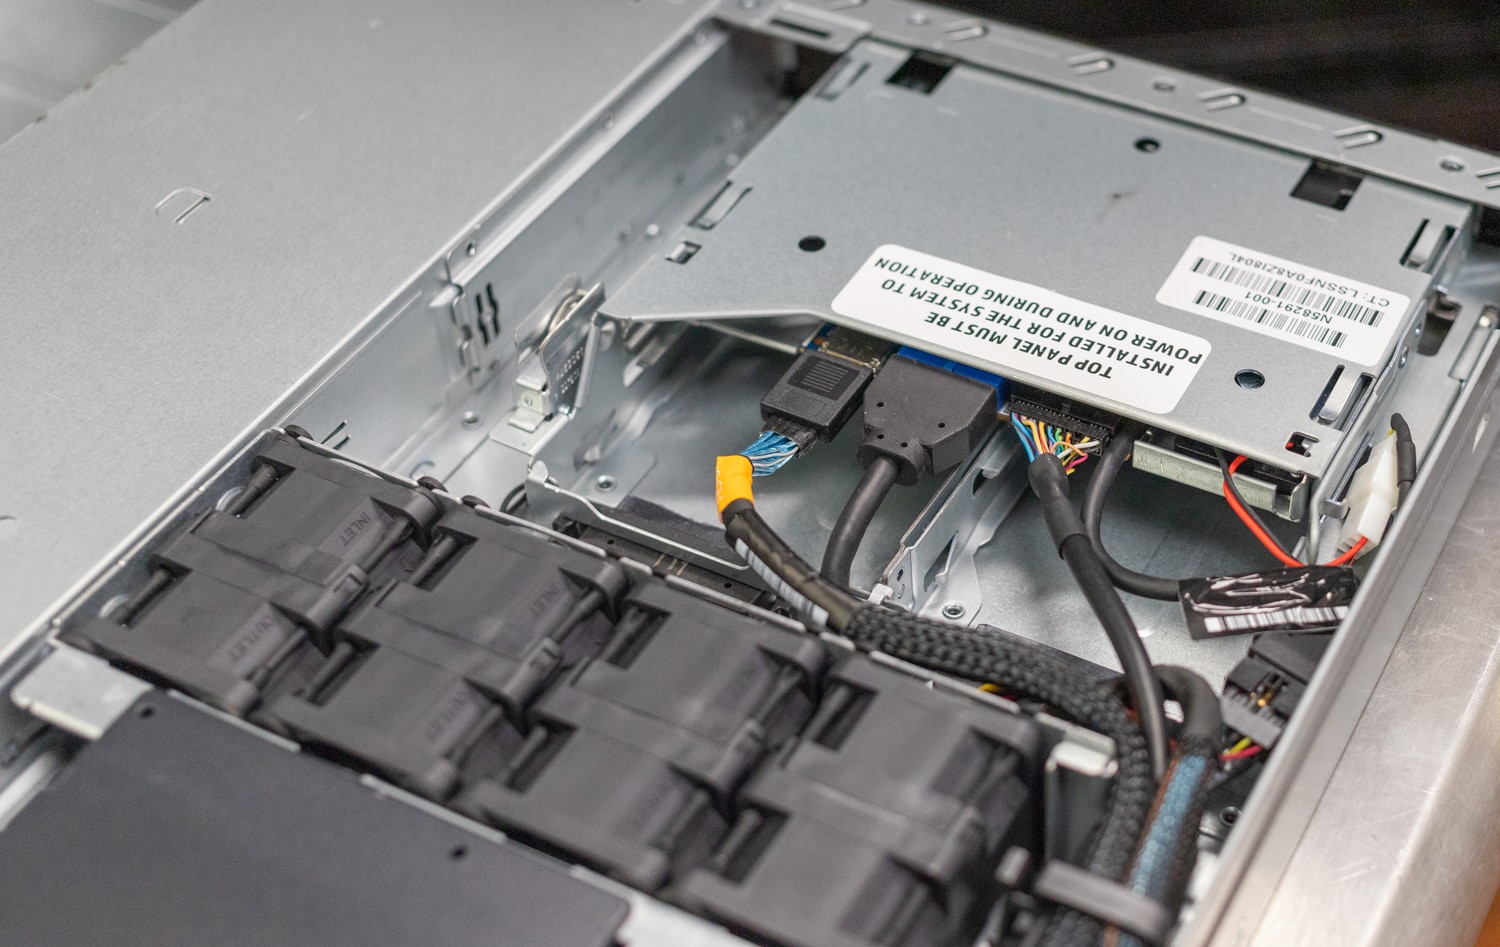
Accessing the interior is a toolless operation. Inside most components or brackets can be accessed without tools. Some specific devices such as the CPUs and M.2 SSDs will still require a screwdriver, however.
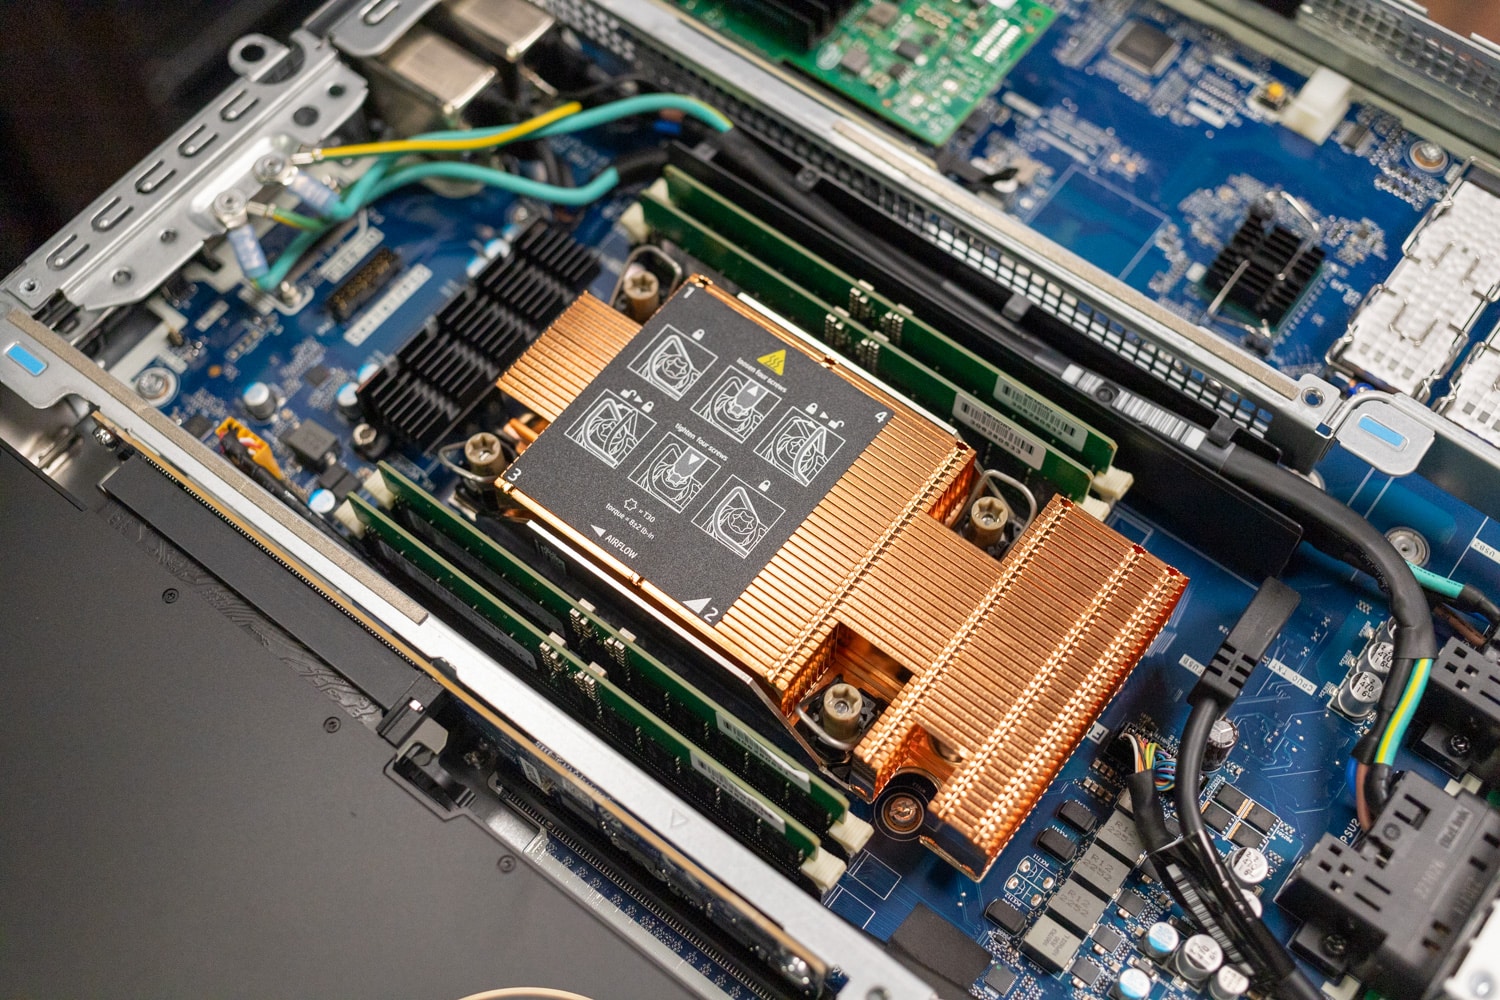
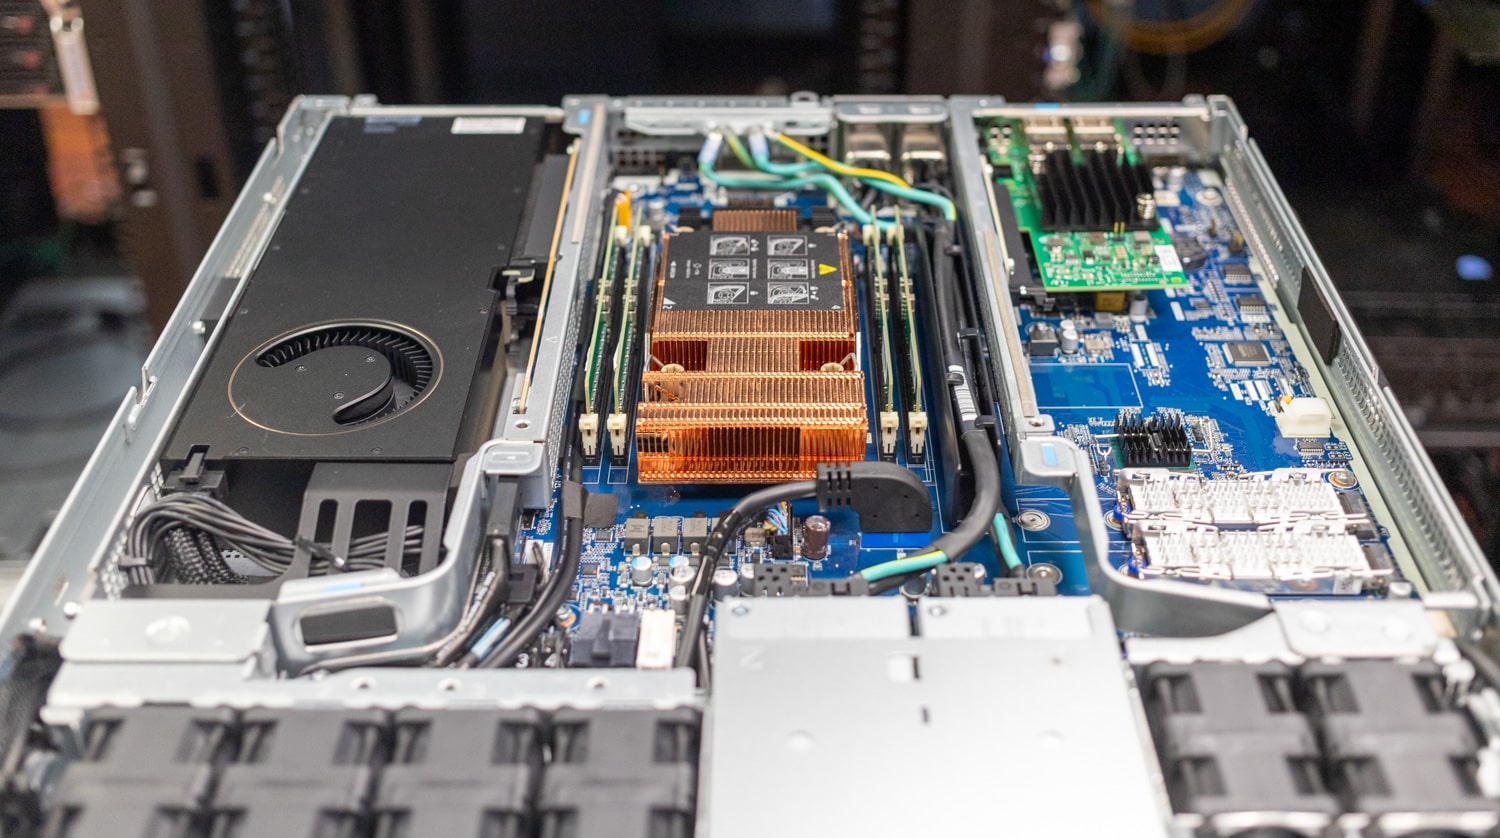
The Xeon CPU on the Intel W790-based mainboard has a low-profile cooler. On the left, the RTX A6000 graphics card gets lots of airflow from the centerline fans. Two more of those fans plus the fans in the power supplies complete the airflow in this server.
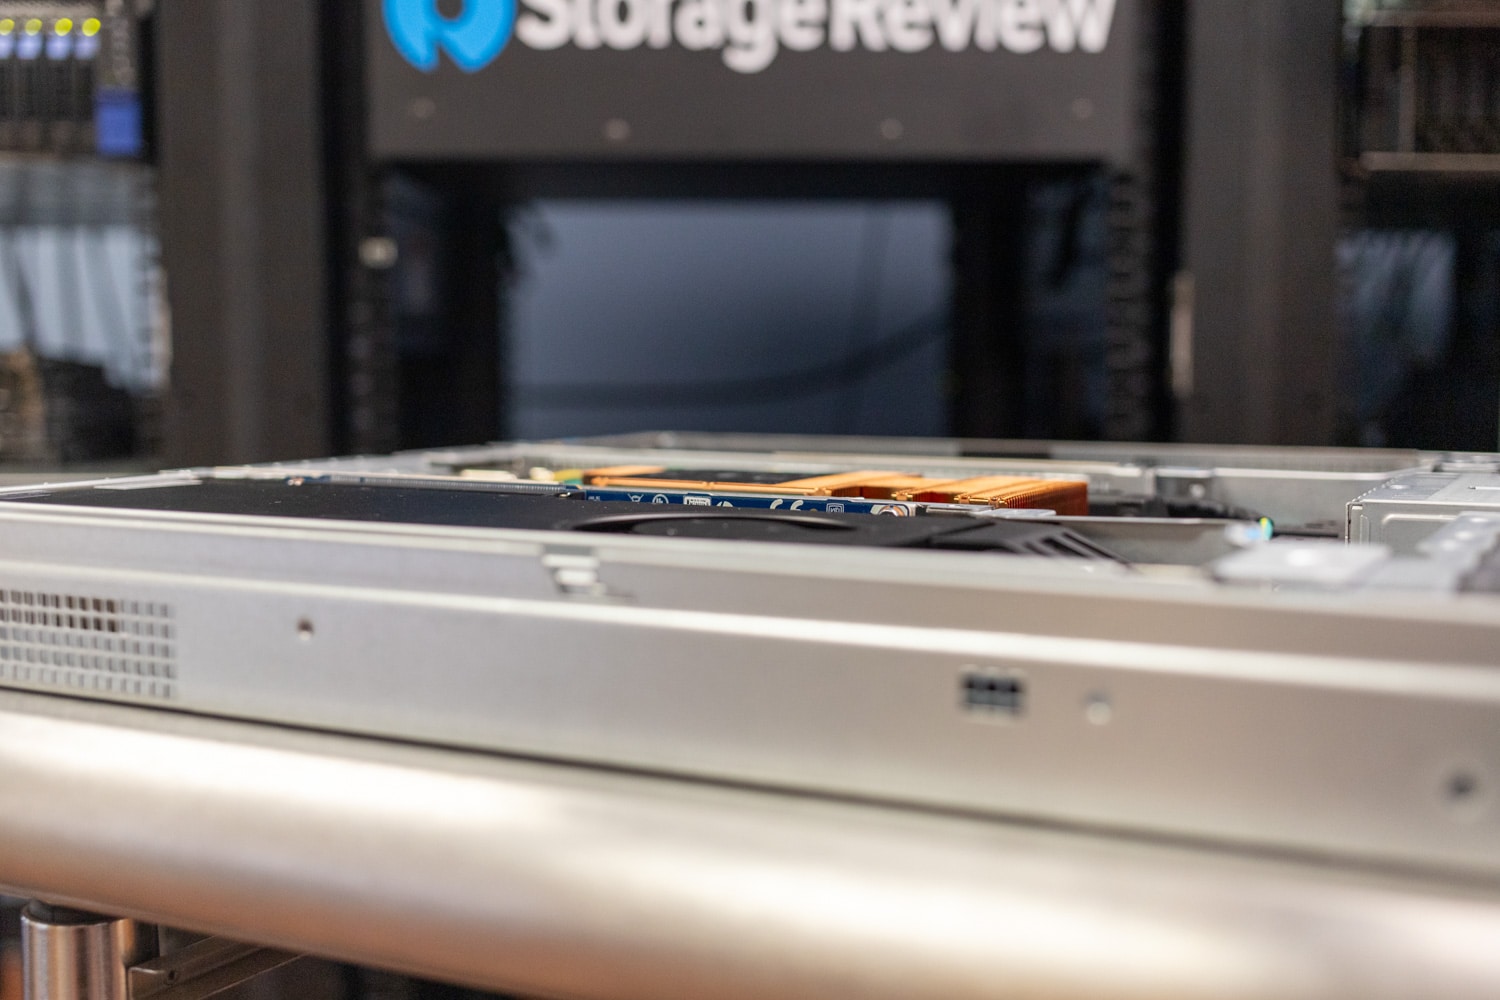
In terms of the GPU layout, while it didn’t hinder results in our review the airflow to the A6000 in the rear is pretty slim. The A6000 being a desktop-style card draws air in from above and below the card (versus a server pass-through design). You can see that in a 1U chassis, there really isn’t a lot of spacing between the top or bottom cover and the inlet fan.
The Xeon CPU is flanked by four DIMM slots, which isn’t a lot for server, but it’s enough for 256GB of RAM.
HP Z4 Rack G5 Performance
Our HP Z4 Rack G5 review unit is configured as follows:
- Intel Xeon w5-2465X CPU (16-core/32-thread, up to 4.7GHz, 200-watt processor base power)
- NVIDIA RTX A6000
- 128GB RAM (4x 32GB)
- 2x 1TB SSDs
- 2x 675W PSU
Pricing for this configuration is not yet available online at the time of this review.
We’ll be comparing the Z4 Rack G5 against the more powerful Z6 G5 Tower equipped with an Intel Xeon W9-3475X, 128GB of RAM, and three RTX A6000 GPUs. It’s not apples to apples.
SPECviewperf 2020
Our first test is SPECviewperf 2020, the worldwide standard for measuring graphics performance of professional applications under the OpenGL and Direct X application programming interfaces. The viewsets (or benchmarks) represent graphics content and behavior from actual applications, without having to install the applications themselves. The newest version of this benchmark went through major updates late last year, including new viewsets taken from traces of the latest versions of 3ds Max, Catia, Maya, and Solidworks applications. In addition, they added support within all viewsets for both 2K and 4K resolution displays. We only have results for the Z4 Rack G5 in this test.
| SPECviewperf2020 Viewsets (Higher is better) | HP Z4 Rack G5 |
| 3dsmax-07 | 140.04 |
| Catia-06 | 89.77 |
| Creo-03 | 124.79 |
| Energy-03 | 41.32 |
| Maya-06 | 323.21 |
| Medical-03 | 33.63 |
| Snx-04 | 454.17 |
| Sw-05 | 166.81 |
SPECworkstation 3
SPECworkstation3 specializes in benchmarks designed for testing all key aspects of workstation performance; it uses over 30 workloads to test CPU, graphics, I/O, and memory bandwidth. The workloads fall into broader categories such as Media and Entertainment, Financial Services, Product Development, Energy, Life Sciences, and General Operations. We are going to list the broad-category results for each, as opposed to the individual workloads. The results are an average of all the individual workloads in each category. We only have results for the Z4 Rack G5 in this test.
| SPECworkstation 3 (Higher is better) | HP Z4 Rack G5 |
| Media and Entertainment | 5.12 |
| Product Development | 5.76 |
| Life Sciences | 5.52 |
| Financial Services | 5.66 |
| Energy | 5.88 |
| General Operations | 2.77 |
| GPU Compute | 7.33 |
Blender OptiX
Blender is an open-source 3D modeling application. This benchmark was run using the Blender Benchmark utility. The score is samples per minute, with higher being better. We only have results for the Z4 Rack G5 in this test.
| Blender OptiX (Samples per minute, Higher is better) | HP Z4 Rack G5 |
| Monster | 2,925.5 |
| Junkshop | 1,759.6 |
| Classroom | 1,523.3 |
Luxmark
Another 3D benchmark we will be looking at is LuxMark, an OpenCL GPU benchmarking utility. The Z6 G5 expectedly dominated here, thanks to its triple GPUs.
| Luxmark (Higher is better) | HP Z4 Rack G5 | HP Z6 G5 |
| Hallbench | 20,801 | 64,429 |
| food | 7,375 | 23,859 |
ESRI
Next up is the Environmental Systems Research Institute (Esri) benchmark. Esri is a supplier of Geographic Information System (GIS) software. Esri’s Performance Team designed their PerfTool add-in scripts to automatically launch the ArcGIS Pro. This application uses a “ZoomToBookmarks” function to browse various predefined bookmarks and create a log file with all the key data points required to predict the user experience. The script automatically loops the bookmarks three times to account for caching (memory and disk cache). In other words, this benchmark simulates heavy graphical use that one might see through Esri’s ArcGIS Pro software.
The tests consist of three main datasets. Two are 3-D city views of Philadelphia, PA, and Montreal, QC. These city views contain textured 3-D multipatch buildings draped on a terrain model and draped aerial images. The third dataset is a 2-D map view of the Portland, OR region. This data contains detailed information for roads, land use parcels, parks and schools, rivers, lakes, and hill shaded terrain. We only have results for the Z4 Rack G5 in this test, as the multi-GPU setup in the Z6 wasn’t optimal for this workload.
First up is the Montreal model.
| ESRI ArcGIS Pro 2.3 Montreal | |
| Average FPS | Average |
| HP Z4 Rack G5 | 589.67 |
| Minimum FPS | Average |
| HP Z4 Rack G5 | 278.77 |
Next up is Philly.
| ESRI ArcGIS Pro 2.3 Philly | |
| Average FPS | Average |
| HP Z4 Rack G5 | 504.40 |
| Minimum FPS | Average |
| HP Z4 Rack G5 | 279.75 |
Last is the Portland model.
| ESRI ArcGIS Pro 2.3 Portland | |
| Average FPS | Average |
| HP Z4 Rack G5 | 2,207.09 |
| Minimum FPS | Average |
| HP Z4 Rack G5 | 1,170.30 |
OctaneBench
Next, we look OctaneBench, a benchmarking utility for OctaneRender, which is another 3D renderer with RTX support that is similar to V-Ray. This is another test where the triple-GPU Z6 G5 wound up far ahead, but the Z4 Rack G5’s results are in line for a single RTX A6000.
| OctaneBench (Score, higher is better) | Kernel | HP Z4 Rack G5 | HP Z6 G5 |
| Interior | Info channels | 18.94 | 54.77 |
| Interior | Direct lighting | 68.86 | 198.73 |
| Interior | Path tracing | 88.64 | 258.16 |
| Idea | Info channels | 12.01 | 33.88 |
| Idea | Direct lighting | 53.63 | 156.49 |
| Idea | Path tracing | 65.97 | 192.46 |
| ATV | Info channels | 29.59 | 85.30 |
| ATV | Direct lighting | 75.75 | 222.03 |
| ATV | Path tracing | 95.12 | 278.86 |
| Box | Info channels | 16.24 | 46.34 |
| Box | Direct lighting | 67.92 | 198.41 |
| Box | Path tracing | 76.65 | 224.30 |
Blackmagic RAW Speed Test
We have also started running Blackmagic’s RAW speed test, which tests video playback. The Z4 Rack G5 was somehow much faster in the 8K CUDA test; note we only included the scores for the Z6 G5 using one GPU.
| Blackmagic RAW Speed Test (Higher is better) | HP Z4 Rack G5 | HP Z6 G5 (Single GPU) |
| 8K CPU | 103 fps | 133 fps |
| 8K CUDA | 177 fps | 122 fps |
7-Zip Compression
We also run the built-in memory benchmark in the popular 7-Zip utility. The Xeon W-2400-class CPU in the Z4 Rack G5 wasn’t going to match the beefier Xeon W-3400 in the Z6 G5, which has more cores, threads and memory channels.
| 7-Zip Compression Benchmark (Higher is better) | HP Z4 Rack G5 | HP Z6 G5 |
| Current CPU Usage | 1,700% | 3,396% |
| Current Rating/Usage | 7.992 GIPS | 5.928 GIPS |
| Current Rating | 135.897 GIPS | 201.289 GIPS |
| Resulting CPU Usage | 1,698% | 3,383% |
| Resulting Rating/Usage | 7.964 GIPS | 5.978 GIPS |
| Resulting Rating | 135.143 GIPS | 202.216 GIPS |
| Decompressing | ||
| Current CPU Usage | 3,164% | 6,086% |
| Current Rating/Usage | 4.456 GIPS | 3.516 GIPS |
| Current Rating | 140.978 GIPS | 214.012 GIPS |
| Resulting CPU Usage | 3,154% | 6,069% |
| Resulting Rating/Usage | 4.453 GIPS | 3.514 GIPS |
| Resulting Rating | 140.471 GIPS | 213.235 GIPS |
| Total Rating | ||
| Total CPU Usage | 2,426% | 4,726% |
| Total Rating/Usage | 6.209 GIPS | 4.746 GIPS |
| Total Rating | 137.807 GIPS | 207.725 GIPS |
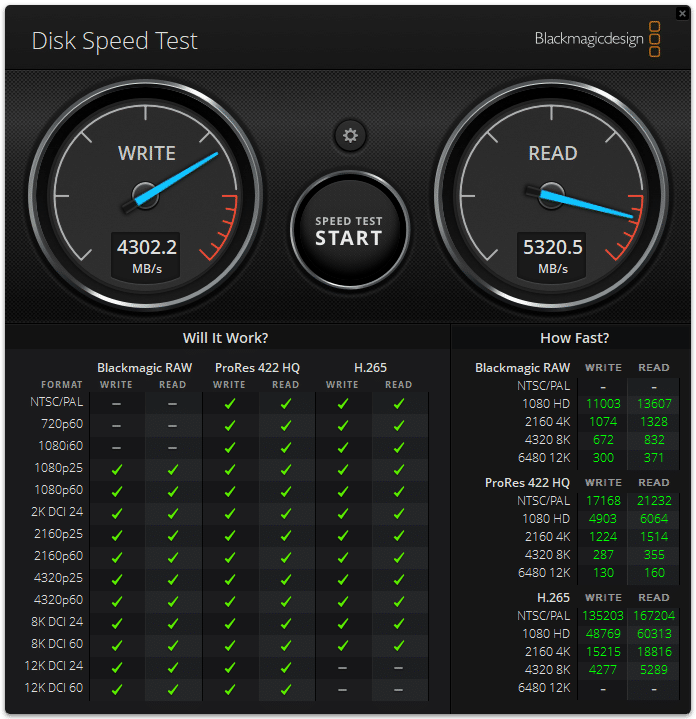
Blackmagic Disk Speed Test
We run the popular Blackmagic Disk Speed Test against the system’s primary storage drive. The results from the included 1TB NVMe SSDs are in line with our expectations for Gen4 drives.
UL Procyon AI Inference
UL’s Procyon estimates a workstation’s performance for professional apps. The Z4 Rack G5 surprisingly came out ahead here. Note that these tests don’t leverage multiple GPUs, so the Z6 G5’s results are for only one of its RTX A6000s.
| UL Procyon Average Inference Times (Lower is better) | HP Z4 Rack G5 (GPU) | HP Z4 Rack G5 (CPU) | HP Z6 G5 (GPU) | HP Z6 G5 (CPU) |
| MobileNet V3 | 0.60 | 1.33 | 0.86 | 1.28 |
| ResNet 50 | 1.55 | 6.25 | 1.59 | 10.99 |
| Inception V4 | 4.70 | 18.87 | 4.76 | 26.12 |
| DeepLab V3 | 3.96 | 25.34 | 4.08 | 44.02 |
| YOLO V3 | 4.60 | 34.33 | 4.53 | 85.54 |
| Real-ESRGAN | 129.98 | 1,714.92 | 127.57 | 3,179.34 |
| Overall Score | 1,071 | 201 | 1,000 | 120 |
y-cruncher
y-cruncher is a multi-threaded and scalable program that can compute Pi and other mathematical constants to trillions of digits. Since its launch in 2009, it has become a popular benchmarking and stress-testing application for overclockers and hardware enthusiasts. We only have results for the Z4 Rack G5 in this test.
| y-cruncher (Total Computation time) | HP Z4 Rack G5 |
| 1 billion digits | 15.307 seconds |
| 2.5 billion digits | 42.250 seconds |
| 10 billion digits | 203.551 seconds |
Geekbench 6
We have also recently started running the cross-platform Geekbench 6 test.
| Geekbench 6 (Higher is better) | HP Z4 Rack G5 |
| CPU Multi-Core | 16,857 |
| CPU Single-Core | 2,356 |
| GPU | 193,077 |
Cinebench R23
This benchmark uses all CPU cores and threads to generate an overall score.
| Cinebench R23 (Points, higher is better) | HP Z4 Rack G5 | HP Z6 G5 |
| Multi-Core | 28,631 | 45,571 |
| Single-Core | 1,687 | 1,392 |
HP Z4 Rack G5 Power Consumption
We are steadily adding power consumption figures to our server and workstation reviews. We do our testing with the Quarch IEC Mains Power Analysis Module. We only have results for the Z4 Rack G5 for now.
| Test | HP Z4 Rack G5 Power Consumption |
| Idle | 190.5 watts |
| GPU Load (Luxmark) | 436.6 watts |
| CPU Load (y-cruncher) | 318.2 watts |
| GPU + CPU Load (Luxmark + y-cruncher) | 604.5 watts |
Conclusion
The HP Z4 Rack G5’s space-saving 1U rackmount design takes compute density to new levels. Many tower workstations, including HP’s own Z4 G5 Tower, offer similar specifications and even rackmount capabilities, but they take up much more space, especially if they’re destined for the rack.
Other positives about the HP Z4 Rack G5 include impressive front-panel connectivity and externally-accessible storage. We also noted HP’s Anyware remote access suite and its Wolf Security suite. Overall, the Z4 Rack G5 gets our recommendation for a rackmount workstation.




 Amazon