

Micron today announced the availability of its new M500DC Enterprise SSD, a light-enterprise SSD designed and manufactured entirely in-house by Micron at a price point designed to make flash easier to adopt. Like its M500 cousin, the M500DC is built with Micron’s 20nm MLC flash and is offered with a SATA interface. The big change is the new M500DC increases the endurance from the M500, guaranteeing two drive fills per day for five years and a mean time between failures of 2M hours. The endurance figures are sufficient to deliver on enterprise use cases with fewer writes that still need advanced data path protection and features like power fail protection.
Like their other SSDs, Micron’s M500DC takes advantage of its SSD engineering and manufacturing capabilities in order to leverage deep integration between components and leverage economies of scale. In addition to employing Micron’s 20nm MLC NAND, the M500DC utilizes Micron’s DDR3 DRAM and serial NOR flash. A Marvell controller with custom firmware powers the drive. The M500DC also utilizes the company’s Redundant Array of Independent NAND (RAIN) architecture to extend the lifespan of MLC NAND by granularly aligning NAND read and write points to provide fine-tuned wear and performance management. RAIN’s architecture also provides an additional layer of additional parity and error correction metadata for data integrity.
In addition to RAIN, Micron’s custom firmware and XPERT SSD technology suite includes DataSAFE, a data protection feature that records the destination host logical block address (LBA) of data in motion as part of the M500DC’s metadata schema in order to ensure data reaches its intended destination despite interruptions along the route.
The Micron M500DC comes in capacities up to 800GB. Our review units include 480GB and 800GB capacities.
Micron M500DC Enterprise SSD Specifications
- Capacities: 120GB, 240GB, 480GB, 800GB
- Form Factor: 1.8-inch, 5mm z-height and 2.5–inch, 7mm z-height
- Controller: Marvell
- Media Type: 20nm MLC NAND
- Interface: SATA 6Gb/s (SATA III)
- Operating Shock: 1500 G/1ms
- Operating Vibration: 10-500Hz at 3.1G
- Endurance
- 120GB: 0.5PB Total Bytes Written
- 240GB: 1.0PB Total Bytes Written
- 480GB: 1.9PB Total Bytes Written
- 800GB: 1.9PB Total Bytes Written
- Drive Fills: 2 per day for 5 years
- MTTF: 2 million device hours
- Sequential Read/Write @ 128K: 425/375 MB/s
- Random Read/Write @ 4K: 65/35K IOPS
- Power
- Idle/Standby/Sleep: 200mW
- Active Average: 200mW, 250mW, 300mW, 325mW
- Active Maximum (128k Sequential): 4.0W, 5.0W, 6.0W, 6.3W
- XPERT feature set (RAIN, ARM/OR, ReCAL, eDPP)
- Operating Temp: 0°C to +70°C
- Weight: <142g
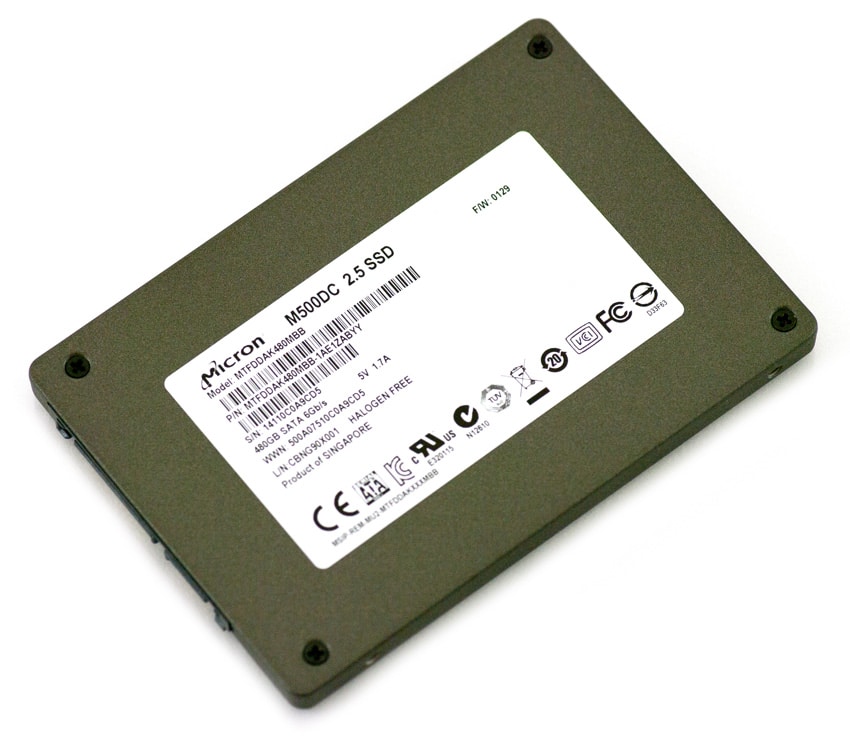
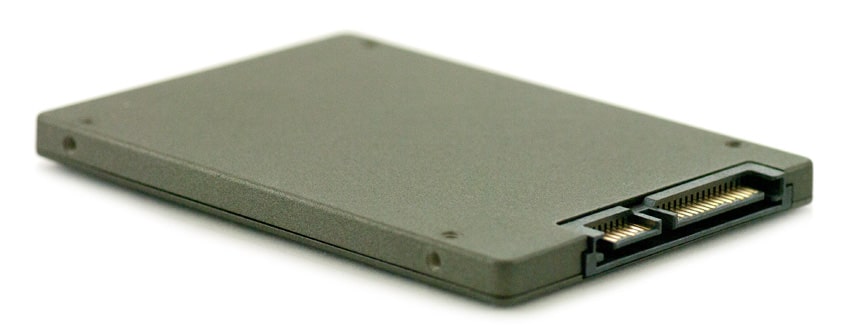
Design and Build
The Micron M500DC Enterprise SSD features an updated style and chassis color from the Micron M500, resulting in a drive that looks more similar to the company’s P400M than its M500.
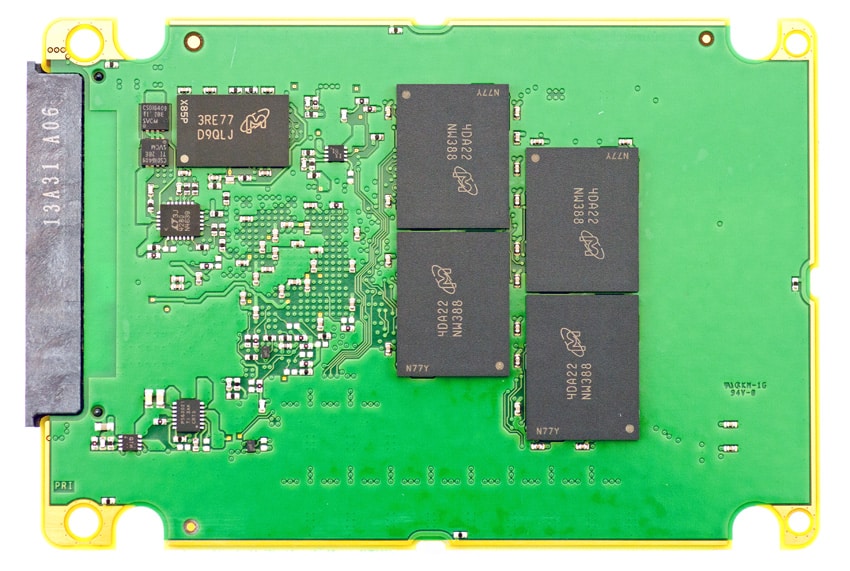
The Micron M500DC utilizes Micron’s 20nm NAND as well as the company’s DDR3 DRAM and serial NOR flash.
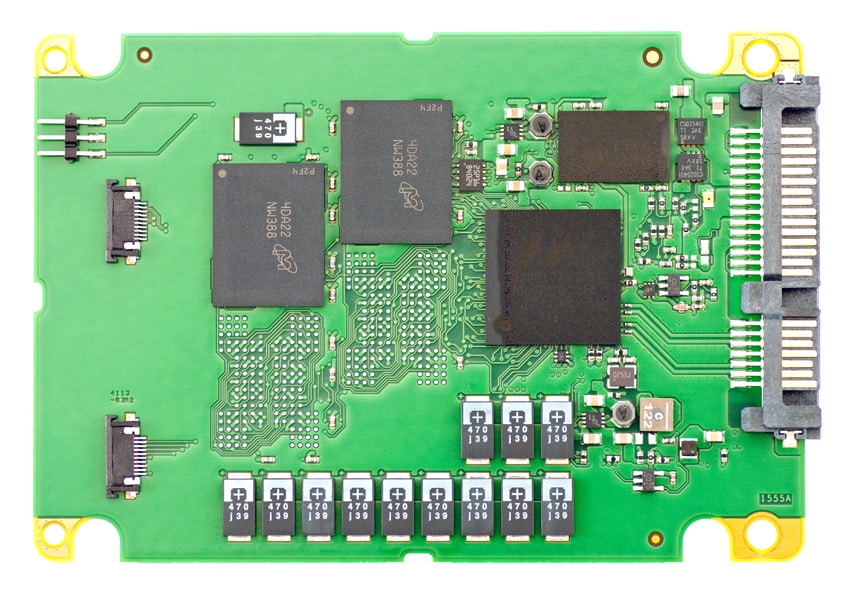
Onboard capacitors store power for the drive to commit any pending WRITE commands to persistent memory in the event of an unexpected power loss.
Testing Background and Comparables
The StorageReview Enterprise Test Lab provides a flexible architecture for conducting benchmarks of enterprise storage devices in an environment comparable to what SAN administrators encounter in real deployments. The Enterprise Test Lab incorporates a variety of servers, networking, power conditioning, and other network infrastructure that allows our staff to establish real-world conditions to accurately gauge performance during our reviews.
We incorporate these details about the lab environment and protocols into reviews so that IT professionals and those responsible for storage acquisition can understand the conditions under which we have achieved the following results. None of our reviews are paid for or overseen by the manufacturer of equipment we are testing. Additional details about the StorageReview Enterprise Test Lab and an overview of its networking capabilities are available on those respective pages.
The Micron M500DC uses Micron 20nm MLC NAND and a Marvell controller with a SATA 6.0Gb/s interface. SSD comparables for this review:
- Samsung SSD 840 Pro (512GB, 300mhz Samsung 3-core MCX controller, Samsung 2x nm Toggle NAND Flash, 6.0Gb/s SATA)
- Samsung SM843 (240GB, 300mhz Samsung 3-core MCX controller, Samsung 2x nm Toggle NAND Flash, 6.0Gb/s SATA)
- SMART Storage CloudSpeed 1000E (400GB, Marvell 9187 controller, 19nm Toshiba MLC NAND, 6.0Gb/s SATA)
- Micron M500 960GB (960GB, Marvell 9187 controller, Micron 20nm MLC NAND, 6.0Gb/s SATA)
- Micron P400m (400GB, Marvell 9187 controller, Micron 25nm MLC NAND, 6.0Gb/s SATA)
- Intel SSD DC S3500 (480GB, Intel PC29AS21CA0 controller, Intel 20nm MLC NAND, 6.0Gb/s SATA)
- Intel SSD DC S3700 (200GB, Intel PC29AS21CA0 controller, Intel 25nm MLC NAND, 6.0Gb/s SATA)
SAS and SATA enterprise SSDs are benchmarked on our second-generation enterprise testing platform based on a Lenovo ThinkServer RD630. This testing platform includes the latest interconnect hardware such as the LSI 9207-8i HBA as well as I/O scheduling optimizations geared towards best-case flash performance. For synthetic benchmarks, we utilize FIO version 2.0.10 for Linux and version 2.0.12.2 for Windows.
- 2 x Intel Xeon E5-2620 (2.0GHz, 15MB Cache, 6-cores)
- Intel C602 Chipset
- Memory – 16GB (2 x 8GB) 1333Mhz DDR3 Registered RDIMMs
- Windows Server 2008 R2 SP1 64-bit, Windows Server 2012 Standard, CentOS 6.3 64-Bit
- 100GB Micron RealSSD P400e Boot SSD
- LSI 9211-4i SAS/SATA 6.0Gb/s HBA (For boot SSDs)
- LSI 9207-8i SAS/SATA 6.0Gb/s HBA (For benchmarking SSDs or HDDs)
- Mellanox ConnectX-3 10GbE PCIe 3.0 Adapter
- Mellanox ConnectX-3 InfiniBand PCIe 3.0 Adapter
Application Workload Analysis
In order to understand the performance characteristics of enterprise storage devices, it is essential to model the infrastructure and the application workloads found in live production environments. Our first three benchmarks of the Micron M500DC are therefore the MarkLogic NoSQL Database Storage Benchmark, MySQL OLTP performance via SysBench and Microsoft SQL Server OLTP performance with a simulated TCP-C workload.
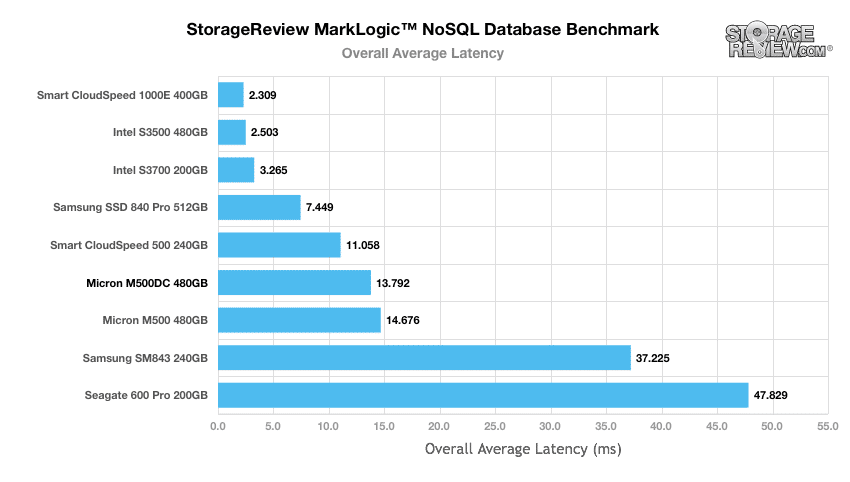
Our MarkLogic NoSQL Database environment requires groups of four SSDs with a usable capacity of at least 200GB, since the NoSQL database requires roughly 650GB of space for its four database nodes. Our protocol uses an SCST host and presents each SSD in JBOD, with one allocated per database node. The test repeats itself over 24 intervals, requiring between 30-36 hours total for the SSDs in this class. MarkLogic records total average latency as well as interval latency for each SSD.
The Micron M500DC substantially trailed the class-leading MLC SSDs from SanDisk and Intel, as well as the consumer-focused Samsung SSD 840 Pro with an overall average latency of 13.729ms. It was able to come in ahead of the Samsung SM843 and Seagate SSD 600 Pro, as well as the client-focused M500 of the same capacity.
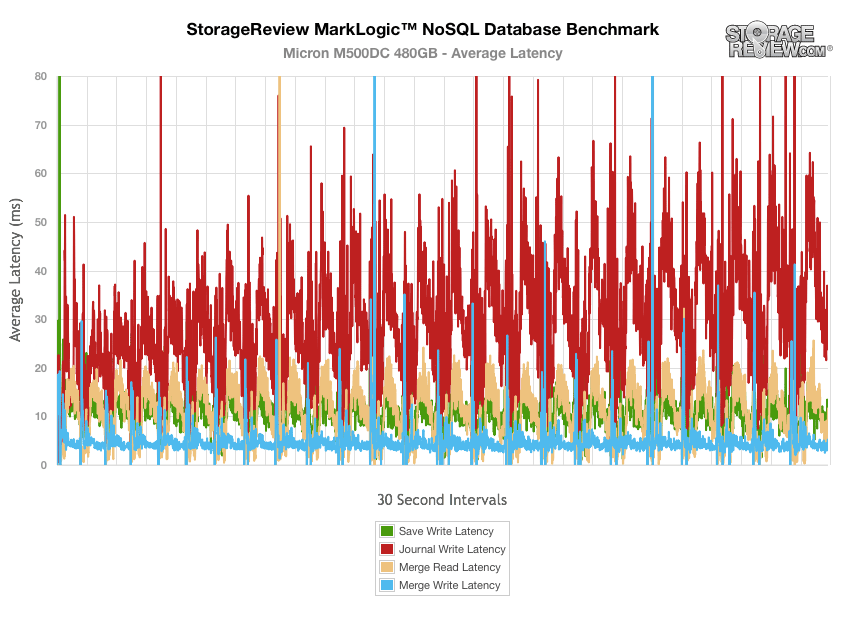
The latency results for most operations during the NoSQL benchmark remained at or below 60ms, however the M500DC did experience a moderate number of latency spikes which generally occurred during journal write operations.
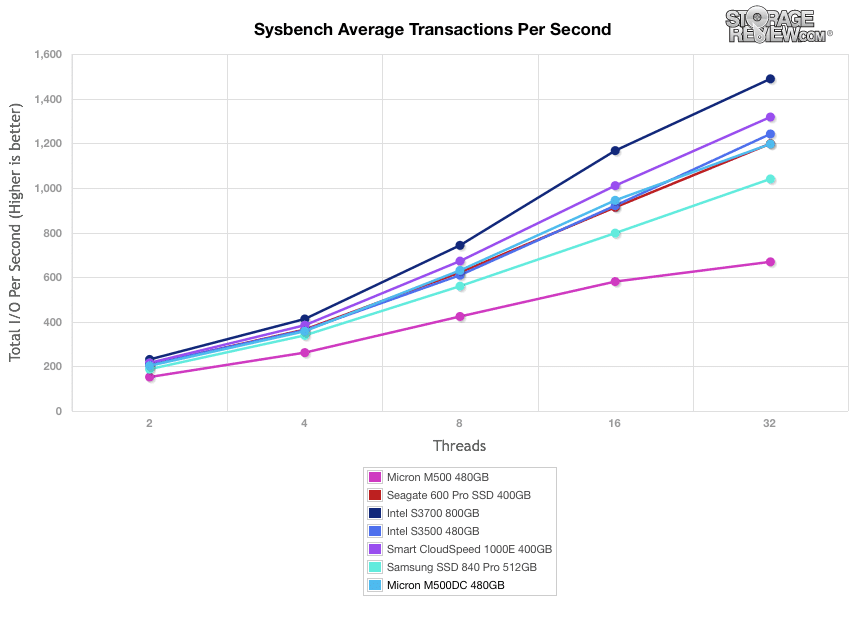
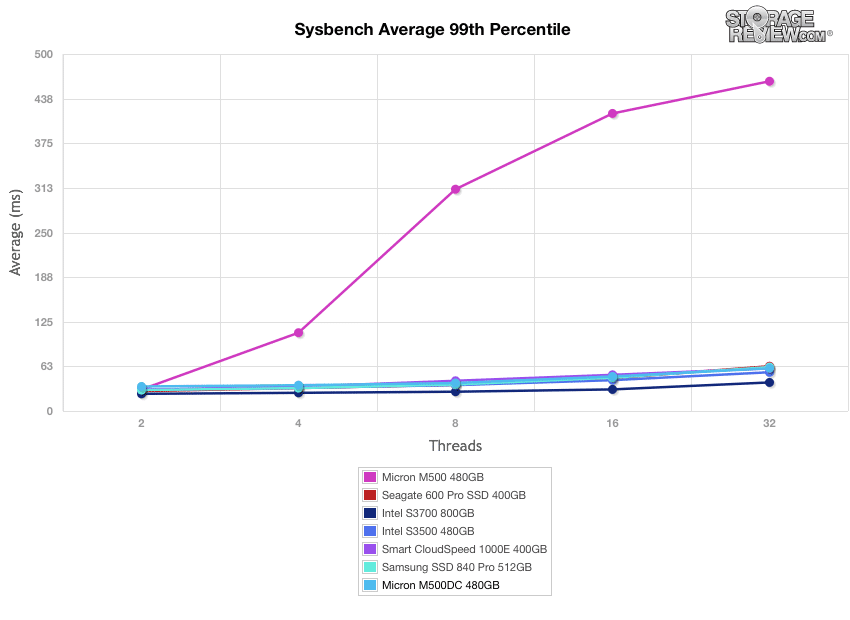
The next application benchmark consists of a Percona MySQL OLTP database measured via SysBench. In this configuration, we use a group of Lenovo ThinkServer RD630s as database clients and the database environment stored on a single drive. This test measures average TPS (Transactions Per Second), average latency, as well as average 99th percentile latency over a range of 2 to 32 threads. Percona and MariaDB are using the Fusion-io flash-aware application APIs in the most recent releases of their databases, although for the purposes of this comparison we test each device in their “legacy” block-storage modes.
The Micron M500DC remained in the middle of the pack throughout the MySQL benchmark, winding up at nearly 1,197 transactions per second at the toughest workload of 32 threads.
The M500DC maintained average latency results within the top half of the comparables during the MySQL benchmark.
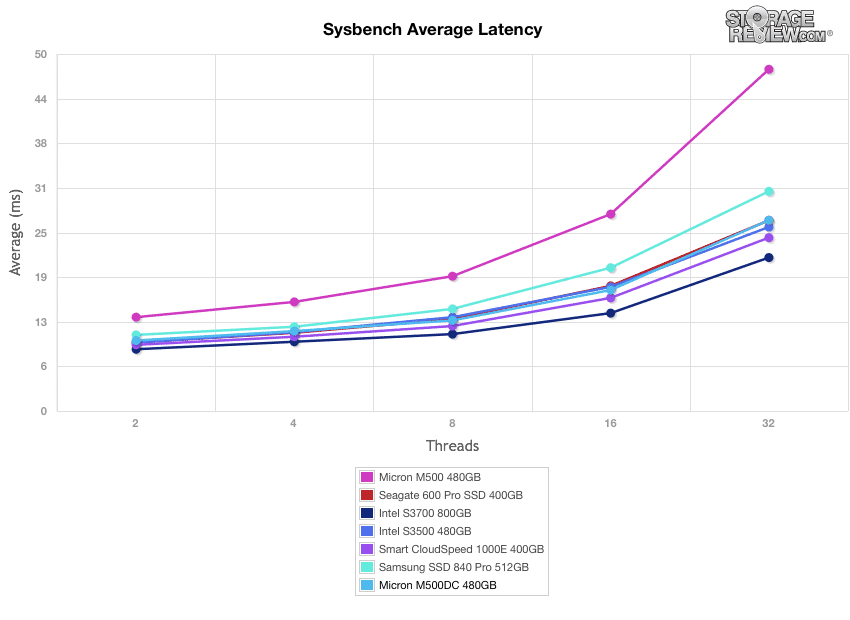
In our worst-case MySQL latency scenario, the Micron M500DC achieved a third-place result overall.
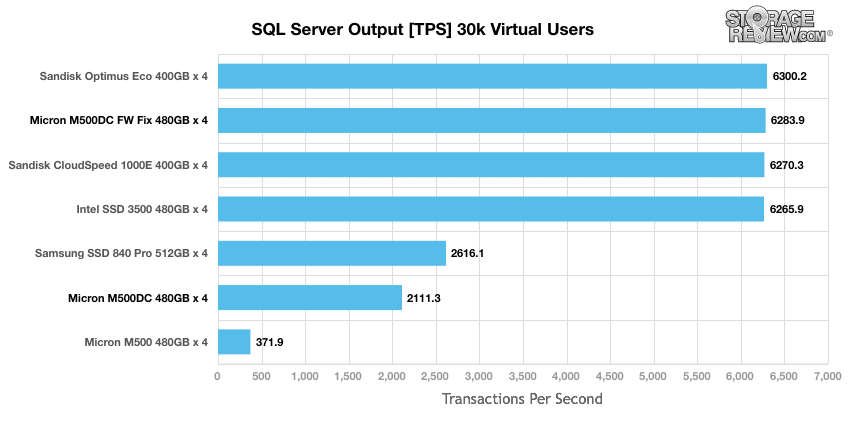
StorageReview’s Microsoft SQL Server OLTP testing protocol employs the current draft of the Transaction Processing Performance Council’s Benchmark C (TPC-C), an online transaction processing benchmark that simulates the activities found in complex application environments. The TPC-C benchmark comes closer than synthetic performance benchmarks to gauging the performance strengths and bottlenecks of storage infrastructure in database environments. Our SQL Server protocol uses a 685GB (3,000 scale) SQL Server database and measures the transactional performance and latency with a 30,000 VU Load.
In our SQL Server test, the Micron M500DC and M500 trailed the pack by a significant margin, coming in below the Samsung SSD 840 Pro, and the class-leading Intel and SanDisk offerings.
Update 5/13/2014:
Working in close collaboration with the team at StorageReview, Micron was able to quickly isolate a system-level bottleneck in our Windows Server 2012 SQL Server test platform and proactively provide a solution, which is now being built into the M500DC’s firmware. When retested in the same environment, the solution removed the bottleneck. With the newest firmware the M500DC came in with the highest TPS in the SATA group, trailing only the SAS SanDisk Optimus Eco.
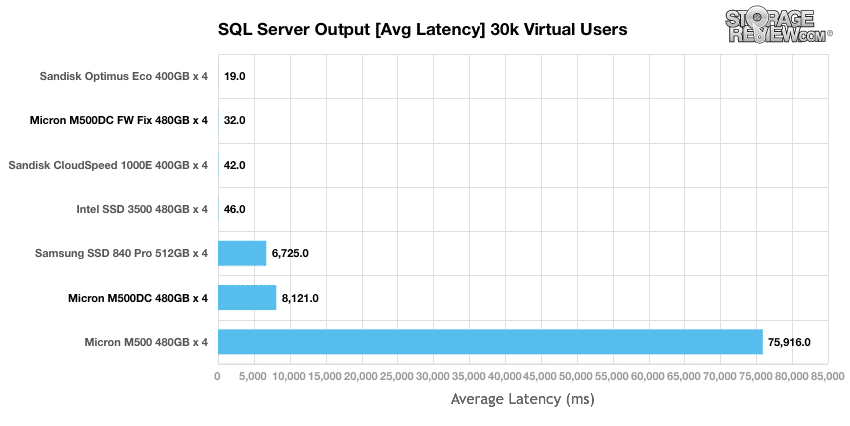
Switching our focus to the overall average latency, we being to see just how far the Micron M500DC and M500 trail the pack. While the SanDisk and Intel offers compete in the 19-464ms range, the Micron M500DC came in with exponetially higher latency measuring 8,121ms. This was better than the client-focused M500 which measured 75,916ms or 75 seconds average latency in this workload.
Update 5/13/2014: With the newest firmware applied to the M500DC, latency dramatically improved to an average of 32ms, leading the SATA comparable group.
Synthetic Workload Analysis
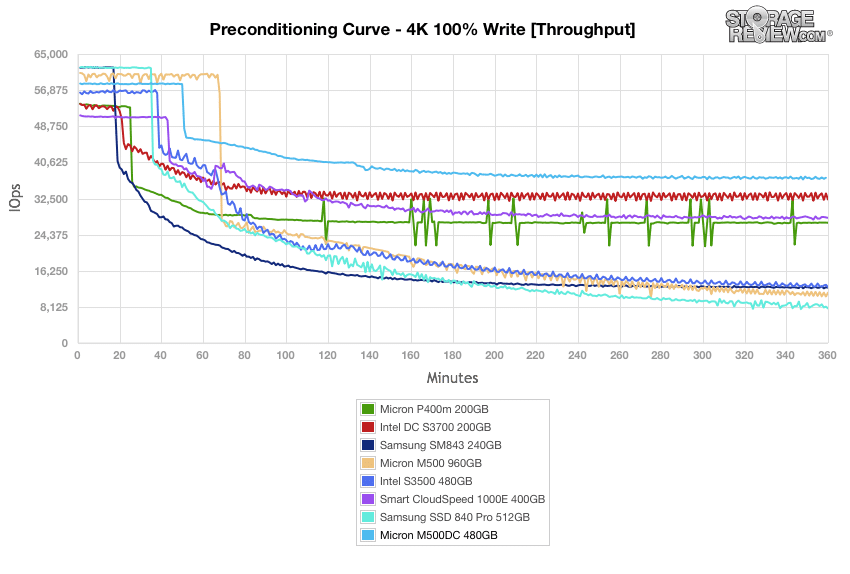
Our synthetic benchmark protocols each begin by preconditioning the target storage into steady-state with the same workload that will be used to test the device. The preconditioning process uses a heavy load of 16 threads with an outstanding queue of 16 per thread.
Preconditioning and Primary Steady-State Tests:
- Throughput (Read+Write IOPS Aggregate)
- Average Latency (Read+Write Latency Averaged Together)
- Max Latency (Peak Read or Write Latency)
- Latency Standard Deviation (Read+Write Standard Deviation Averaged Together)
Once preconditioning is complete, each device being compared is then tested across multiple thread/queue depth profiles to show performance under light and heavy usage. Our synthetic workload analysis for the Micron M500DC uses 4k, 8k, and 128k profiles which are widely used in manufacturer specifications and benchmarks.
- 4k Profile
- 100% Read and 100% Write
- 8K Profile
- 70% Read, 30% Write
- 100% 8K
During the preconditioning process, the Micron M500DC quickly emerged as the top performer among the comparable drives as it approached steady state near 37,000IOPS.
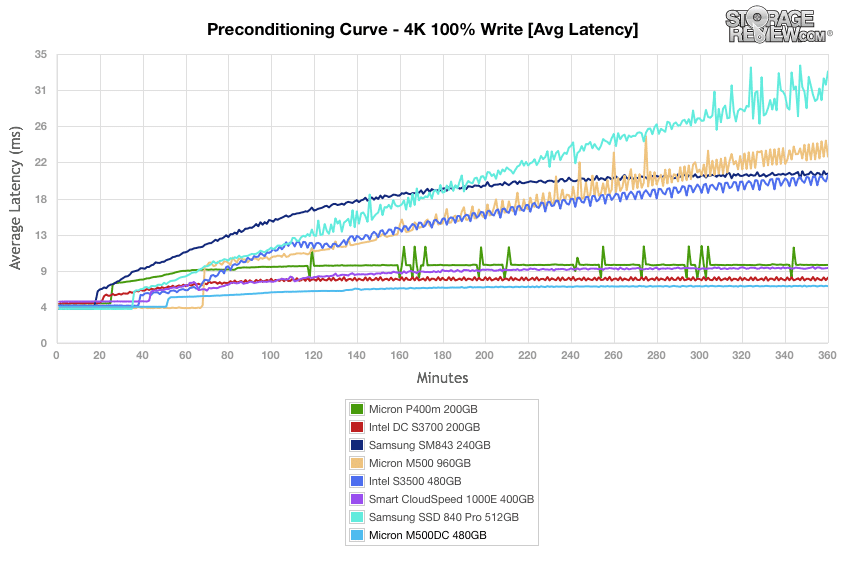
The Micron M500DC’s leading performance during 4k preconditioning also extended average latency, where the M500DC emerged with overall lowest latency after the first hour.
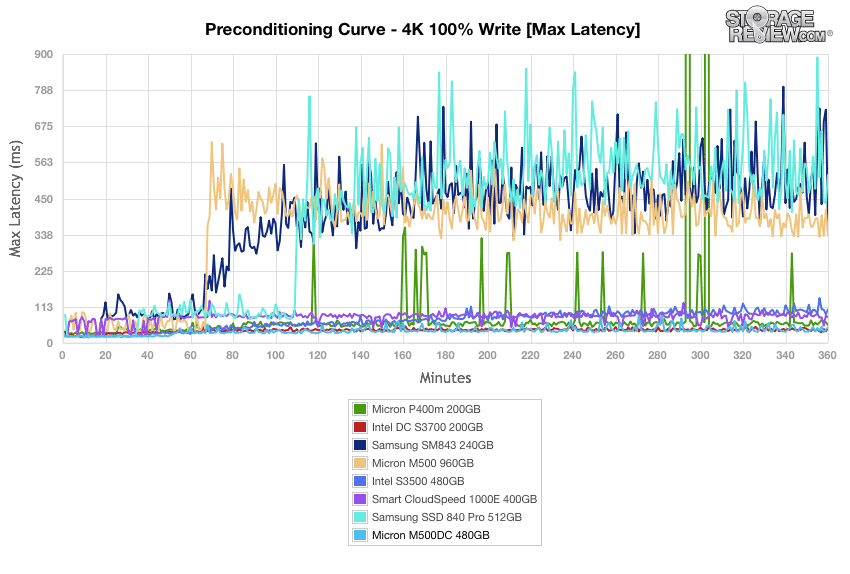
The Micron M500DC kept its maximum latency values within the best three comparables during 4k preconditioning, winding up just behind the Micron P400M and Intel’s DC S3700.
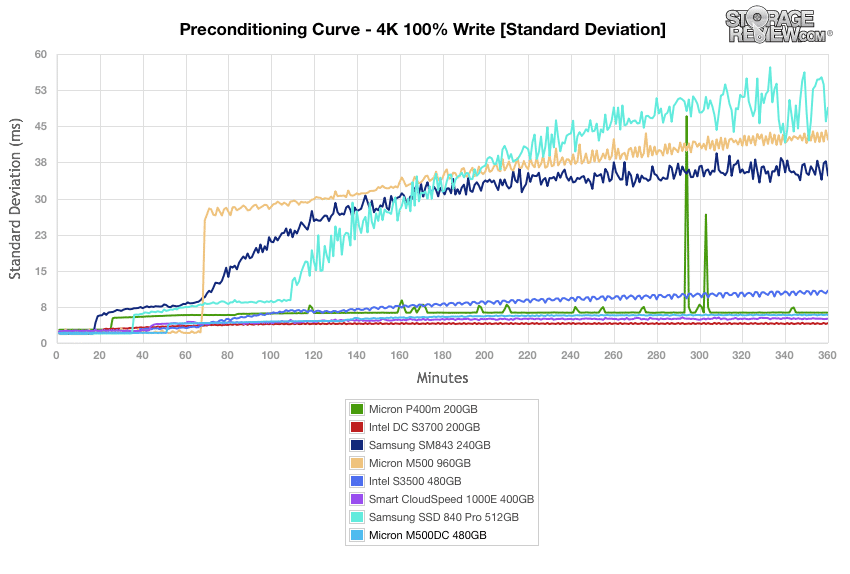
Our plot of standard deviation results from the 4k preconditioning process continue the M500DC’s strong performance with random 4k transfers, approaching 5.8ms at steady state.
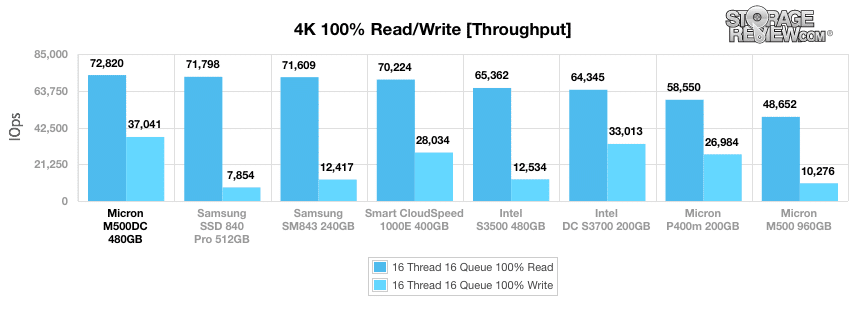
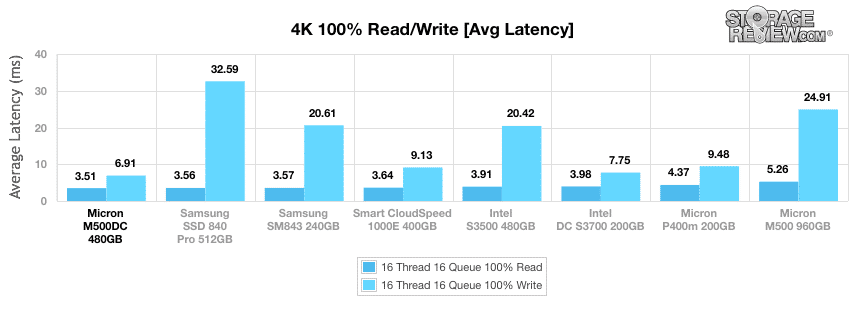
With 4k preconditioning complete, the Micron M500DC was able to reach 72,820IOPS for read operations and 37,041IOPS for write operations during the 4k profile. These throughput results place the M500DC at the top of our comparables.
At steady state, Micron’s M500DC averaged 3.51ms of latency for read operations and 6.91ms for write operations. Both results again place the M500DC at the top of our comparables.
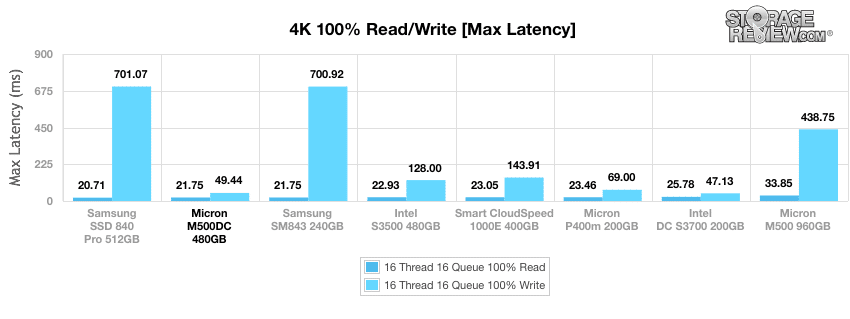
The maximum read latency recorded during the 4k benchmark of the M500DC was 21.75ms, tied for second lowest among comparables. The M500DC’s maximum 4k write latency was limited to 49.44ms, best in this class to date.
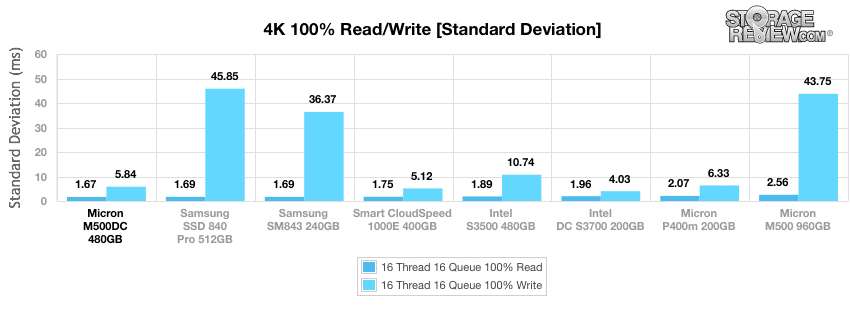
Calculating the standard deviation of the 4k latency results demonstrates the tight latency tolerance of the M500DC although it did not achieve the best overall results by this measurement.
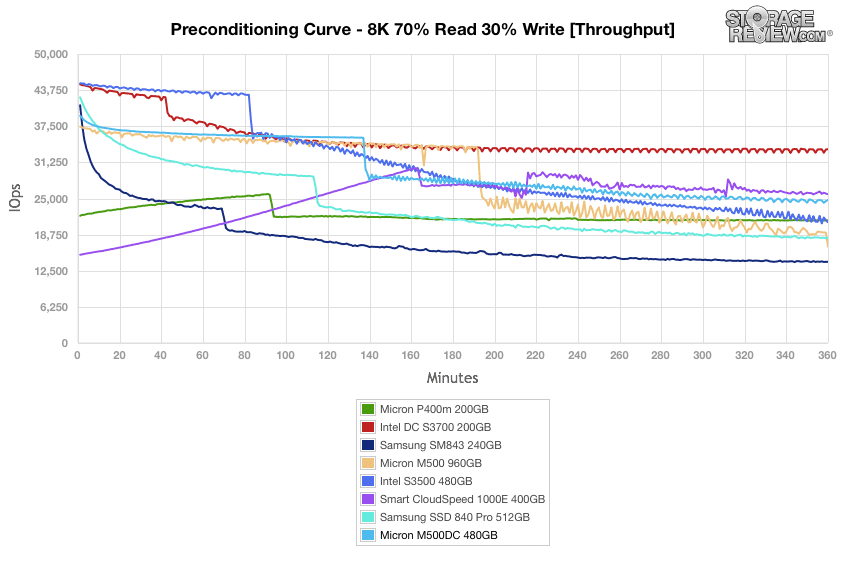
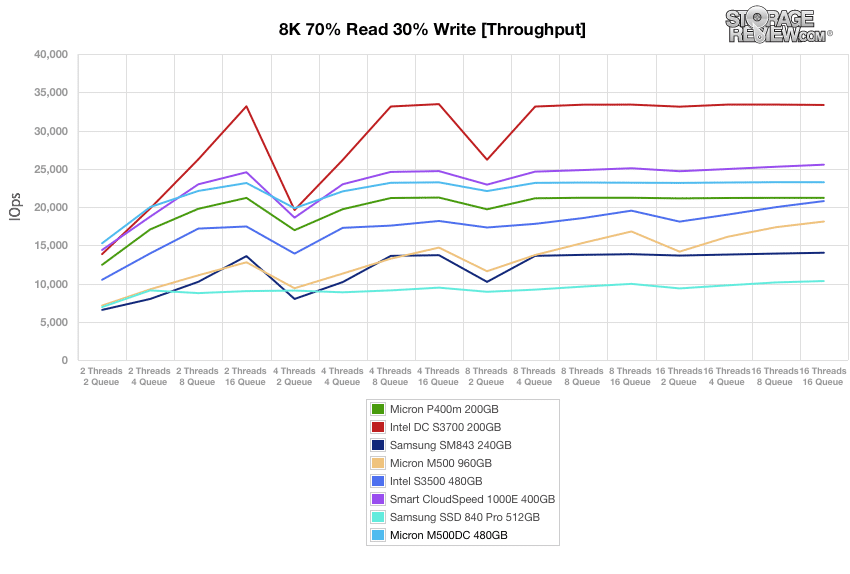
After the initial burst of performance during preconditioning for 8k transfers and a workload of 70% read operations and 30% write operations, the M500DC settled into a third-place throughput performance.
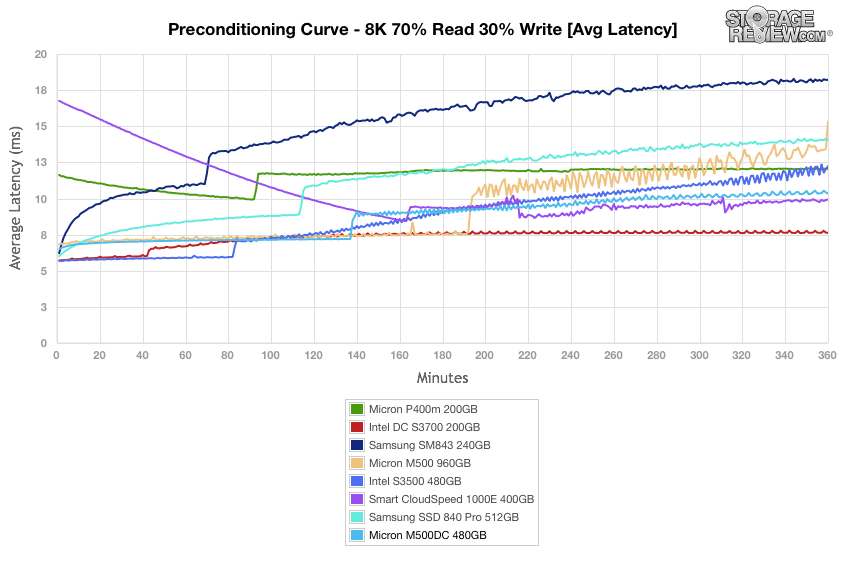
The average latency of the Micron M500DC approached 11ms during preconditioning for the 8k 70/30 profile.
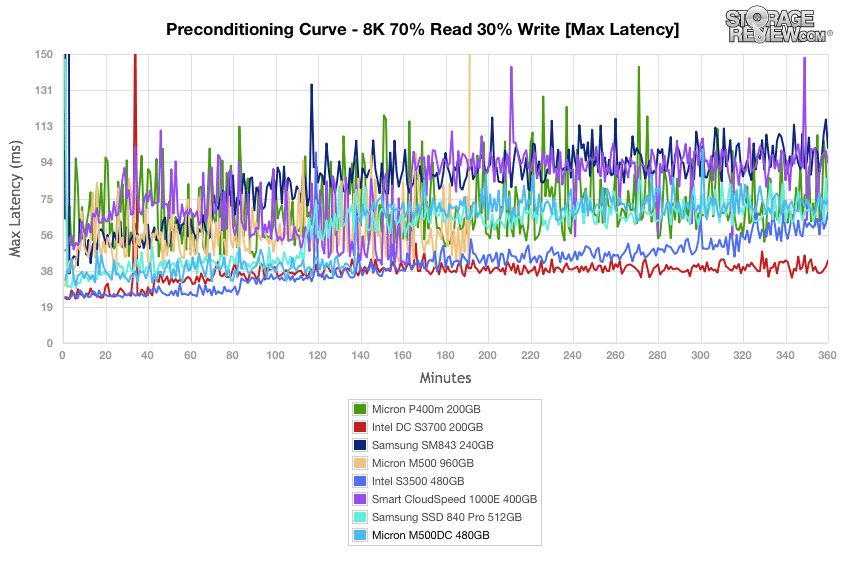
8k 70/30 maximum latency results during preconditioning did not reveal any significant trouble spots for the M500DC which continued its strong but not leading performance among the comparables.
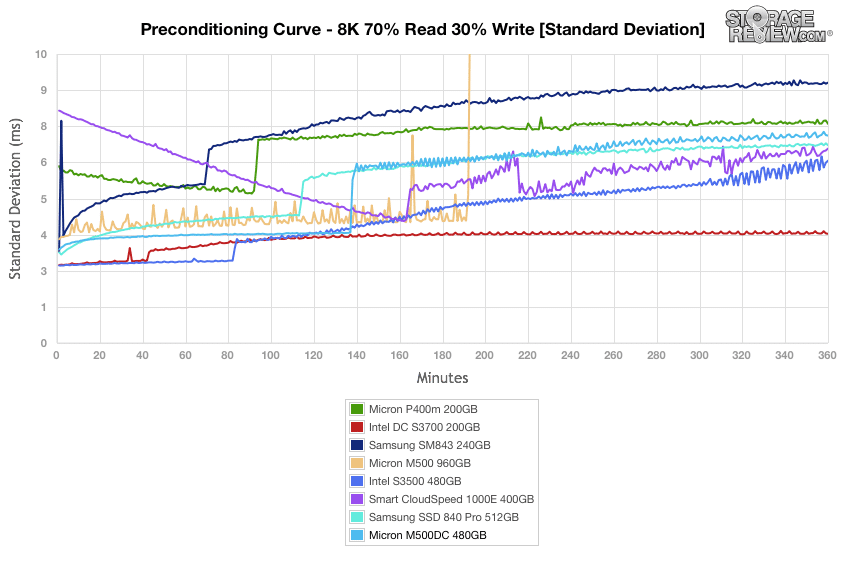
Standard deviation calculations during the 8k 70/30 preconditioning process shows the M500DC approaching 7.5ms at steady state.
With 8k 70/30 preconditioning complete, the Micron M500DC maintained a third place overall result for throughput, and did not experience any performance drops across the range of thread counts and queue depths used during this profile.
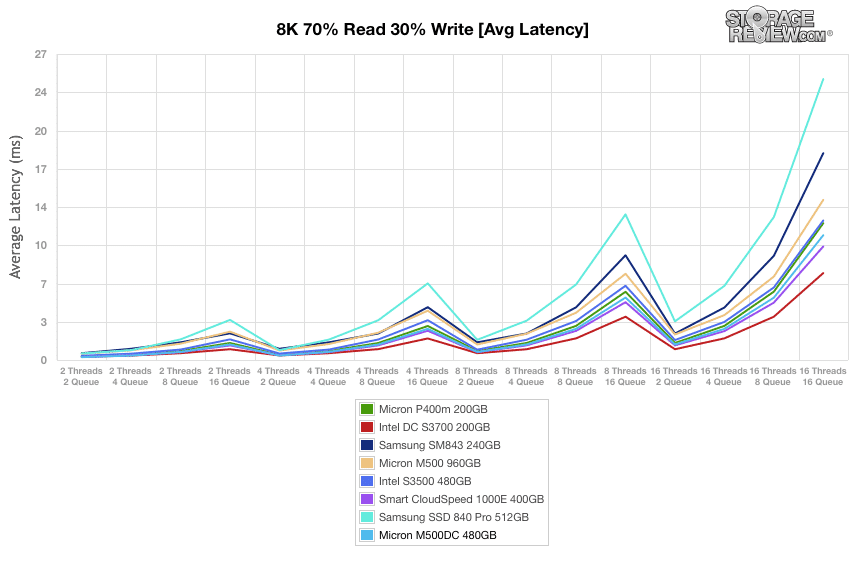
The Micron M500DC’s third place throughput result was echoed during our measurements of average latency during the 8k 70/30 profile.
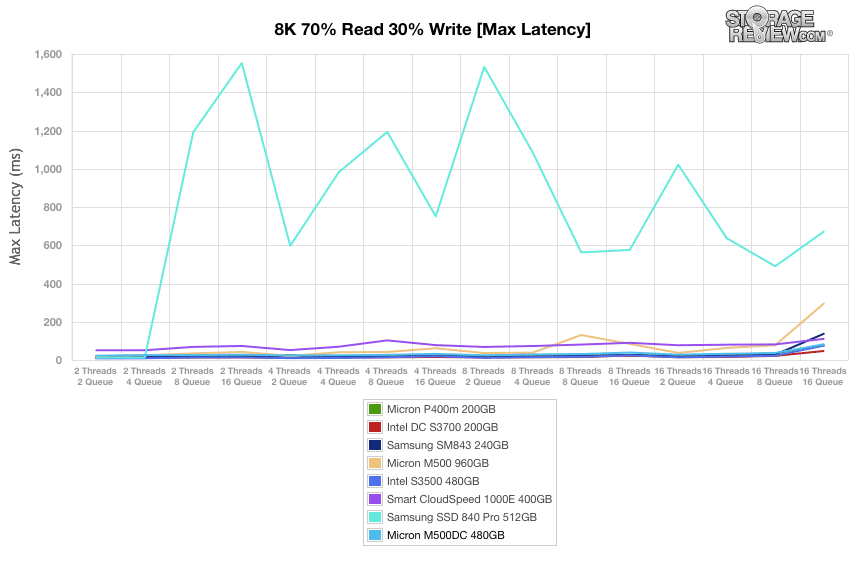
Maximum latency results from the 8k 70/30 protocol do not reveal any trouble spots for the Micron M500DC, with no result above 7.89ms.
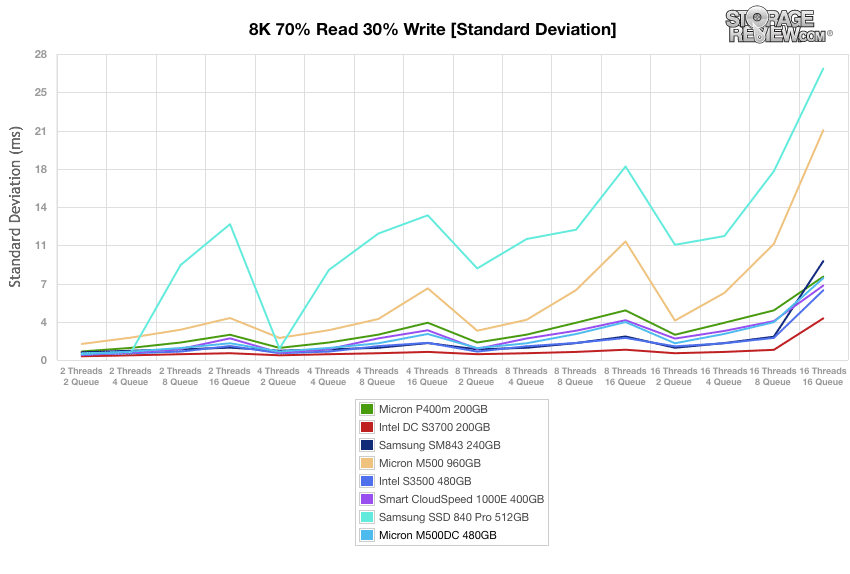
Our standard deviation calculations reinforce the consistent latency performance of the M500DC during the 8k 70/30 profile.
Conclusion
The M500DC Enterprise SSD combines Micron’s expertise in NAND engineering and manufacturing, Marvell controllers, and the Micron XPERT technology stack. The M500DC targets the light-enterprise use case which generally consists of server boot duty, read-centric activities like media streaming or other application use that is generally read intensive. Deployments of the M500DC also get an array of enterprise features, like power fail protection, that aren’t found in the low cost client drives that often creep into this space.
When it comes to living up to Micron’s performance claims, the M500DC has no trouble matching the rated synthetic results that Micron advertises. Those showed the M500DC to be a strong competitor in the 4k and 8k 70/30 workloads but our application testing showed a mixed picture. During our MarkLogic NoSQL workload the Micron M500DC trailed the SanDisk and Intel comparables with latency 5.5 times higher. It also came in below the popular Samsung SSD 840 Pro which some enterprise buyers have been turning to in the read-heavy market segment. Turning to our Sysbench MySQL TPC-C test, the Micron M500DC came in middle of the pack, again trailing the Intel and SanDisk models.
Thankfully when it came to the ragged initial performance we saw in SQL, Micron was able to identify the problem and provide us with beta firmware to resolve. It will take a little while for the firmware to go GA, but when it does, the difference is night and day in certain Microsoft environments. Our new data with updated firmware shows the M500DC performing at the top of the pack for SQL Server. The Micron drive is also expected to be less expensive than some of the competition the light enterprise space, so depending on cost, the M500DC may see a solid IOPS/$ benefit too.
Pros
- Strong results across our range of synthetic benchmarks, particularly with 4k transfers
- Value pricing
- Quality components
- Update 5/13/2014: Fantastic SQL Server performance
Cons
- Incredibly high latency in SQL Server workloads Update 5/13/2014: Working with StorageReview, Micron has improved SQL Server performance
- Trails the Intel and SanDisk comparables in MarkLogic NoSQL testing
The Bottom Line
The M500DC Enterprise SSD demonstrates Micron’s in-house engineering and manufacturing resources, which in this case created a drive with quality components. After Micron made a fix in drive firmware, it now posts fantastic SQL Server performance to match its admirable synthetic benchmark results.


 Amazon