

The Optimus Eco uses SanDisk’s Guardian Technology Platform to improve the performance characteristics for 19nm multi-level cell (MLC) flash in order to suit read-intensive application workloads in capacities of 400GB, 800GB, 1.6TB, and 2TB. The Guardian Technology Platform was part of SanDisk’s recent acquisition of SMART Storage Systems, which also put the platform to good use last year in our review of the Optimus SAS Enterprise SSD. The Optimus Eco represents a different use profile and different NAND than the Optimus but still achieves solid results across our benchmarks, flexibility that helps explain the appeal that SMART’s MLC technology and engineering resources have for SanDisk.
According to SanDisk benchmarks, the Optimus Eco an achieve random read/write performance up to 90K/35K IOPS and sustained read/write speeds of up to 500/500 MB/s, which we will be comparing to both synthetic benchmarks and benchmarks simulating various real-world enterprise workloads in the StorageRevew Enterprise Test Lab. Optimus Eco also includes support for wide-port SAS capability providing up to 1 GB/s sustained read performance for hosts that support it. The Optimus Eco is powered by SanDisk’s Guardian Technology Platform, a suite comprised of FlashGuard, DataGuard and EverGuard technologies that work in concert to provide performance and endurance suitable for enterprise applications.
FlashGuard Technology allows the Optimus Eco’s 19nm consumer-grade MLC flash to deliver three random or seven sequential drive writes per day. FlashGuard treats each cell individually to maximize utilization of stronger flash elements and minimizing wear on weaker elements with two key technologies: Aggregated Flash Management and Advanced Signal Processing. Aggregated Flash Management technology prolongs the life of MLC by managing flash elements as a system instead of as a collection of discrete elements, meaning that endurance management of the flash can be coordinated over multiple pages within a block and coordinated over multiple blocks within the SSD. Advanced Signal Processing continually monitors the flash to analyze its performance and dynamically match the controller’s operating parameters to current conditions.
SanDisk Optimus Eco SAS Specifications
- Interface: SAS 6Gb/s
- Interface Ports: Dual/Wide
- Sustained Read/Write: 500/500 MB/s (Dual) or 1GB/s (Wide Port)
- Random Read/Write (IOPS): Up to 90K/35K IOPS
- Capacities
- SDLKGD6M-400G-5CA1: 400GB
- SDLKGC6M-800G-5CA1: 800GB
- SDLLGC6M-016T-5CA1: 1.6TB
- SDLLGC6M-020T-5CA1: 2TB
- Sector Sizes: 512, 520, 528 byte
- Data Reliability: 1 unrecoverable error in 10e17 bits read
- MTBF: 2.5M hours
- Sequential Workload Endurance: 3 DWPD
- Random Workload Endurance: 7 DWPD
- Data Fail Recovery: F.R.A.M.E. (Flexible Redundant Array of Memory Elements)
- Power Fail Recovery: EverGuard Backup Power Circuitry
- Data Path Protection: DataGuard, T-10 DIF
- Warranty: 5 years
- Security: TCG Enterprise Compliant
- Encryption: AES 256-bit
- Vcc Power Supply: 5V/12V
- Active Power Consumption (Typ): 7W
- Shock: 1000 g half-sine, 0.5 msec, 3 shocks along each axis X, Y, Z in each direction
- Vibration: 2.17 g rms, 7-800 Hz
- Operating Temperature: 0°C to 70°C (internal)
- Storage Temperature: -40°C to 90°C
- Humidity: 5% to 95%, non-condensing, relative humidity
- Altitude: 5,486m (18,000ft)
- Mechanical
- Length: 100.20mm
- Width: 69.85mm
- Height: 9.5mm/15mm
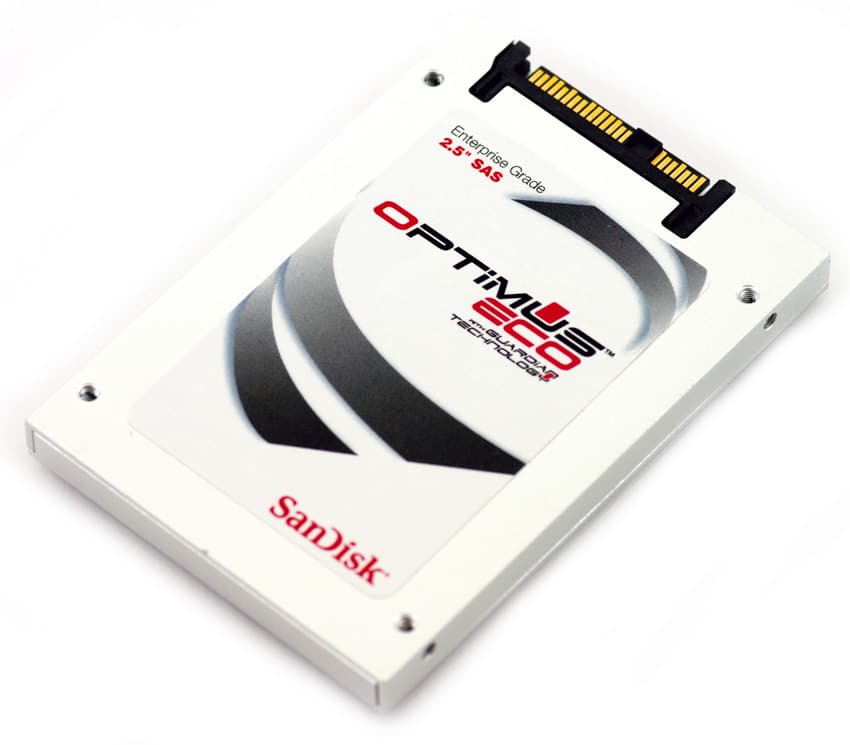
Design and Build
Like the Optimus, the Optimus Eco is offered in a 9.5mm form factor for smaller capacities and 15mm form factor for its larger capacity variations. The 400GB edition measures 9.5mm in thickness, and like the Optimus is enclosed by a CNC-manufactured alloy that helps dissapate heat.
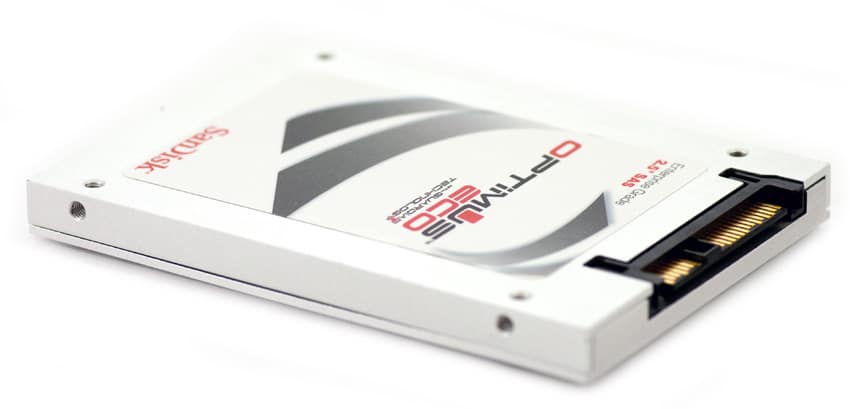
The SanDisk Optimus Eco supports both dual and wide SAS interfaces.
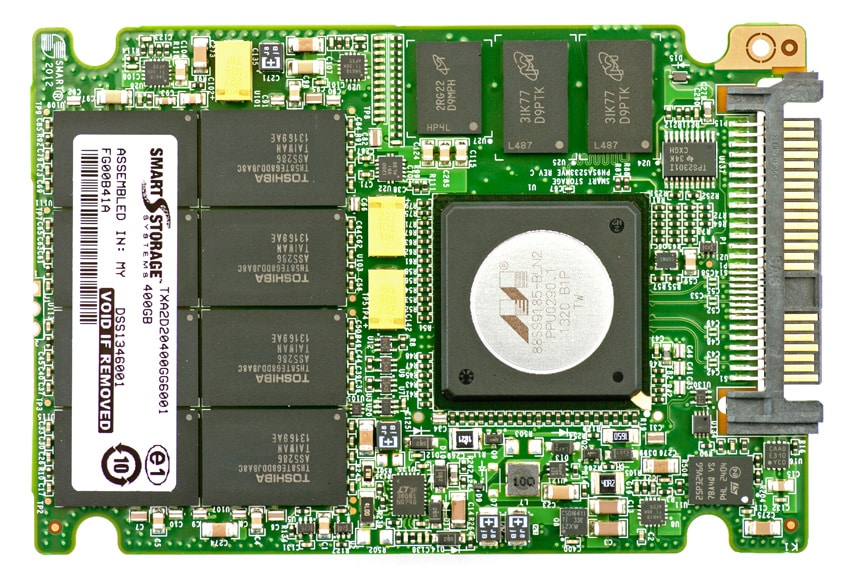
Third-generation EverGuard technology incorporated in the Optimus Eco utilizes an array of capacitors to ensure data is transferred from the write cache to flash during power interruptions.
Testing Background and Comparables
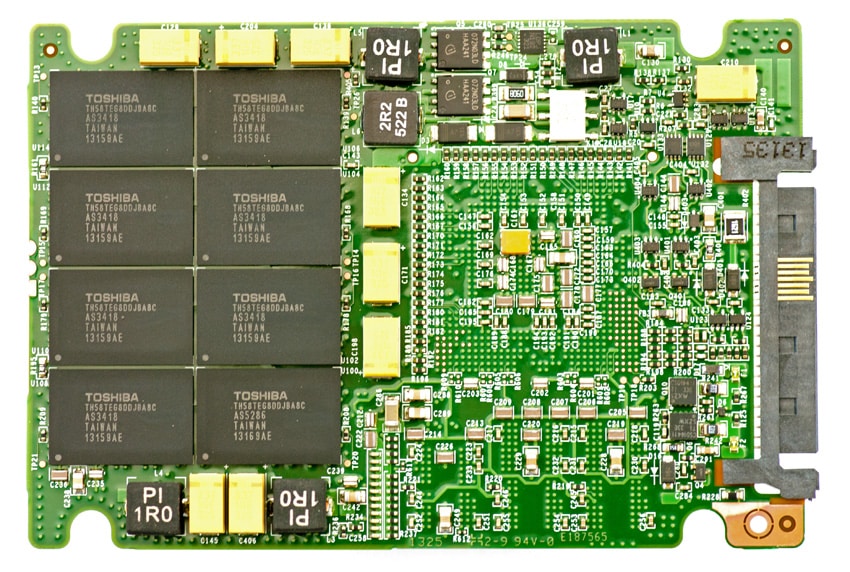
The Optimus Eco uses a Marvell 88SS9185 controller with 19nm Toshiba NAND with an interface that provides both dual and wide SAS connectivity. Now that MLC flash is well-established in the enterprise marketplace, there are a growing variety of comparable drives available to evaluate the Optimus Eco against.
Comparables for this review:
- Hitachi SSD400M (400GB, Intel EW29AA31AA1 controller, Intel 25nm MLC NAND, 6.0Gb/s SAS)
- Hitachi SSD800M (800GB, Intel co-branded DB29AA11B0 controller, Intel 25nm MLC NAND, 6.0Gb/s SAS)
- STEC s842 (s840 series) (800GB, STEC 24950-15555-XC1 controller, Toshiba MLC NAND, 6.0Gb/s SAS)
- SanDisk Optimus (400GB, third-party controller, Toshiba 34nm MLC NAND, 6.0Gb/s SAS)
- Toshiba PX02SM (400GB, Marvell co-branded TC58NC9036GTC controller, Toshiba 24nm MLC NAND, 6.0Gb/s SAS)
- Toshiba eSSD (400GB, Marvell 88SS9032 controller, Toshiba 32nm SLC NAND, 6.0Gb/s SAS)
- OCZ Talos 2 R (400GB, SandForce SF-2500 controller, Intel 25nm MLC NAND, 6.0Gb/s SAS)
The Optimus Eco SAS and its comparables were benchmarked on our second-generation enterprise testing platform based on a Lenovo ThinkServer RD630. This Linux-based testing platform incorporates LSI 9207-8i HBA interconnect hardware as well as I/O scheduling optimizations for best-case flash performance. For our synthetic benchmarks, we utilize FIO version 2.0.10 for Linux and version 2.0.12.2 for Windows.
- 2 x Intel Xeon E5-2620 (2.0GHz, 15MB Cache, 6-cores)
- Intel C602 Chipset
- Memory – 16GB (2 x 8GB) 1333Mhz DDR3 Registered RDIMMs
- Windows Server 2008 R2 SP1 64-bit, Windows Server 2012 Standard, CentOS 6.3 64-Bit
- 100GB Micron RealSSD P400e Boot SSD
- LSI 9211-4i SAS/SATA 6.0Gb/s HBA (For boot SSDs)
- LSI 9207-8i SAS/SATA 6.0Gb/s HBA (For benchmarking SSDs or HDDs)
- Mellanox ConnectX-3 10GbE PCIe 3.0 Adapter
- Mellanox ConnectX-3 InfiniBand PCIe 3.0 Adapter
Application Performance Analysis
StorageReview recently debuted two new application performance benchmarks for enterprise SSDs: our proprietary MarkLogic NoSQL Database Storage benchmark and a SysBench OLTP MySQL benchmark.
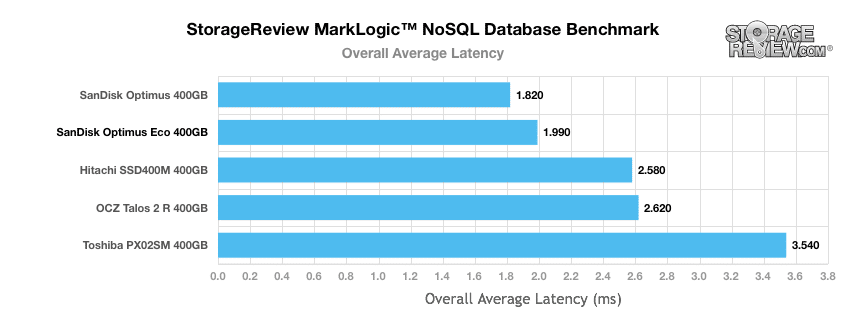
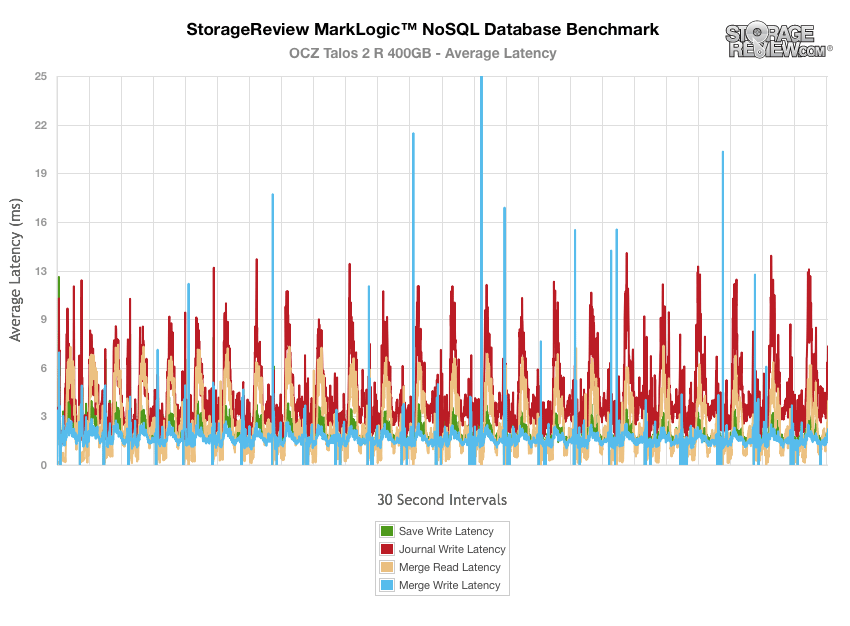
Our MarkLogic NoSQL Database environment requires groups of four SATA or SAS SSDs with a usable capacity of at least 200GB, since the NoSQL database requires roughly 650GB of space to work with across four database nodes. Our protocol uses an SCST host and presents each SSD in JBOD, with one allocated per database node. The test repeats itself over 24 intervals, requiring between 30-36 hours total for the SSDs in this class. MarkLogic records total average latency as well as interval latency for each SSD.
MarkLogic’s analysis of overall average latency during the NoSQL benchmark places the Optimus Eco just behind the SanDisk Optimus, giving it the second-lowest overall average latency among the comparables.
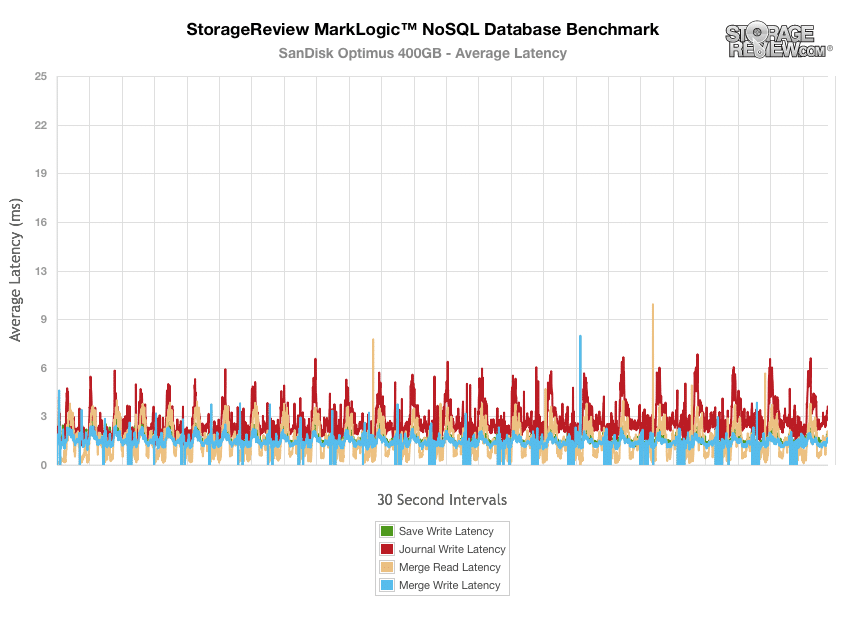
Detailed charts of the SanDisk Optimus’ latency performance show most operations keeping at or below 6ms, with a handful of small spikes reaching between 7ms and 11ms.
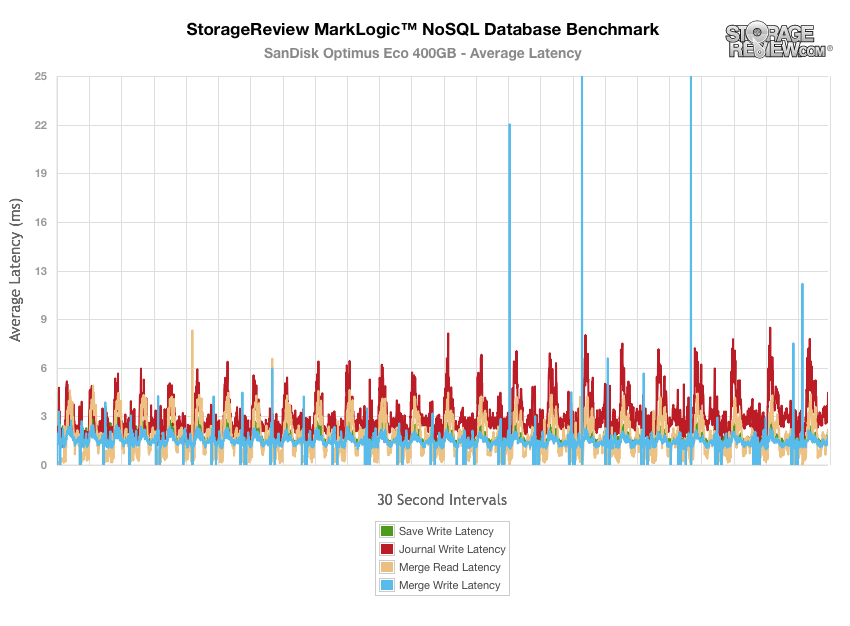
The SanDisk Optimus Eco is not able to manage NoSQL latency performance as consistently as its Optimus ccousin, with a number of merge write latencies with much worse latency than the otherwise very consistent latency profile of the Optimus Eco.
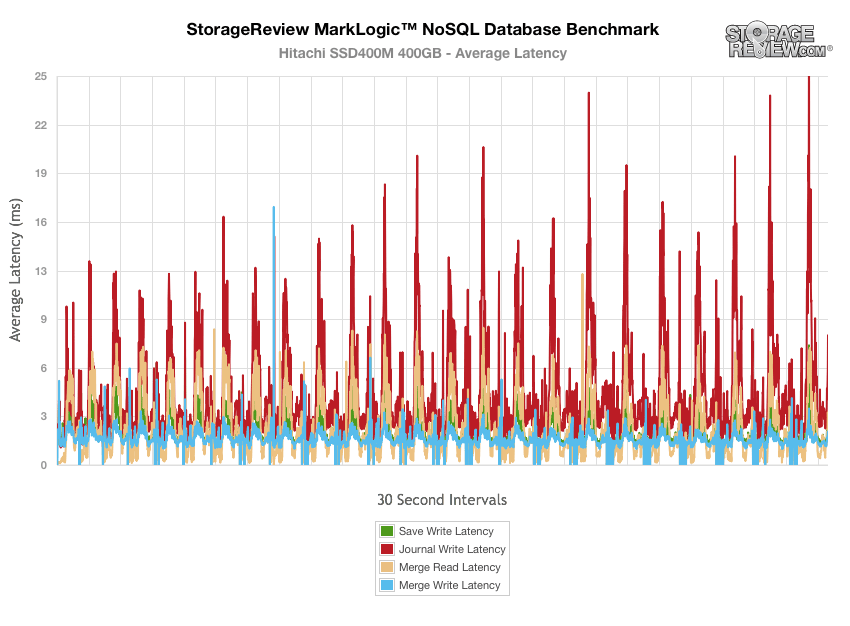
Hitachi’s Ultrastar SSD400M had greater variation in latency than both SanDisk comparables, with the greatest latencies experienced during NoSQL journal write operations.
The OCZ Talos 2 R had similar overall performance to the SSD400M, with latency peaks between 9-32ms, however its highest peaks occurred during merge write operations.
The Toshiba PX02SM had by far the worst performance in the NoSQL benchmark, with journal write latencies ranging from 10-30ms
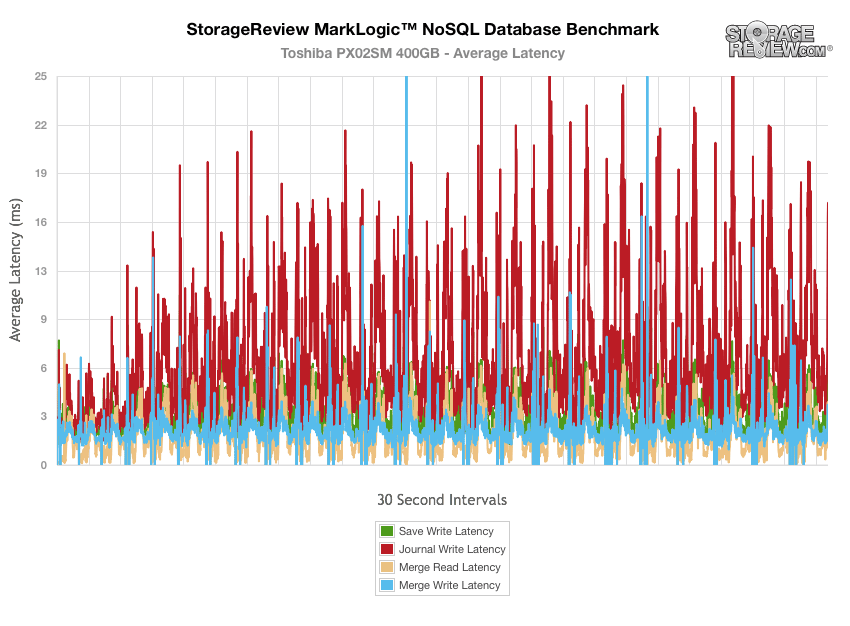 .
.
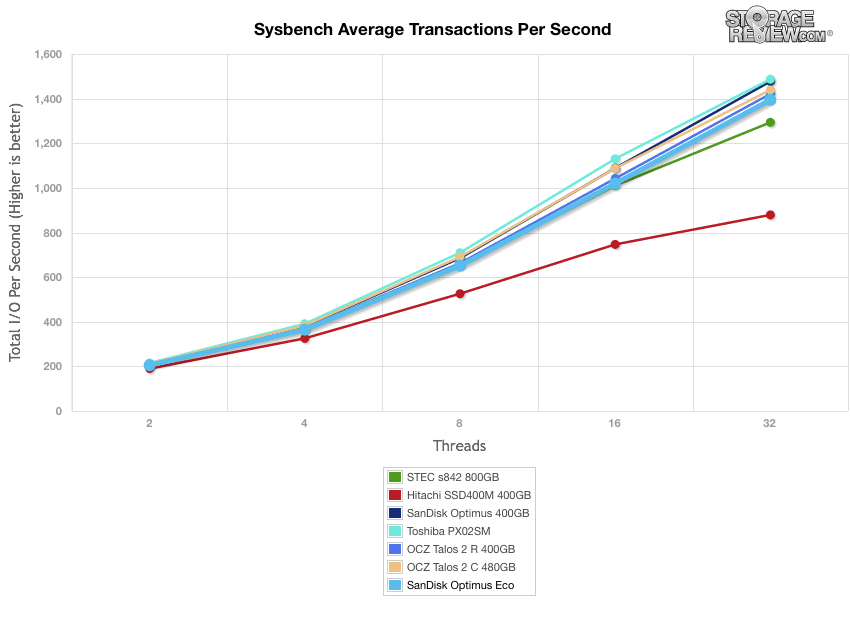
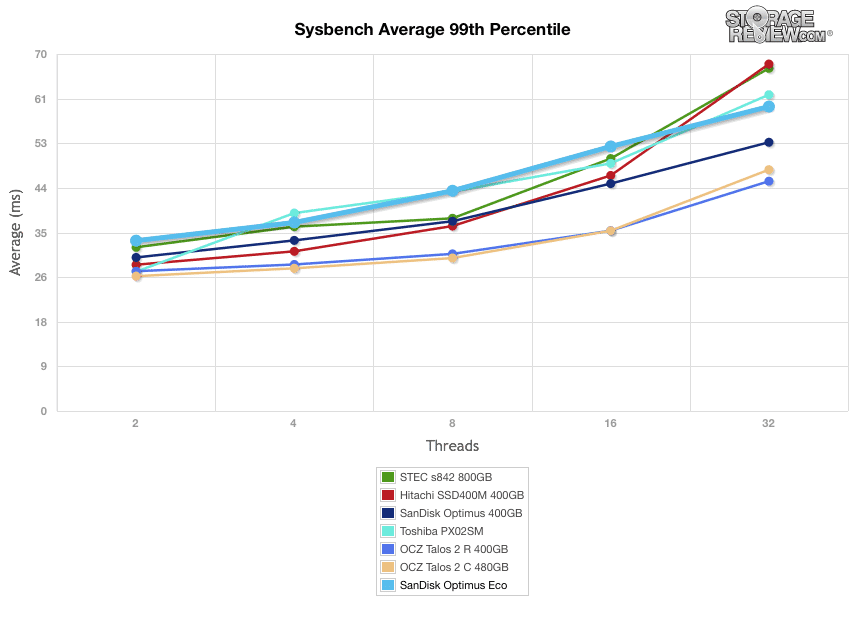
The second round of application benchmarks is conducted via SysBench, which uses an OLTP workload to measure the performance of a MySQL database running the InnoDB engine. In this testing configuration, we use a group of Lenovo ThinkServer RD630s running CentOS to drive the workload utilizing a single drive. This test measures average TPS (Transactions Per Second), average latency, as well as average 99th percentile latency over a range of 2 to 32 threads.
The Optimus Eco performed in the middle of the pack when measuring average transactions per second (TPS) in Sysbench, reaching 1395TPS with the workload scaled up to 32 threads.
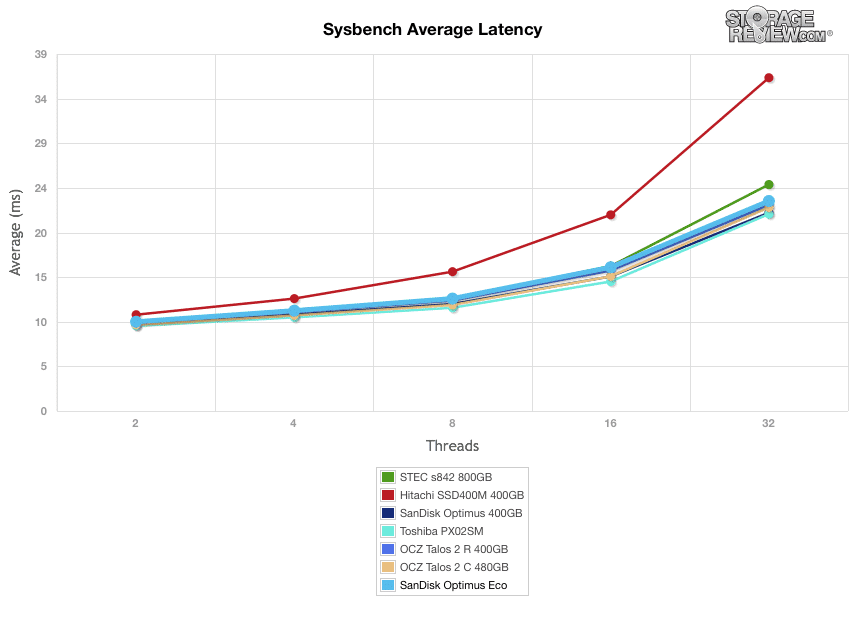
The SanDisk Optimus Eco also holds its own in our measurements of average latency during the MySQL benchmark, but does not distinguish itself among the comparables.
Charting worst-case 99th percentile latency, the SanDisk Optimus Eco struggles most during the 8 thread and 16 thread workloads, but does not perform particularly well at any scale compared to the other eMLC SSDs we have benchmarked.
Enterprise Synthetic Workload Analysis
Flash performance varies as the drive becomes conditioned to its workload, meaning that flash storage must be preconditioned before each test in order to ensure that the benchmarks are accurate. Each of the comparable drives are secure erased using the vendor’s tools and preconditioned into steady-state with a heavy load of 16 threads and an outstanding queue of 16 per thread.
Preconditioning and Primary Steady-State Tests:
- Throughput (Read+Write IOPS Aggregate)
- Average Latency (Read+Write Latency Averaged Together)
- Max Latency (Peak Read or Write Latency)
- Latency Standard Deviation (Read+Write Standard Deviation Averaged Together)
Once preconditioning is complete, each device is then tested in intervals across multiple thread/queue depth profiles to show performance under light and heavy usage. Our Enterprise Synthetic Workload Analysis for the Optimus Eco includes two profiles developed to make it easier to compare to our past benchmarks as well as widely-published enterprise drive performance specifications such as max 4k read and write speed and 8k 70/30.
- 4k
- 100% Read or 100% Write
- 8k 70/30
- 70% Read, 30% Write
- 100% Read or 100% Write
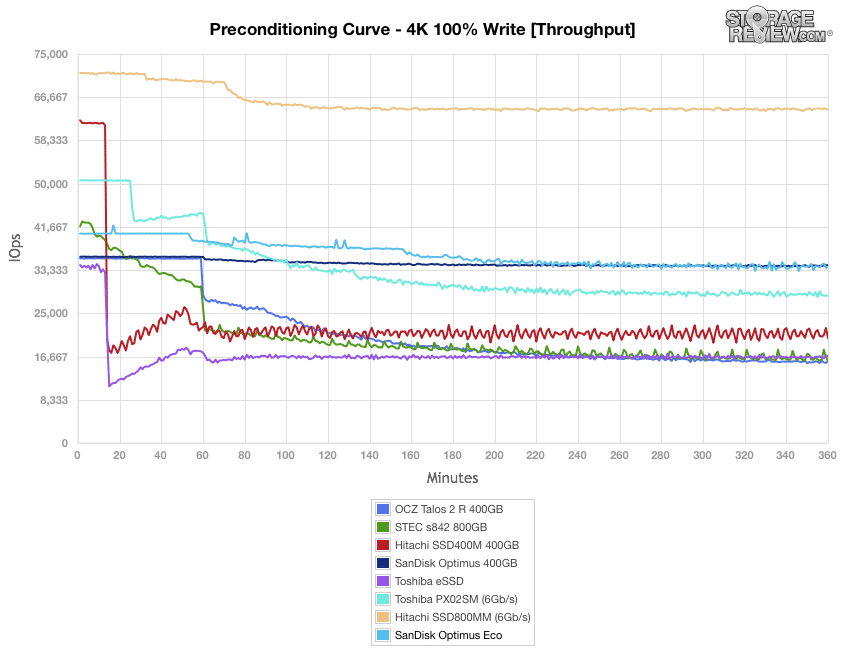
The Optimus Eco delivered strong throughput results throughout our 4k preconditioning process, wind up in a dead heat with the Optimus for second place as the curve approaches steady state.
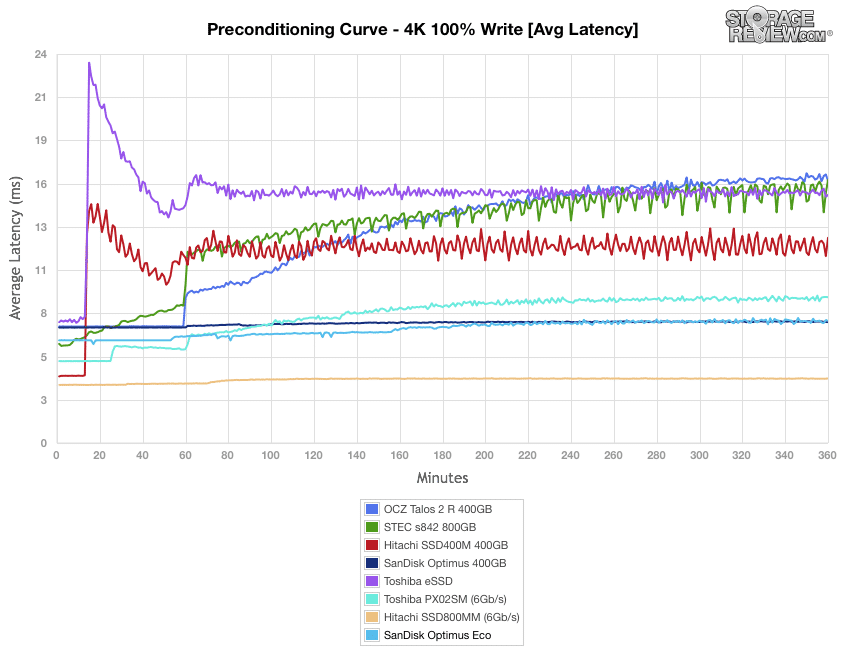
The Optimus Eco began 4k preconditioning with a middling average latency of 6.3ms but did not experience the latency increases that most of the comparable drives hit at around an hour into the workload. The Optimus Eco finished 4k preconditioning with an average latency of 7.5ms, again effectively tied with the Optimus for second lowest after the Hitachi SSD800MM.
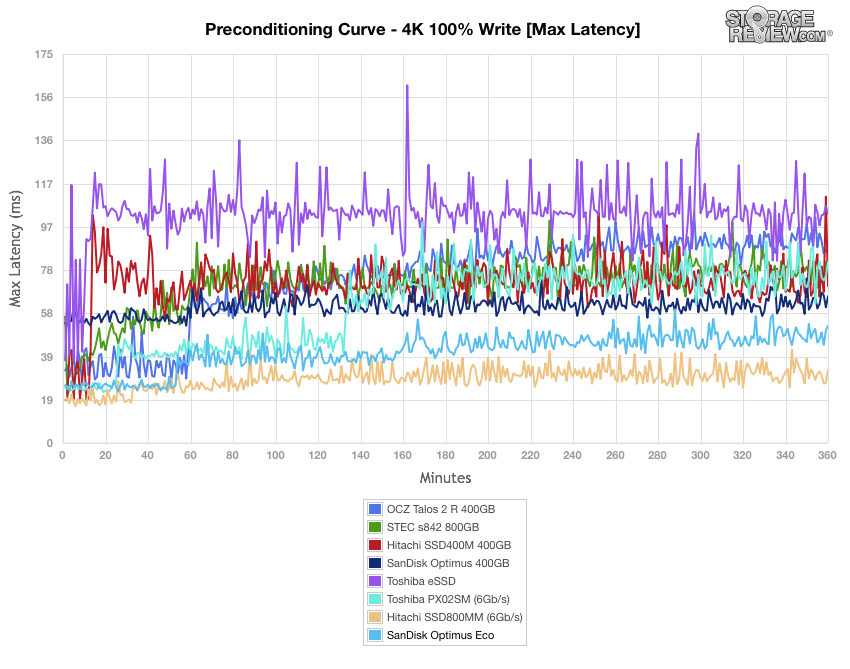
The maximum latency results during 4k preconditioning reveal a strong point of the Optimus Eco’s performance. At the beginning of the process, the Optimus Eco does not achieve notable results, but by the end of preconditioning the Optimus Eco consistently attains the second-lowest maximum latencies behind only the Hitachi SSD800MM.
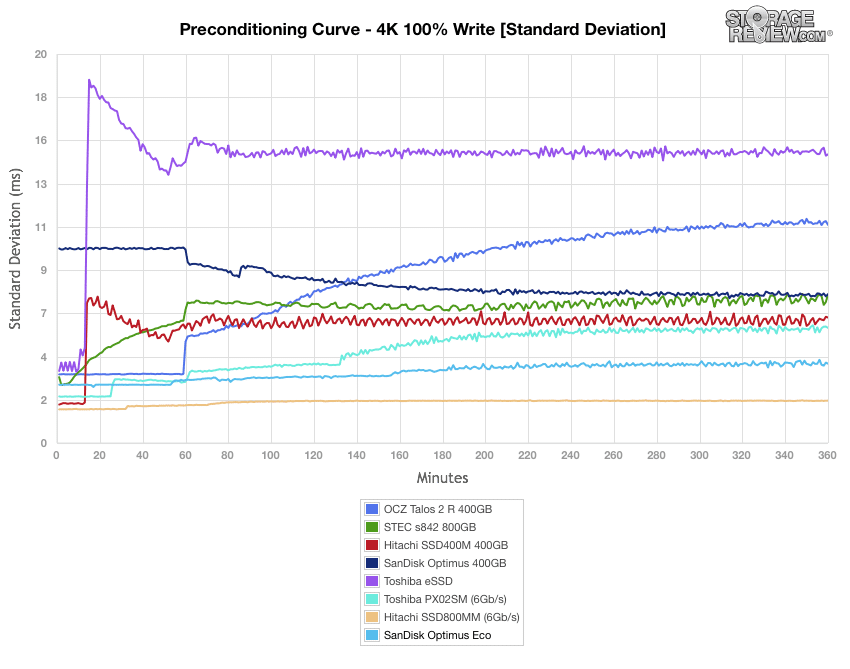
Charting latency standard deviation during the 4k preconditioning curve provides a clearer way to examine how consistent the Optimus Eco performs with this workload. The Optimus Eco experiences relatively small increases in standard deviation during the six-hour preconditioning window, winding up again second to the Hitachi SSD800MM.
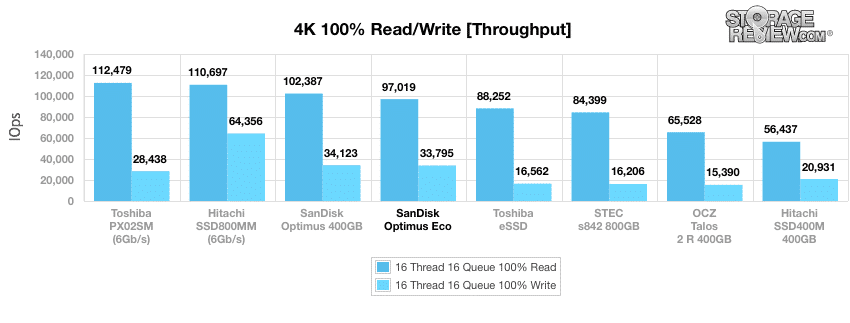
With preconditioning complete, the SanDisk Optimus Eco 400GB reaches a 4k read IOPS of 97,019, median for the comparables, and a third-fastest 4k write IOPS score of 33,795, just behind the SanDisk Optimus and meeting SanDisk’s advertised maximum IOPS.
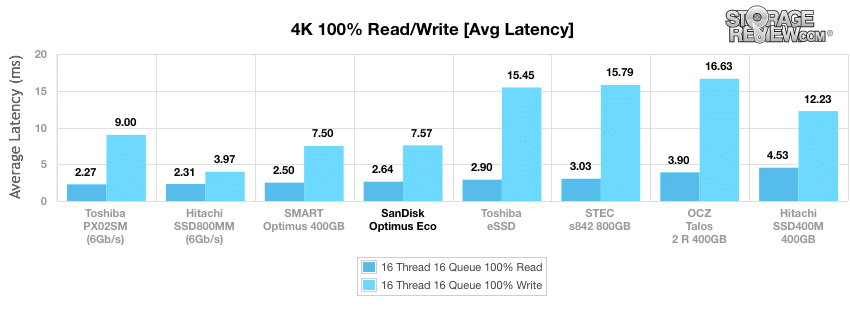
With latency results averaged, the Optimus Eco manages fourth place in average read latency at 2.64ms and a third-place result for 4k write latency, averaging 2.54ms.
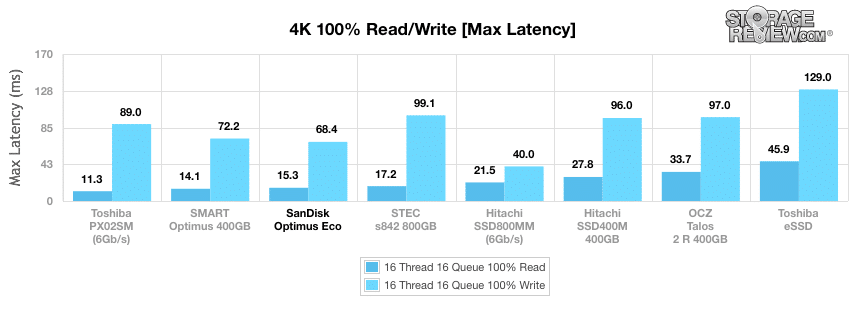
When we plot only the maximum latencies experienced by our comparables during the 4k test, the Optimus Eco has the third-best results, with a 15.3ms maximum latency and is second only to the Hitachi SSD800MM in maximum write latency at 68.4ms.
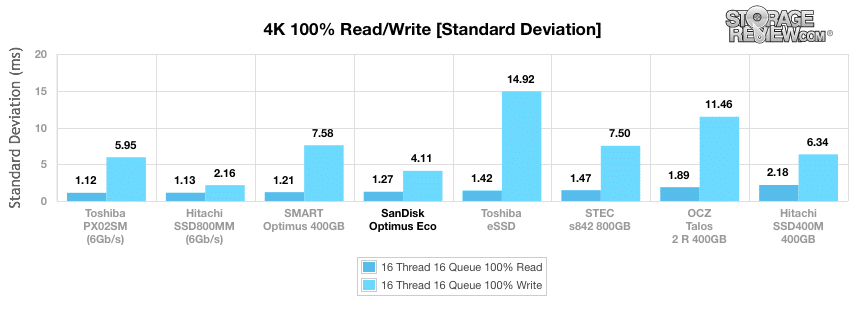
The standard deviation chart reflects the Optimus Eco’s relatively few latency spikes during the 4k test. The Optimus Eco experienced a standard deviation of 1.27ms in the 4k write benchmark and kept standard deviation to 4.11ms during the write test.
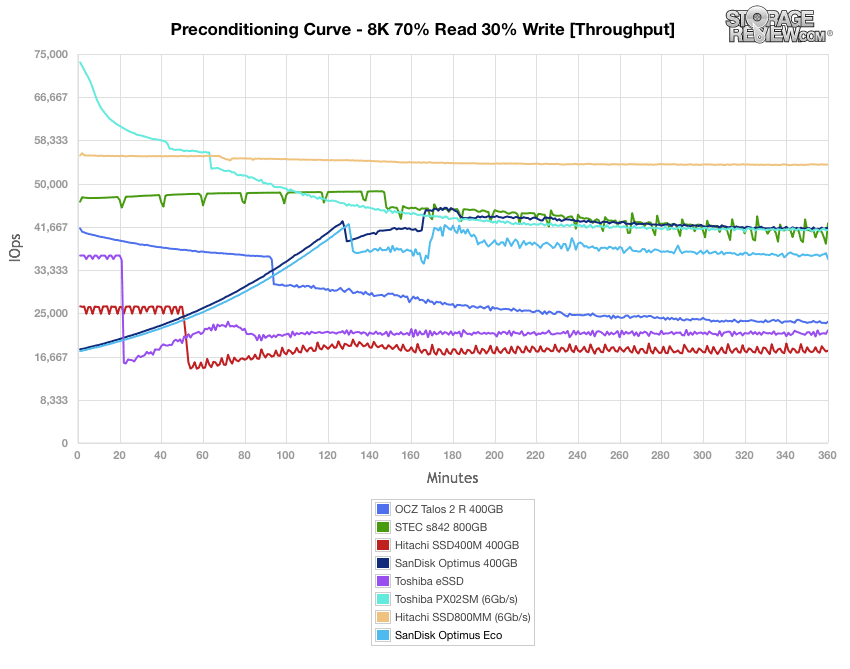
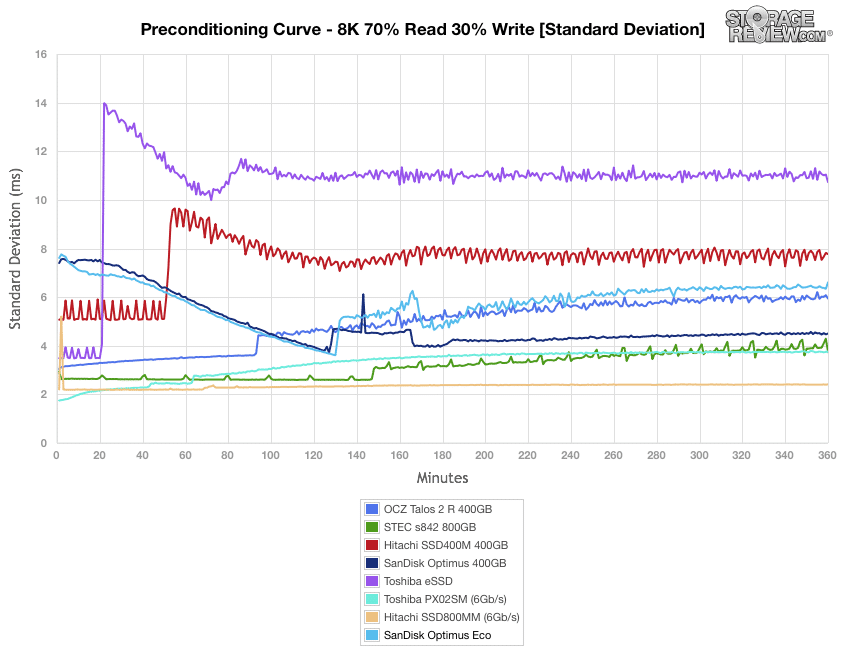
The second synthetic benchmark uses 8k of data with a 70/30 read/write ratio. Charting drive throughput during the 8k preconditioning curve makes it easy to identify the two SanDisk drives which share the Guardian Technology Platform even though they use different MLC NAND. Unlike most of the comparables which experience a period of high burst performance during the beginning of preconditioning, the Optimus Eco’s throughput gradually increases during the preconditioning curve before stabilizing near at the middle of the comparables near 36,200 IOPS.
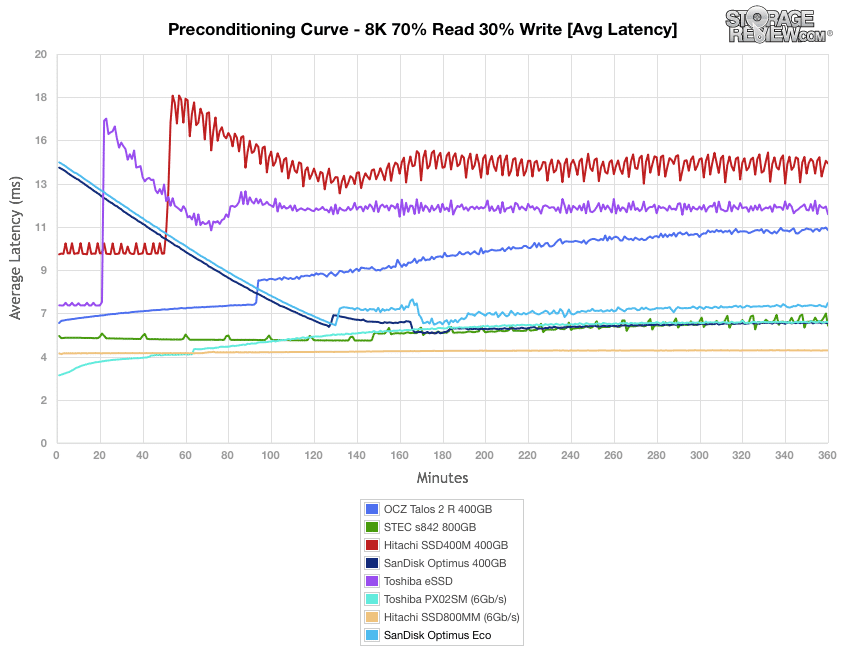
The SanDisk Optimus Eco, like its Optimus cousin, also experienced latency improvements during the 8k preconditioning curve. Beginning at 14.4ms average latency, the Optimus Eco eventually halves that number as it enters steady state, a strong but unexceptional performance.
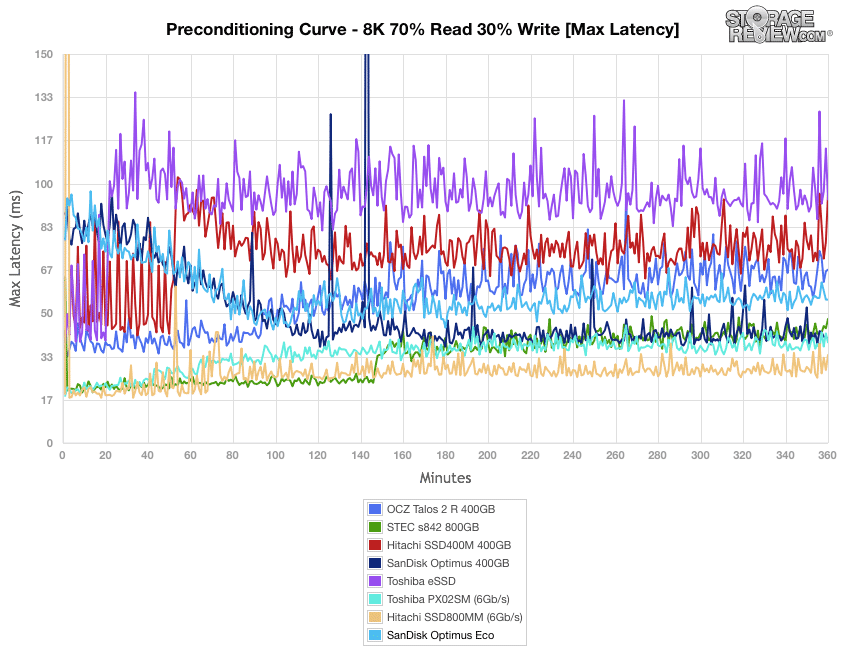
As with its average latency results during 4k preconditioning, the Optimus Eco does not suffer from any unexpected peaks in maximum latency, which improves over the course of preconditioning to reach 55.3ms.
Charting our comparables’ standard deviation during preconditioning shows the Optimus Eco maintaining a standard deviation of approximately 6.4ms as it enters steady state, placing fourth out of seven drives benchmarked.
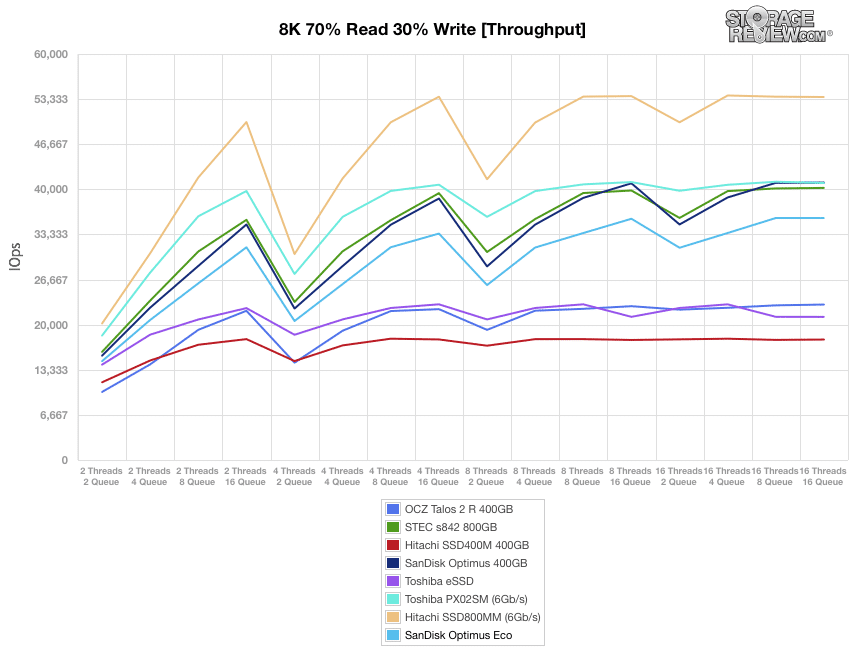
With preconditioning completed for the 8k test the benchmark begins in earnest. Our 8k 70/30 synthetic benchmark evaluates each of the comparable drives across a variety of thread and queue depth combinations in order to improve insight into the strengths and weaknesses of the device under different workloads. Looking at throughput, the Optimus Eco stays in the middle of the pack regardless of the intensity of the workload.
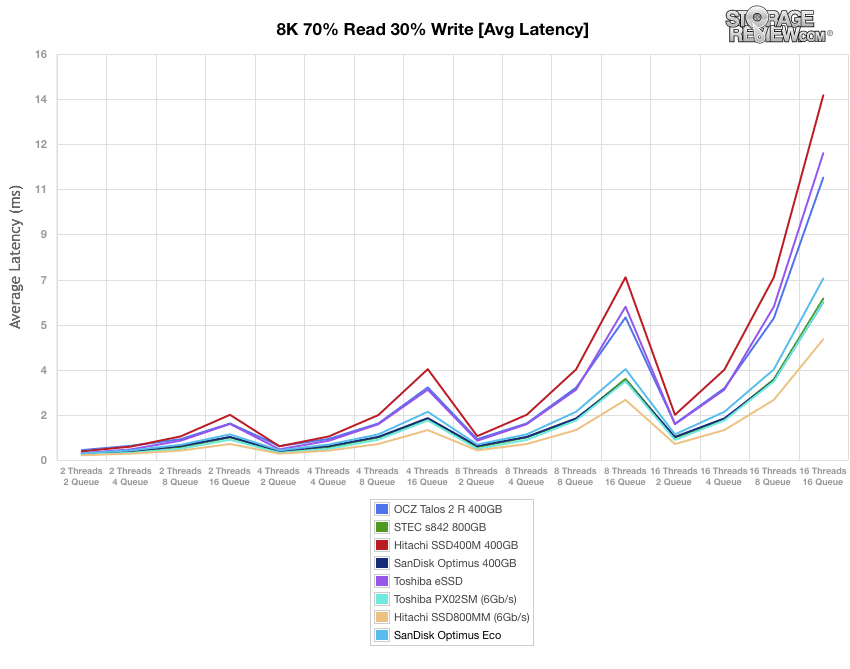
The Optimus Eco again achieves respectable but average results in our plot of average latency during the 8k benchmark, starting at 0.26ms with 2 threads and a queue of 2, ranging up to 7.15ms at the maximum workload of 16 threads and a 16 queue.
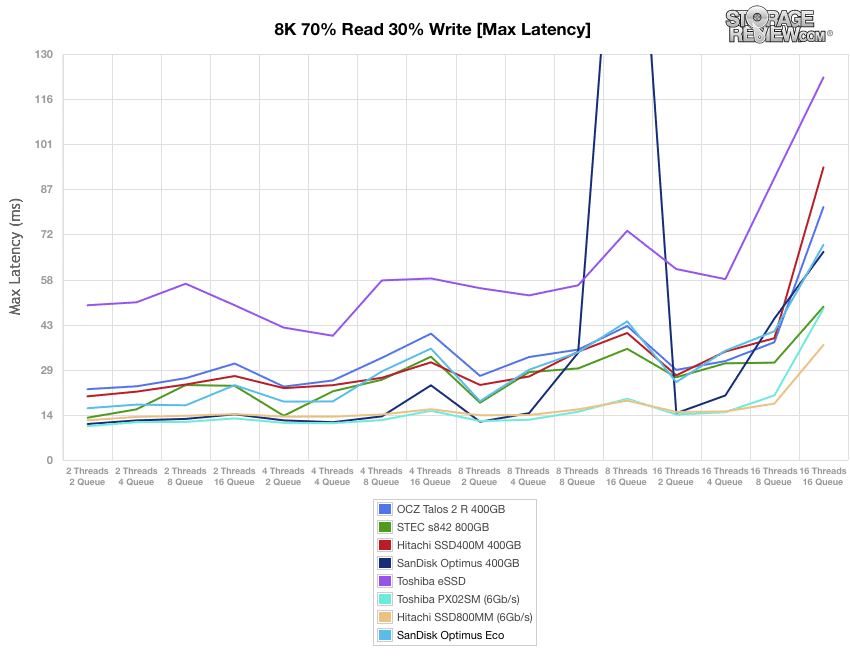
Unlike the SanDisk Optimus, which experienced an aberrant latency spike at 8 threads and a queue of 16, the Optimus Eco gave a strong but typical maximum latency performance among the comparables throughout the 8k testing protocol.
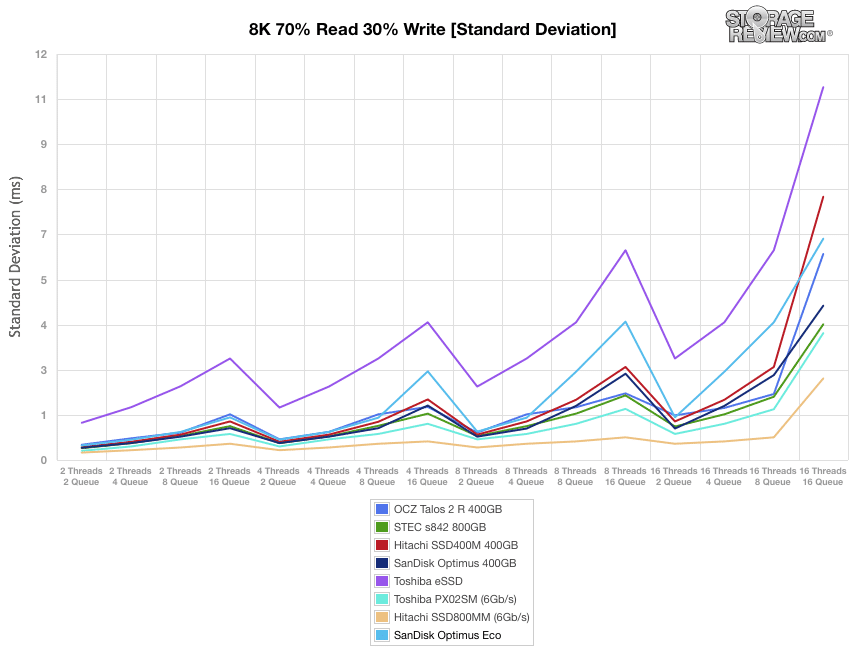
Measuring standard deviation for the 8k benchmark latency results, the SanDisk Eco did not offer any surprises, starting at a standard deviation of 0.43ms and winding up at 6.54ms with the maximum thread and queue loads.
Conclusion
SMART Storage Systems was the first to offer eMLC-based enterprise SSDs. SanDisk’s acquisition of SMART earlier this year brought these key engineering and intellectual property resources in-house as the Guardian Technology Platform proved itself a capable foundation for ensuring enterprise performance from MLC NAND. The benchmark results for the Optimus Eco demonstrate a few advantages this gives SanDisk over the eMLC technology offered by SanDisk’s competitors. Most strikingly, the preconditioning curves for both of our synthetic benchmarks provide clear evidence that the Optimus Eco, like its cousin the Optimus, is able to tailor its performance to a workload over time until steady state is reached.
The Optimus Eco preconditioning curves stand in opposition to the other comparables, which typically offer a burst of high performance at the beginning of preconditioning that settles into lower performance as time goes on. While there are applications where bursts of high speed can provide an advantage, there are many situations where it will prove valuable to deploy an SSD like the Optimus Eco that can gain performance by intelligently adapting to a workload. The Optimus Eco does not offer dominance on any one of our benchmarks, but instead offers consistent performance across a variety of workloads that may find this SSD in a wide variety of situations with where its versatility and proven technology platform combine with a compelling price to performance ratio.
Pros
- Performance increases over time with a set workload due to adaptive functionality from the Guardian Technology Platform
- Consistent all-around performance with no major weak spots in both application and synthetic benchmarks
- Available in capacities up to 2TB
Cons
- Only rated for three random writes or seven sequential drive writes per day
Bottom Line
The SanDisk Optimus Eco is another strong offering under the Optimus name that puts the Guardian Technology Platform good use in adapting MLC NAND for enterprise storage.


 Amazon