
 Continuing on the path of VMware VSAN performance testing, the next test looks at Microsoft SQL Server TPC-C running across the cluster. This test uses SQL Server 2014 running on Windows Server 2012 R2 guest VMs, being stressed by Dell's Benchmark Factory for Databases. While our traditional usage of this benchmark has been to test large 3,000-scale databases on local or shared storage, in this iteration we focus on spreading out four 1,500-scale databases evenly across our VSAN cluster to better illustrate the aggregate performance of the 4-node cluster.
Continuing on the path of VMware VSAN performance testing, the next test looks at Microsoft SQL Server TPC-C running across the cluster. This test uses SQL Server 2014 running on Windows Server 2012 R2 guest VMs, being stressed by Dell's Benchmark Factory for Databases. While our traditional usage of this benchmark has been to test large 3,000-scale databases on local or shared storage, in this iteration we focus on spreading out four 1,500-scale databases evenly across our VSAN cluster to better illustrate the aggregate performance of the 4-node cluster.
Dell PowerEdge R730xd VMware VSAN Specifications
- Dell PowerEdge R730xd Servers (x4)
- CPUs: Eight Intel Xeon E5-2697 v3 2.6GHz (14C/28T)
- Memory: 64 x 16GB DDR4 RDIMM
- SSD: 16 x 800GB Solid State Drive SAS Mix Use MLC 12Gbps
- HDD: 80 x 1.2TB 10K RPM SAS 6Gbps
- Networking: 4 x Intel X520 DP 10Gb DA/SFP+, + I350 DP 1Gb Ethernet
- Storage Capacity: 86.46TB
SQL Server Performance
Each SQL Server VM is configured with two vDisks, one 100GB for boot and one 500GB for the database and log files. From a system resource perspective, we configured each VM with 16 vCPUs, 64GB of DRAM and leveraged the LSI Logic SAS SCSI controller. Similar to the Sysbench tests, these weren't designed to fully saturate the cluster, but instead designed to monitor behaviour across the cluster under a reasonable load.
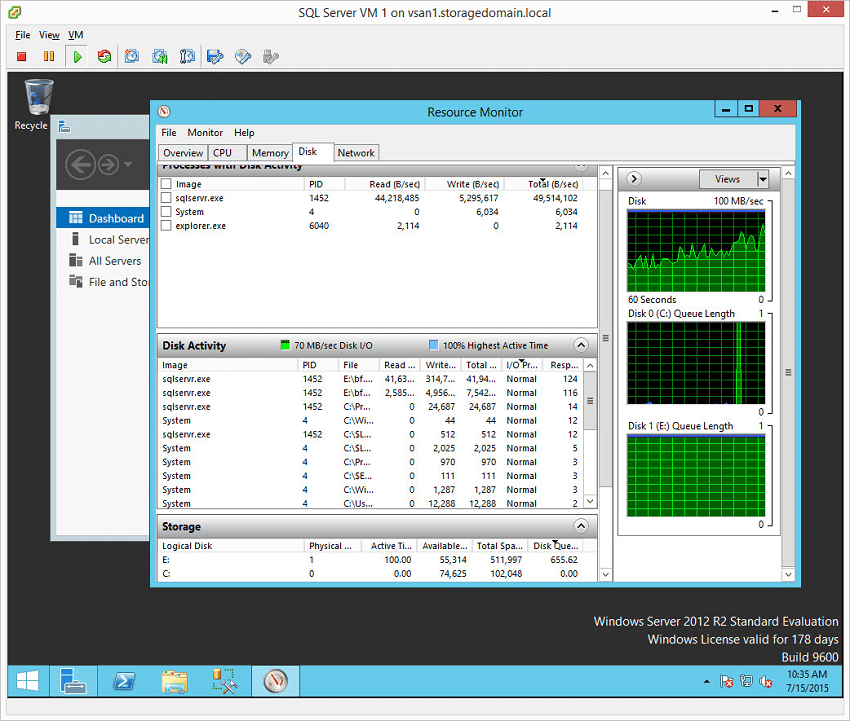
As the screenshot above indicates, VSAN does a pretty good job quickly caching the VM into flash at the onset of the benchmark. This particular benchmark is very latency sensitive once it is running in steady-state, meaning while bandwidth is important, application performance relies on responsive storage. From a capacity perspective, this test operating across all four nodes consumed a little over 2.3TB out of the 86.46TB available on the cluster, meaning the data resides almost entirely in flash. In an upcoming performance analysis section we will go into additional detail with scaled benchmarks and multi-workload tests drawing from additional resources on the VSAN cluster.
SQL Server Testing Configuration (per VM)
- Windows Server 2012 R2
- Storage Footprint: 600GB allocated, 500GB used
- SQL Server 2014
- Database Size: 1,500 scale
- Virtual Client Load: 15,000
- RAM Buffer: 48GB
- Test Length: 3 hours
- 2.5 hours preconditioning
- 30 minutes sample period
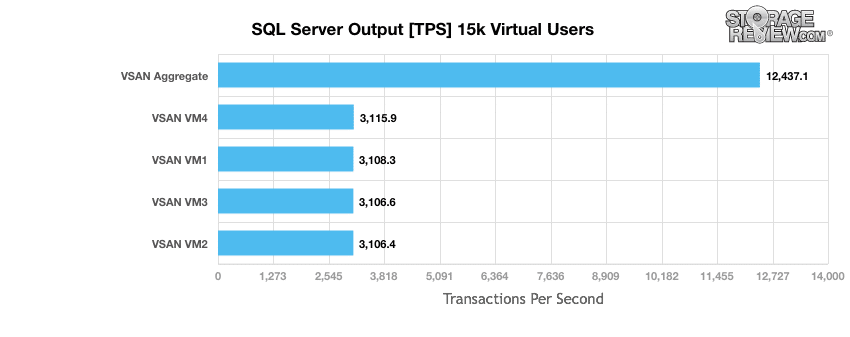
In the SQL Server TPC-C test on hyper-converged platforms, we look for workload balance across the cluster. With four VMs running in steady-state across our VMware VSAN platform, we measured performance ranging from 3,106.4TPS on the low side to 3,115.9TPS on the high side. In aggregate we saw cluster-wide performance measure 12,437.1TPS on the VSAN cluster.
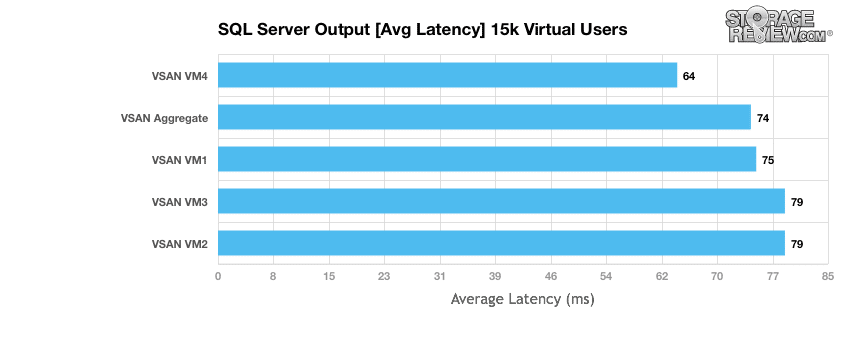
For the SQL Server TPC-C test, the variable we pay the most attention to is average latency. Small gaps in transactional performance won't show the full story. To that end we measured VMware VSAN performance ranging from 64ms on the low side to 79ms on the high side. This is an aggregate average of 74ms. That translates to the fastest VM being 13.5% faster than average, while the slower VMs were just 6.7% slower than average.
SQL Server performance on Virtual SAN largely followed that of Sysbench. We saw relatively good latency spread between the nodes, though SQL was a little higher than Sysbench. More importantly we saw quick warming of the cache, which ate up the 2.4TB test footprint pretty effectively. With larger databases or databases with roving hotspots, the cache responsiveness is critical in a hybrid configuration. The net result of the SQL data though shows good aggregate capabilities, with low system overhead.
VMware Virtual SAN Review: Overview and Configuration
VMware Virtual SAN Review: VMmark Performance
VMware Virtual SAN Review: Sysbench OLTP Performance
VMware Virtual SAN Review: SQL Server Performance
VMware Virtual SAN Review: Scaled Sysbench OLTP Performance
VMware Virtual SAN Review: HCIbench Synthetic Performance
Sign up for the StorageReview newsletter