

Nexenta and Supermicro have teamed together to deliver what they’re calling the Unified Storage Appliance. The appliance leverages Nexenta’s NexentaStor 5.0 software to deliver block-and-file storage and NexentaFusion for storage management and analytics combined with Supermicro’s hardware and sales/support infrastructure. The combination brings together a software defined solution that’s already tested and validated on the Supermicro hardware and is orderable from Supermicro as a pre-loaded and pre-configured complete solution. The Unified Storage Appliance comes in five configurations depending on customer need, ranging from a capacity-centric 4U 3.5″ hard drive version that can support flash cache, to a 2U 24-bay all-flash configuration that’s rated up to 180,000 mixed 8KB IOPS. Each main unit can also support two expansion JBODs for additional capacity. Because Nexenta is the underlying software, the solution is full of enterprise data services like replication, in-line data reduction and space optimized snapshots/clones. Included with the appliance is a next-day 3-year service program (4-hour response optional) and Supermicro offers remote installation service to help customers get off to a good start.
Twenty-four bays of 3.84TB of capacity is a lot of flash storage, but Nexenta and Supermicro allow users to increase that with two more all-flash JBODs. Users can add 48 more bays or 72 total, which would bring the total raw capacity up to 276TB of flash. The companies also offer a larger hybrid model for those looking for more cost-effective storage where performance is not the primary concern. While delivering tons of capacity, the array also offers several data services, including unlimited file system size, unlimited snapshots and clones, inline data reduction, storage quality of service, scheduled snapshot-based replication, and continuous asynchronous replication.
This review centers on one of the all-flash configurations which includes 24 3.8TB SAS SSDs.
Unified Storage Appliance powered by Nexenta & Supermicro specifications:
- Model Number: SSG-2028R-NEX2040
- Form Factor: 2U
- Storage
- Storage Media: 3.84TB SAS SSD
- Disk Configuration: RAIDZ2: 4 + 2
- Raw Capacity: 46TB to 276TB
- Usable Capacity: 30TB to 184TB
- Effective Capacity: 90TB to 552TB
- Performance
- Max 8KB (Read/Write): 180K IOPS
- Max Bandwidth Read: 8GB/s
- Expansion chassis: Up to 2x 2U/24 bay – all flash JBODs supported (72 bays total)
- Protocol support:
- NFSv3
- NFSv4
- CIFS
- SMB3
- iSCSI
- Fibre Channel
- Ecosystem Support:
- Windows
- Linux
- VMware VAAI
- VMware VVOL
- VMware Multi-Tenant vCenter Plugin
- OpenStack Cinder & Manila
- Hyper-V SMB 3 ODX
- Docker Volume Plug-In
- Data services:
- Unlimited File System Size
- Unlimited Snapshots & Clones
- Inline Data Reduction
- Storage Quality of Service
- Scheduled Snapshot Based Replication
- Continuous Asynchronous Replication
- Management:
- Command Line Interface
- Self-Documenting REST API
- SNMP
- NexentaFusion: Single pane of glass multi-appliance management, Advanced Analytics, Simple Operations
Design and Build
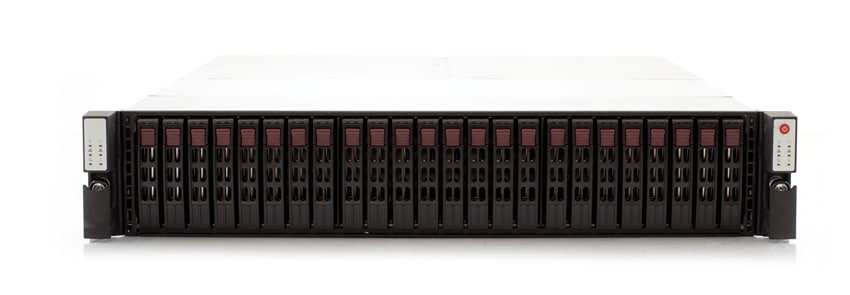
The front of the device (pictured above) looks very similar to several Supermicro chassis. Along the front are the twenty-four 2.5” bays laid out in a vertical manner. On the right-hand side is the power button and on either side are the indicator lights.
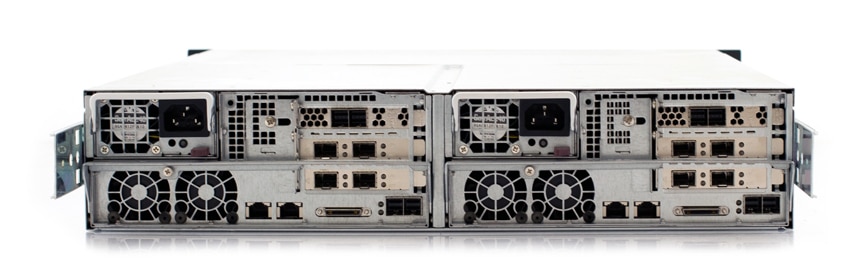
The back of the device is split evenly into two sections with the same layout. On the upper left-hand side is the PSU. Beneath the PSU are the two cooling fans. Immediately next to the cooling fans are to RJ-45 ports. To the right of this are three PCIe slots, including SAS JBOD expansion and 4x 10GbE ports per controller. Below those is the breakout port and USB ports.
Management
Nexenta has come out with its latest version of its open-source based storage product, NexentaStor. This version comes with Nexenta Fusion, which is a standalone VM or Docker container that manages multiple NexentaStor systems. This is a departure from the original product that had an integrated management system and ran on the same hardware as the actual storage controllers. Since there is only one Nexenta system installed, it really doesn’t display the abilities of switching between storage systems easily, but centralized management of multiple systems is always a solid way to win the support of a storage administrator.
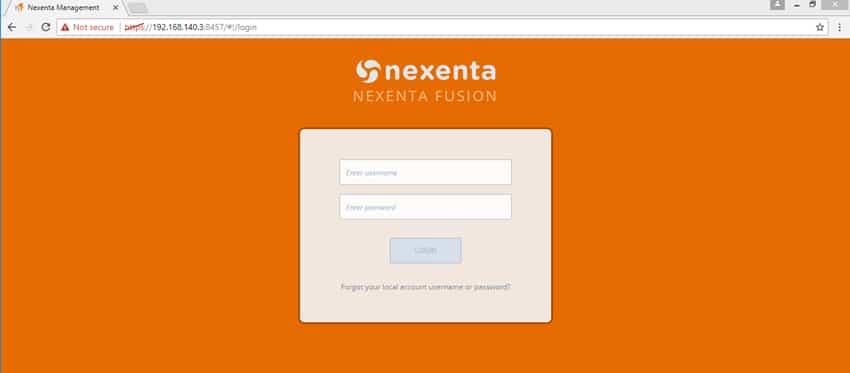
The login screen has the standard username/password login dialog box that is standard for most systems.
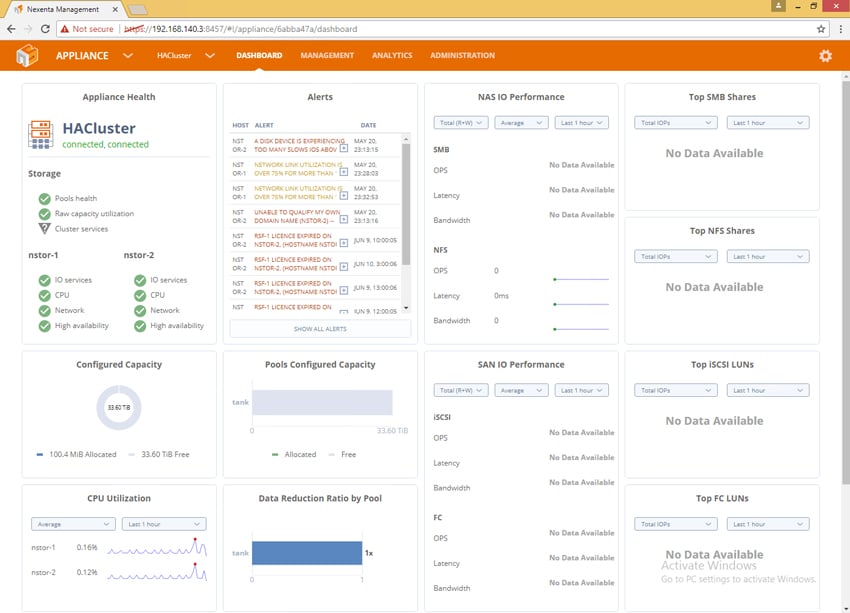
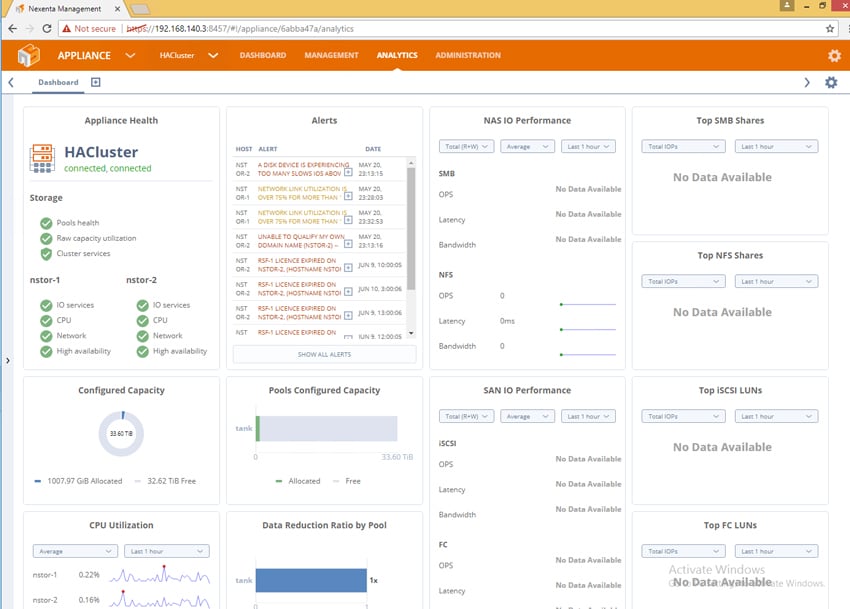
After logging in, you are brought to a dashboard that shows many critical aspects of the system. As there is no load on the system, there is not a lot of information here right now.
This screen would display multiple systems that you could easily switch between if there were more than one system activated.
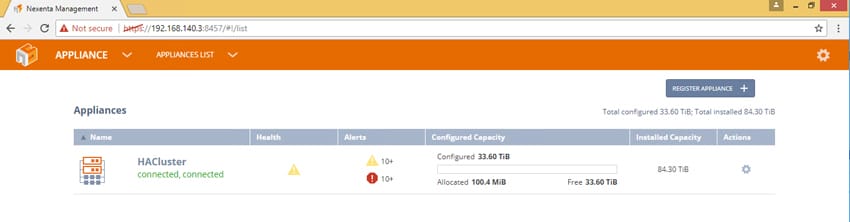
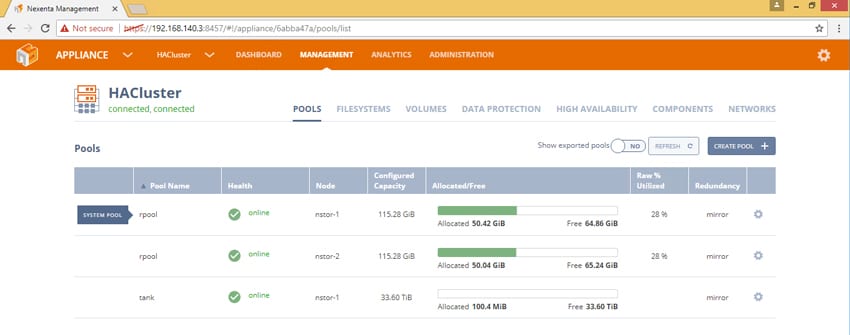
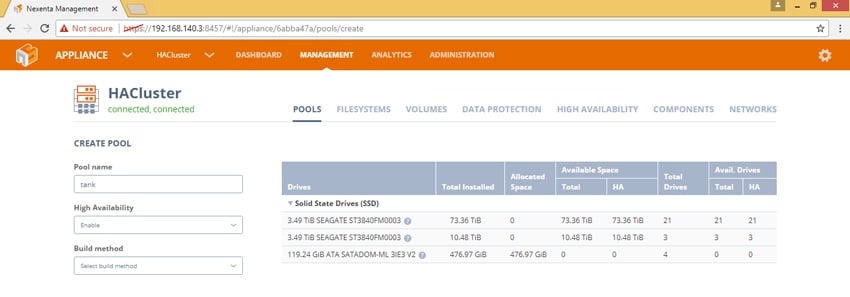
The Management tab really dives into the guts of provisioning and capacity management. Here you see several pools or “rpool,” which are the boot volumes on each of the nodes, and “Tank” which is a storage volume that can float between the two nodes. The Supermicro appliance comes from the factory with a pool already configured and ready to access with preselected RAID protection and caching drives if needed (on hybrid models).
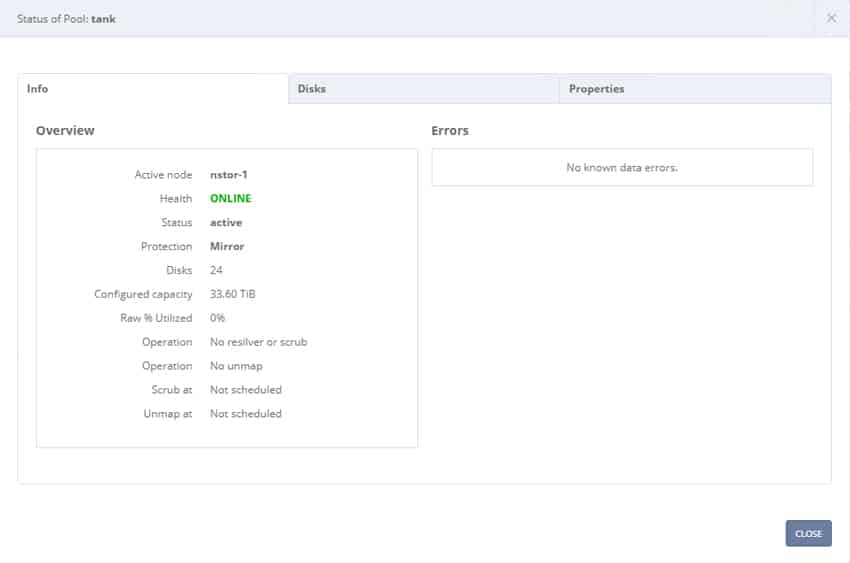
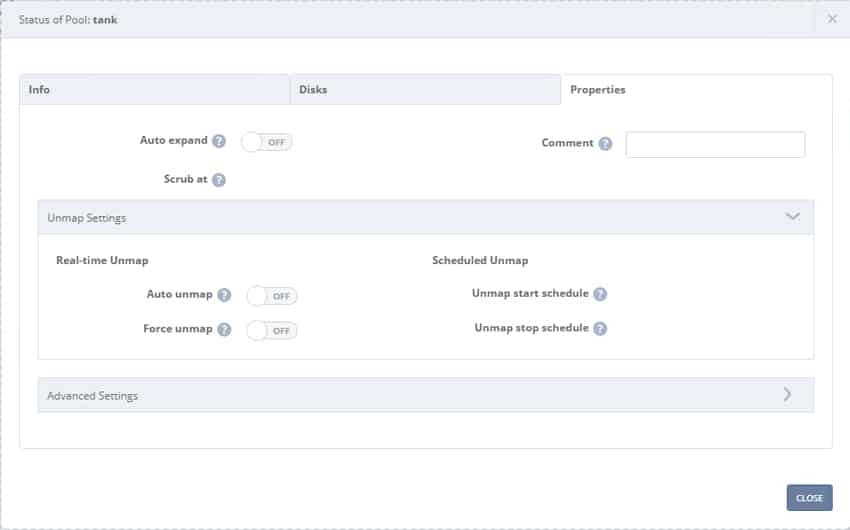
By clicking on the settings button to the right of “Tank,” you can see additional information about the storage pool.
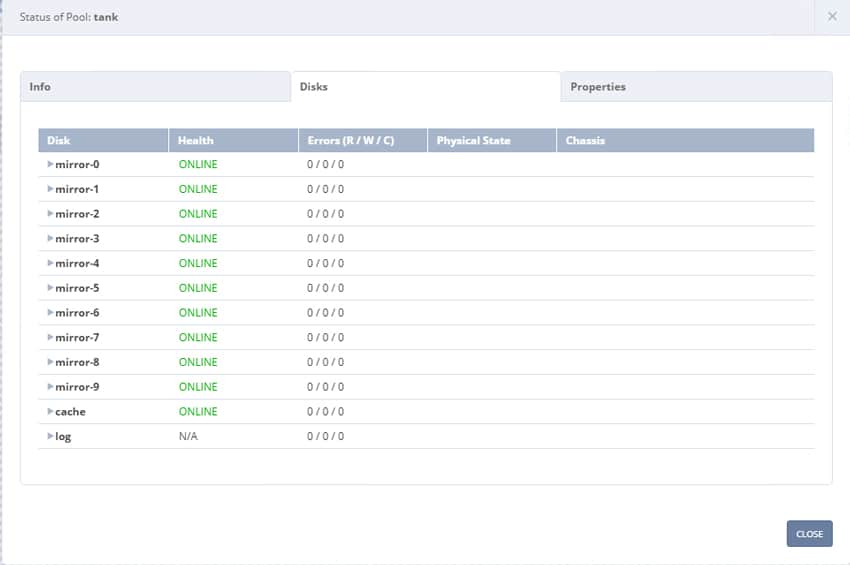
The next tab shows all of the disks that are allocated to the pool, and the health of those disks.
The third tab shows properties and advanced settings for the pool. The advanced settings area allows you to modify in depth the settings of the pool.
When you click “create pool,” you get to this screen, which shows you all of the available drives to build pools from. You can name the pool, and then select the build settings. There are a multitude of settings through this guided process that allows you to configure RAID protection, logging, caching, spares and more.
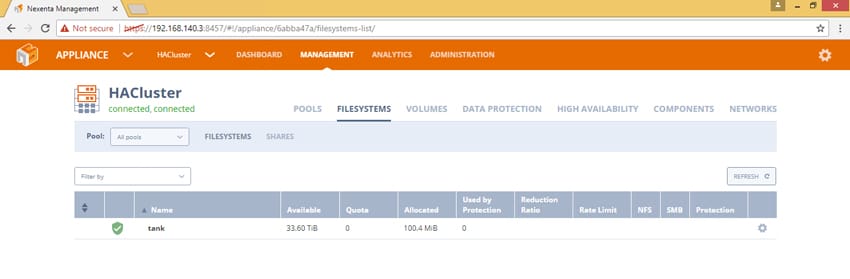
The Filesystems tab shows you the filesystems that exist on the system. You can have multiple filesystems in any given system, and you can carefully control the settings of those filesystems by clicking on the “settings” gear widget.
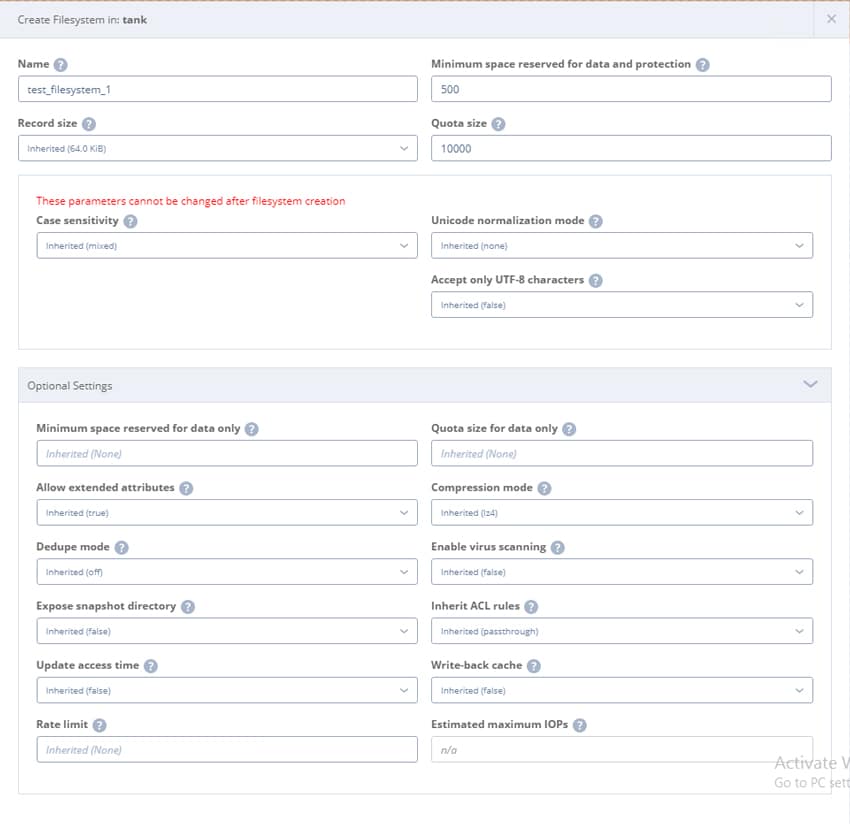
This is an example of what creating a filesystem looks like.
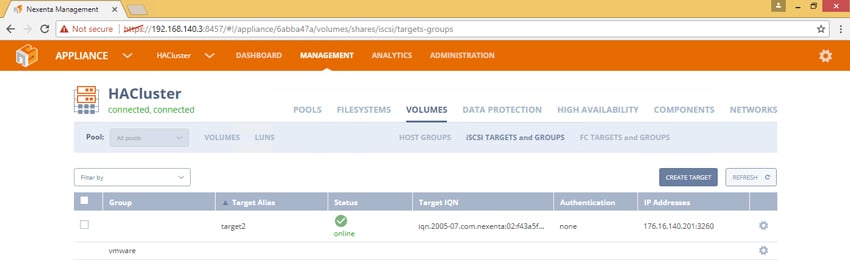
The Volumes tab shows different volumes that are in the system. This allows you to configure volumes, and manage their size, the host groups that can access them, iSCSI targets and iSCSI groups, FC parameters, and associated settings.
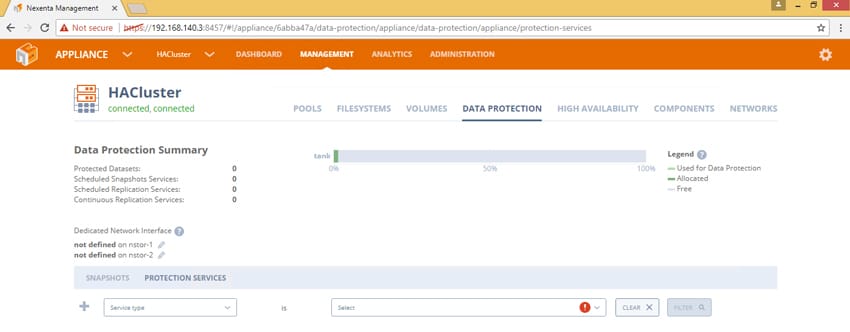
The Data Protection tab allows you to monitor and configure data protection rules for the system. This includes snapshots and replication to other systems.
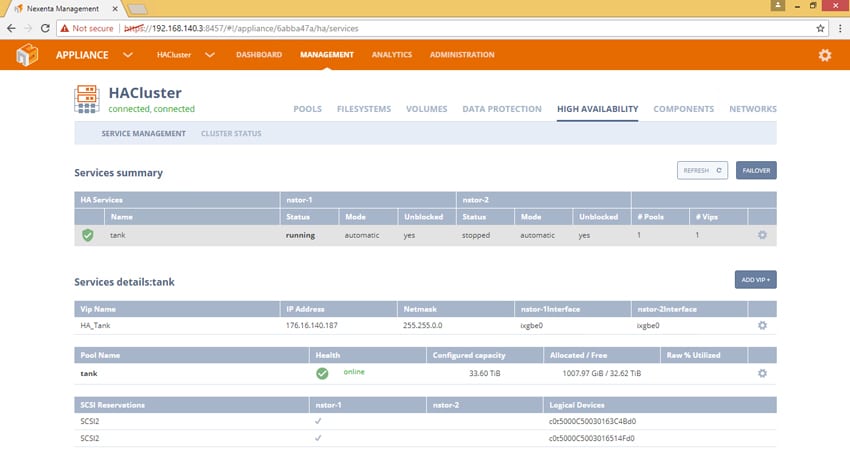
The High Availability tab shows you the services that are running in High Availability mode, Cluster status, and additional configuration information for those features.
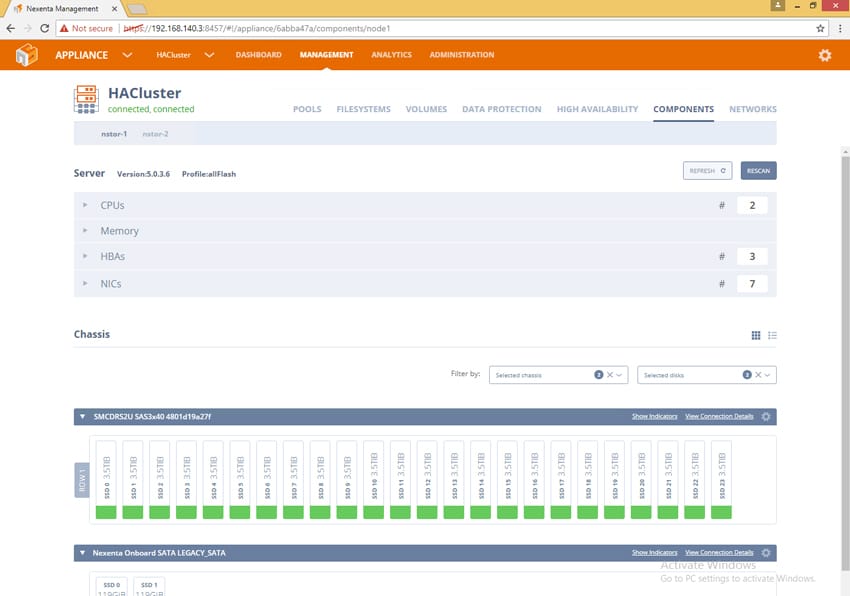
The Components tab gives you visibility into all of the hardware components and health of the systems that are running NexentaStor services.
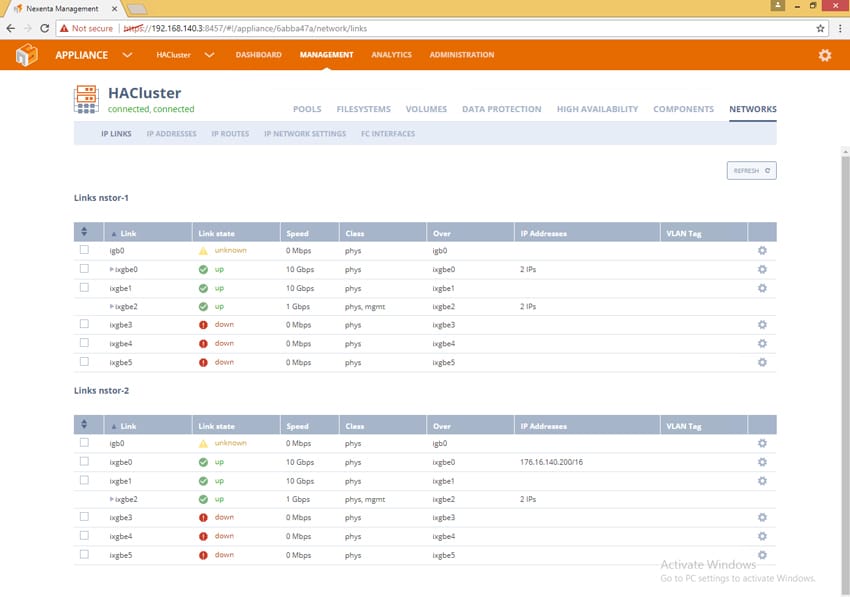
The Networks tab gives you an overview of all physical and logical network connections, and the ability to modify those configurations.
The Analytics tab brings you back to what the original dashboard looks like. You can also add additional customized dashboards to view different performance metrics and alarms of the system. This is a very customizable area of the overall system.
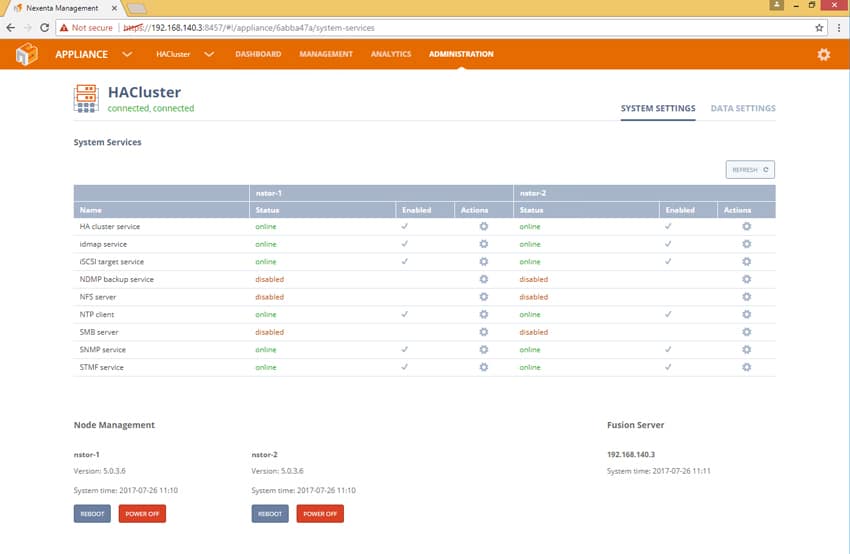
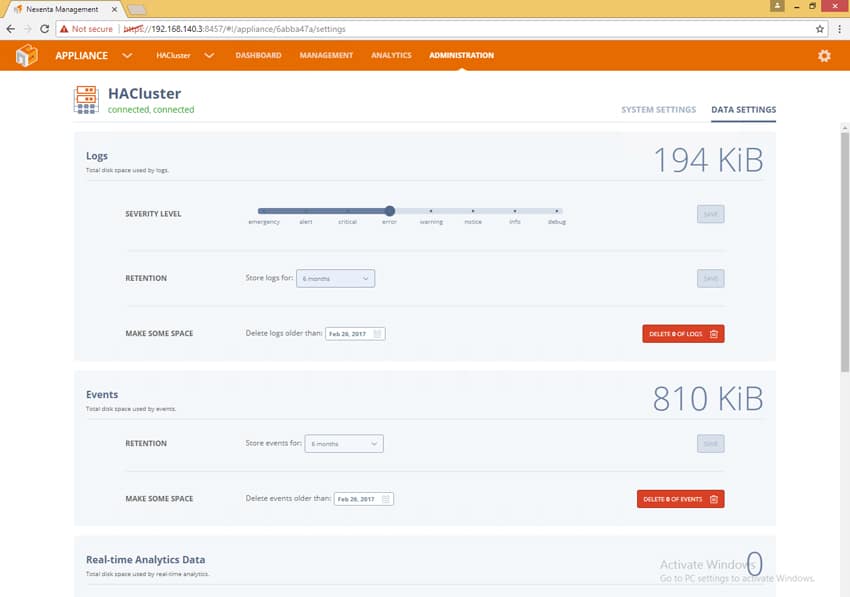
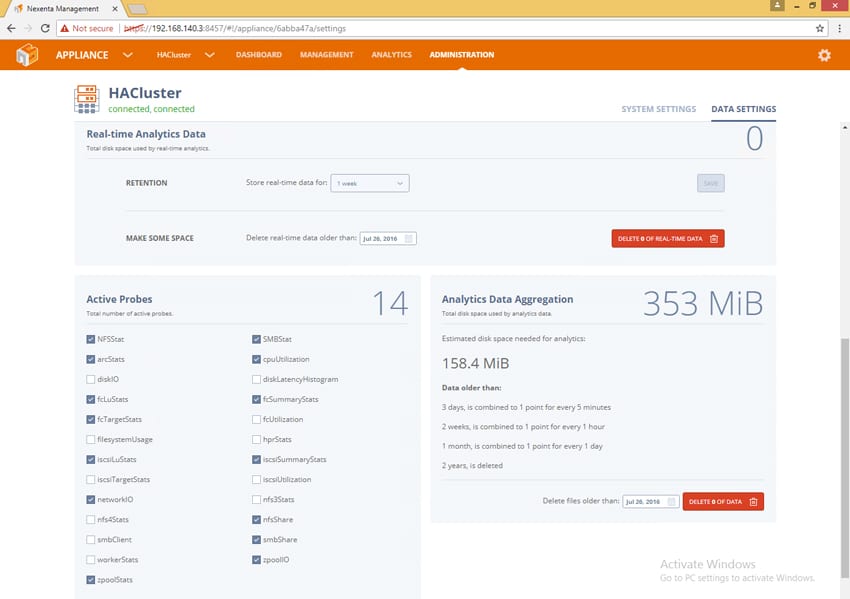
The Administration tab of the system brings you to the overall administration of the services offered and enabled on the system. It allows you to modify the logging settings and the probes that run on the system to provide analytics and alerting.
The final area in the interface is the Fusion management settings. This is where you configure NTP, Active Directory, email alerts, DNS and all of the other management aspects of the Nexenta Fusion management system.
Overall, Nexenta has improved the look and feel of the user interface over their previous versions. Bringing an HTML5 interface and a dedicated appliance to manage the NexentaStor systems is a very welcome improvement over managing many discrete systems. The interface is not for the faint of heart though, as there are still many ways for you to build pools inefficiently, and ways to break the system if configuration mistakes are made. That said, the collaboration between Nexenta and Supermicro does a good job of alleviating the concern over incorrectly configured pools by shipping from the Supermicro factory with preconfigured pools and RAID configuration.
Nexenta, as it has been for a long time, is a very customizable, powerful front end to ZFS-based storage. It allows you to make nearly any change that can be made on the command line. With that amount of control, it takes a gentle touch to make sure everything is configured properly. A little more guidance and fail safes during configuration would go a long way to making this product more inviting to novice users.
Application Workload Analysis
The first benchmarks consist of the MySQL OLTP performance via SysBench and Microsoft SQL Server OLTP performance with a simulated TPC-C workload.
In each of these tests the array is configured with two 12-drive RAID1 mirrored-pair pools. We measure three separate configurations:
- iSCSI with compression only
- iSCSI with compression and deduplication
- NFS with compression only
Compression was used as a default enabled item since we saw no difference between compression enabled or disabled.
SQL Server Performance
Each SQL Server VM is configured with two vDisks: 100GB volume for boot and a 500GB volume for the database and log files. From a system resource perspective, we configured each VM with 16 vCPUs, 64GB of DRAM and leveraged the LSI Logic SAS SCSI controller. While our Sysbench workloads tested previously saturated the platform in both storage I/O and capacity, the SQL test is looking for latency performance.
This test uses SQL Server 2014 running on Windows Server 2012 R2 guest VMs, while being stressed by Dell’s Benchmark Factory for Databases. While our traditional usage of this benchmark has been to test large 3,000-scale databases on local or shared storage, in this iteration we focus on spreading out four 1,500-scale databases evenly across the USA (two VMs per controller).
SQL Server Testing Configuration (per VM)
- Windows Server 2012 R2
- Storage Footprint: 600GB allocated, 500GB used
- SQL Server 2014
- Database Size: 1,500 scale
- Virtual Client Load: 15,000
- RAM Buffer: 48GB
- Test Length: 3 hours
- 2.5 hours preconditioning
- 30 minutes sample period
SQL Server OLTP Benchmark Factory LoadGen Equipment
- Dell PowerEdge R730 Virtualized SQL 4-node Cluster
- Eight Intel E5-2690 v3 CPUs for 249GHz in cluster (Two per node, 2.6GHz, 12-cores, 30MB Cache)
- 1TB RAM (256GB per node, 16GB x 16 DDR4, 128GB per CPU)
- 4 x Emulex 16GB dual-port FC HBA
- 4 x Emulex 10GbE dual-port NIC
- VMware ESXi vSphere 6.5 / Enterprise Plus 8-CPU
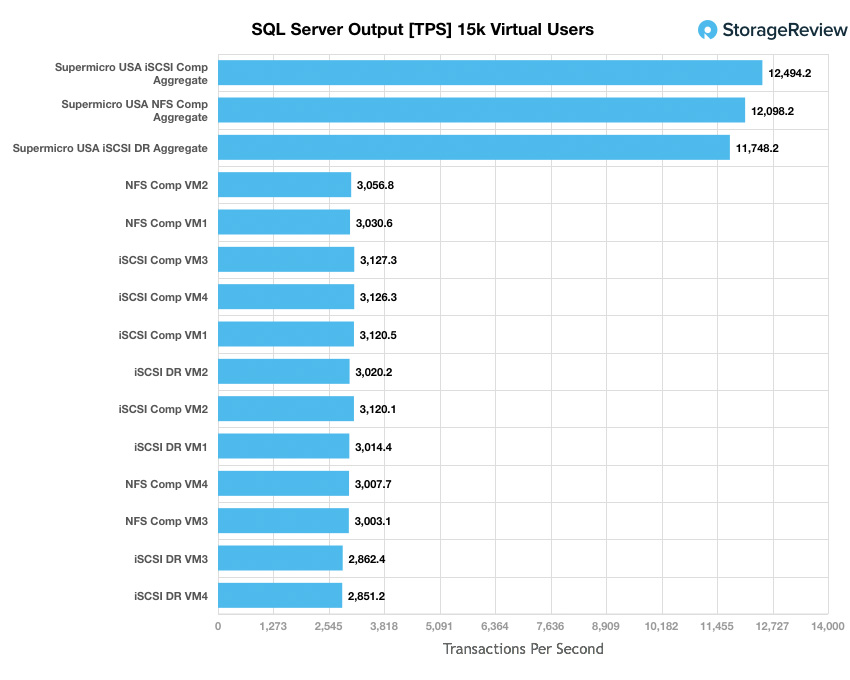
We tested the USA in both iSCSI and NFS configurations with data compression on, as well as testing the solution in iSCSI with data compression and deduplication on.
Looking at transactional performance, iSCSI with compression had individual VMs ranging from 3,120.53 TPS to 3,127.28 TPS with an aggregate score of 12,494.21 TPS. NFS with compression had individual VMs ranging from 3,003.12 TPS to 3,056.8 TPS with an aggregate score of 12,098.2 TPS. In our iSCSI with DR on we saw individual VMs range from 2,851.16 TPS to 3,020.22 TPS with an aggregate score of 11,748.23 TPS.
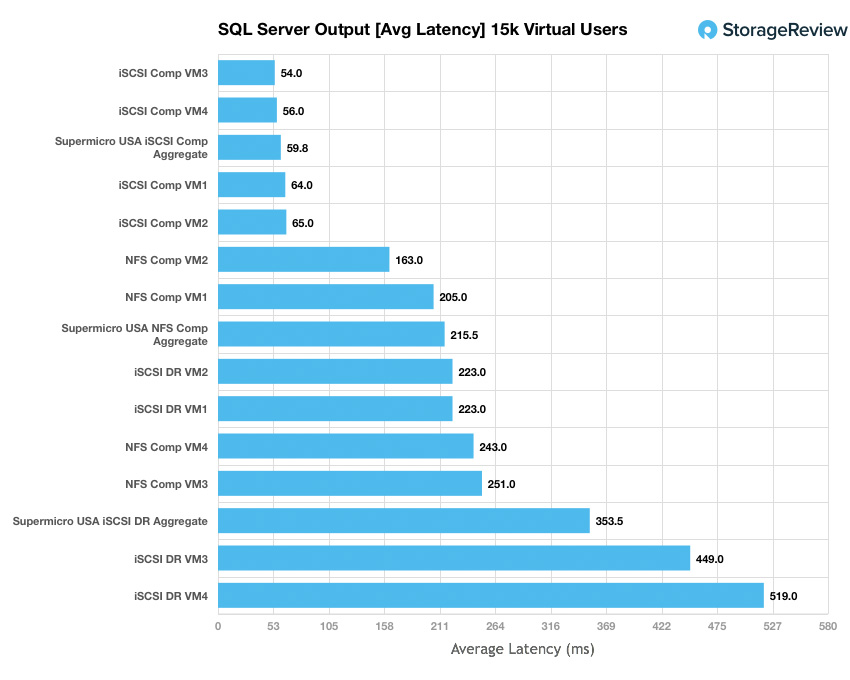
Switching over to SQL Server average latency, iSCSI with compression showed the overall lowest latency with individual VMs ranging from 54ms to 65ms with an aggregate of 59.75ms. NFS with compression gave us latencies ranging from 163ms to 251ms for individual VMs with an aggregate latency of 215.5ms. And iSCSI with deduplication on gave us the highest latencies of 223ms to 519ms for individual VMs and an aggregate score of 353.6ms
Sysbench Performance
Each Sysbench VM is configured with three vDisks: one for boot (~92GB), one with the pre-built database (~447GB) and the third for the database under test (270GB). From a system resource perspective, we configured each VM with 16 vCPUs, 60GB of DRAM and leveraged the LSI Logic SAS SCSI controller. Load gen systems are Dell R730 servers; we range from four to eight in this review, scaling servers per 4VM group.
Dell PowerEdge R730 Virtualized MySQL 4-8 node Cluster
- Eight-sixteen Intel E5-2690 v3 CPUs for 249GHz in cluster (Two per node, 2.6GHz, 12-cores, 30MB Cache)
- 1-2TB RAM (256GB per node, 16GB x 16 DDR4, 128GB per CPU)
- 4-8 x Emulex 16GB dual-port FC HBA
- 4-8 x Emulex 10GbE dual-port NIC
- VMware ESXi vSphere 6.5 / Enterprise Plus 8-CPU
Sysbench Testing Configuration (per VM)
- CentOS 6.3 64-bit
- Storage Footprint: 1TB, 800GB used
- Percona XtraDB 5.5.30-rel30.1
- Database Tables: 100
- Database Size: 10,000,000
- Database Threads: 32
- RAM Buffer: 24GB
- Test Length: 3 hours
- 2 hours preconditioning 32 threads
- 1 hour 32 threads
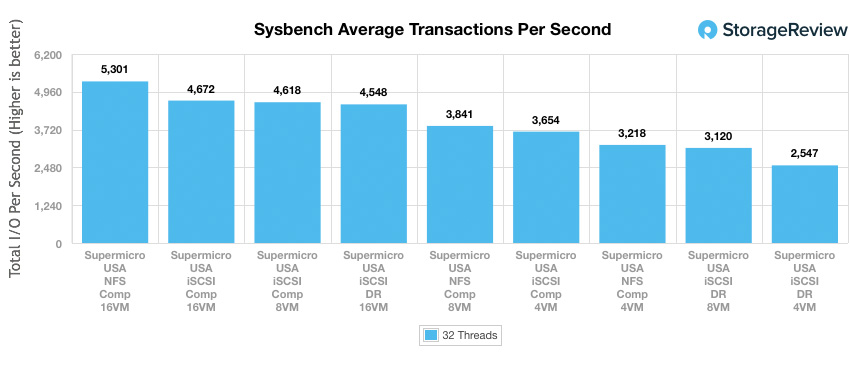
For Sysbench, we tested several sets of VMs including 4, 8, and 16, and we ran Sysbench with compression on at all times, as well as both deduplication On and Off, testing both block and file. For transactional performance, the USA was able to hit 3,218 TPS with 4VM in NFS (higher than 8VM with DR on). The solution was able to hit maximums of 5,301 TPS with 16VM in NFS and a high iSCSI of 4,672 TPS at 16VM, though at 8VM the iSCSI score was 4,618 TPS.
Switching over to look at average latency, we saw the best performance with 4VM configured in iSCSI with just compression enabled at a latency of 35.08ms. It was no surprise that latency quickly ramped up as we added VMs or turned on the deduplication. The highest latency was iSCSI with DR on at 113.24ms.
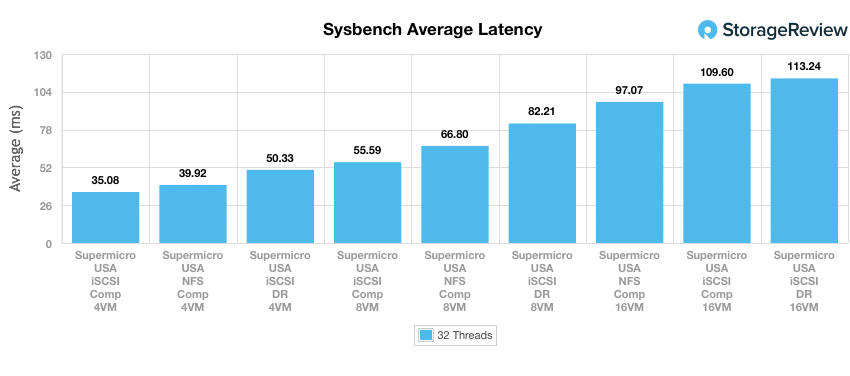
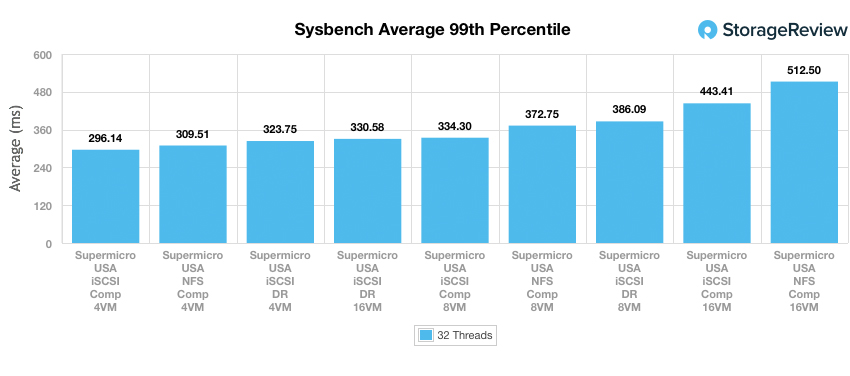
In our worst-case scenario latency benchmark, the best latency was again with compression 4VM iSCSI, this time with 226.14ms. The highest was 16VM NFS with 512.5ms.
VDBench Workload Analysis
When it comes to benchmarking storage arrays, application testing is best, and synthetic testing comes in second place. While not a perfect representation of actual workloads, synthetic tests do help to baseline storage devices with a repeatability factor that makes it easy to do apples-to-apples comparison between competing solutions. These tests offer a range of different testing profiles ranging from “four corners” tests, common database transfer size tests, as well as trace captures from different VDI environments. All of these tests leverage the common vdBench workload generator, with a scripting engine to automate and capture results over a large compute testing cluster. This allows us to repeat the same workloads across a wide range of storage devices, including flash arrays and individual storage devices. On the array side, we use our cluster of Dell PowerEdge R730 servers:
Profiles:
- 4K Random Read: 100% Read, 128 threads, 0-120% iorate
- 4K Random Write: 100% Write, 64 threads, 0-120% iorate
- 64K Sequential Read: 100% Read, 16 threads, 0-120% iorate
- 64K Sequential Write: 100% Write, 8 threads, 0-120% iorate
- Synthetic Database: SQL and Oracle
- VDI Full Clone and Linked Clone Traces
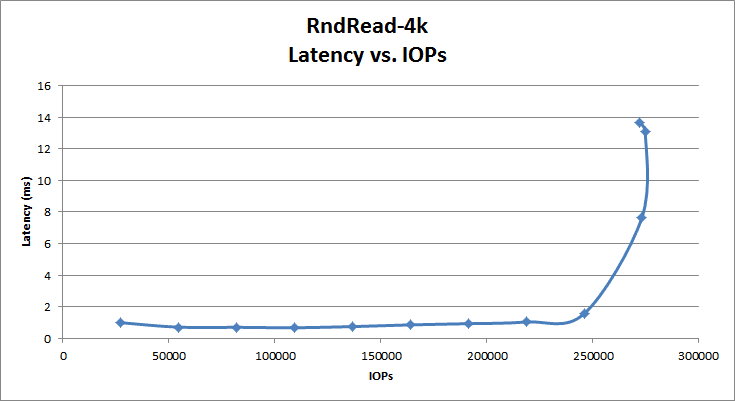
Looking at peak read performance, the USA had good low latency 4K random performance staying under 1ms until around 200K IOPS. The USA peaked at 272,429 IOPS at 13.6ms, with roughly 249,000 IOPS at sub 2.0ms latency.
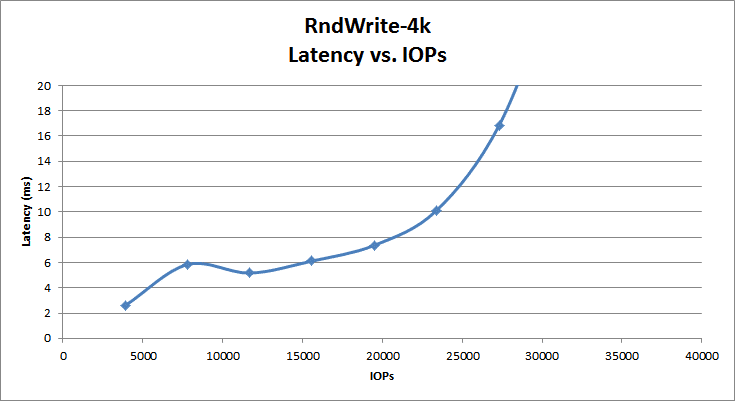
Looking at 4K peak write performance, the USA started at 2.6ms at an IOPS of 3,905. Latency quickly climbed alongside IOPS. The USA peaked at 31,200 IOPS at 29ms.
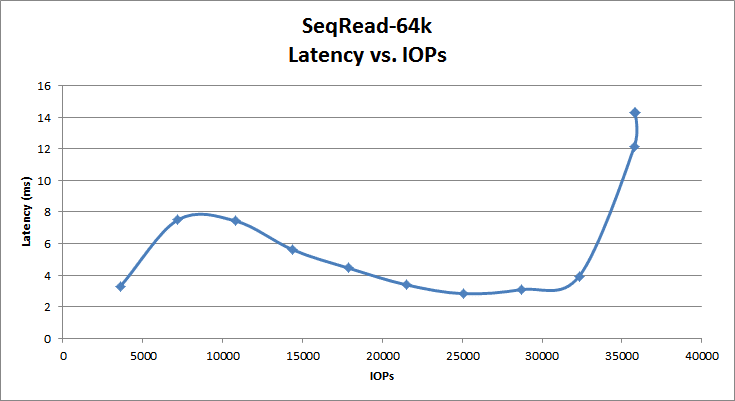
Switching to 64K peak read, the USA once again started a bit higher in latency at 3.2ms at 3,596 IOPS. The latency spiked up some with the IOPS before it swung back down, but didn’t drop below 2.83ms. Here a max performance was hit at 35,828 IOPS and 14.3ms latency. The USA finished with a bandwidth of 2.23GB/s.
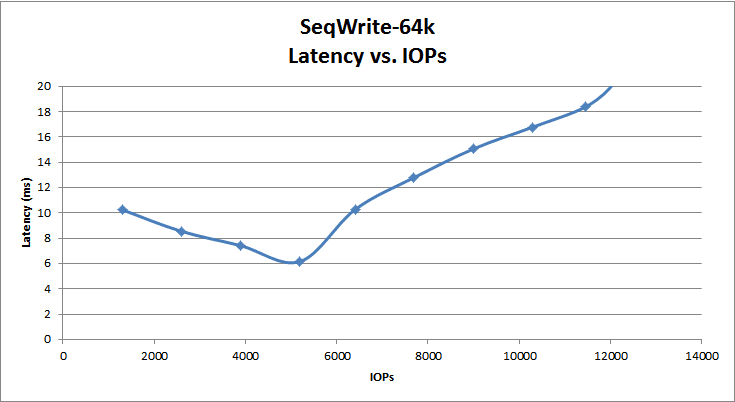
For 64K sequential peak write, the latency started at 10.3ms at 1,300 IOPS. It came down to 6.2ms at 5,195 IOPS before once again climbing up with IOPS performance. Peak performance of the USA was 12,070 IOPS at 20.3ms with bandwidth of 754.4MB/s.
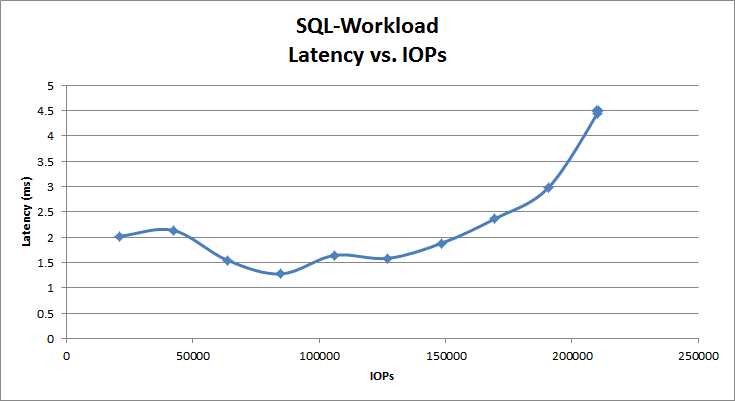
In our SQL workload, the USA started over 2ms at 21,168 IOPS. It peaked at 210,601 IOPS with 4.5ms latency.
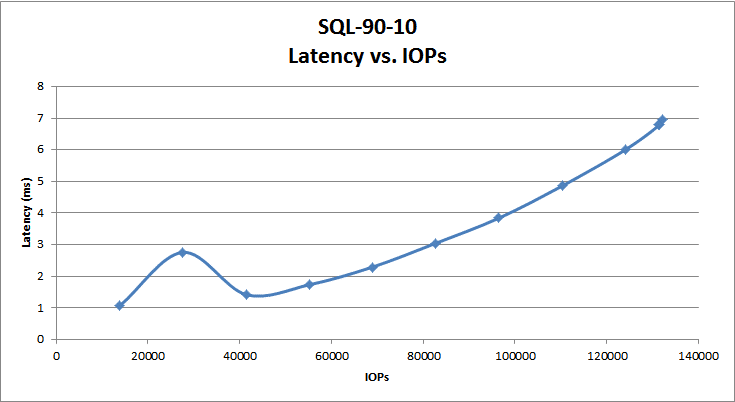
In the SQL 90-10 benchmark, the USA started with latency just over 1ms at 13,811 IOPS and peaked at 132,220 IOPS and 7ms latency.
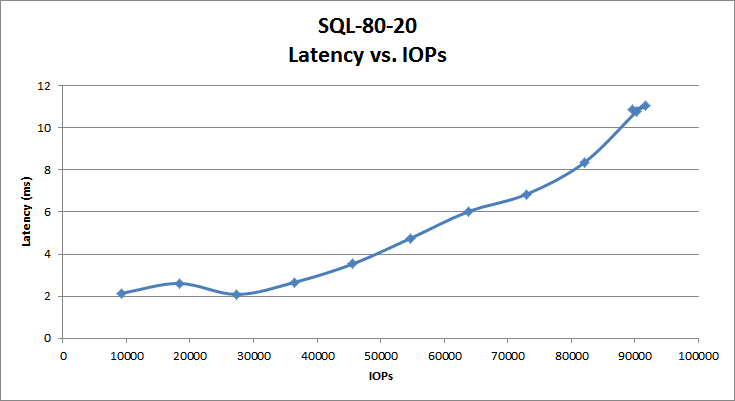
The SQL 80-20 saw the USA again starting over 2ms with IOPS at 9,210. It peaked at 91,739 IOPS and 11ms latency.
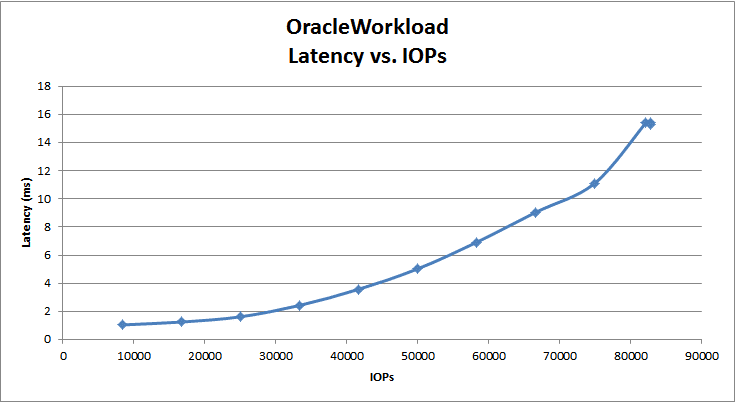
With the Oracle Workload, the USA started out just over 1ms latency at 8,401 IOPS and peaked at 82,789 IOPS and a latency of 15.4ms.
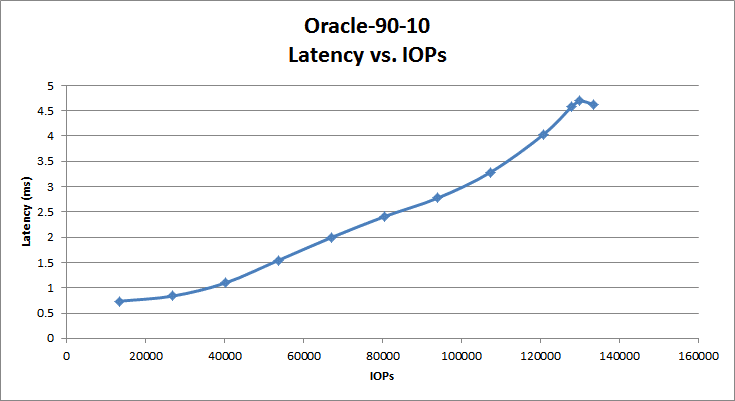
With the Oracle 90-10, the USA started out below 1ms with 0.74ms and stayed under 1ms, until it hit around 38K IOPS. The USA peaked at 133,553 IOPS at 4.6ms latency.
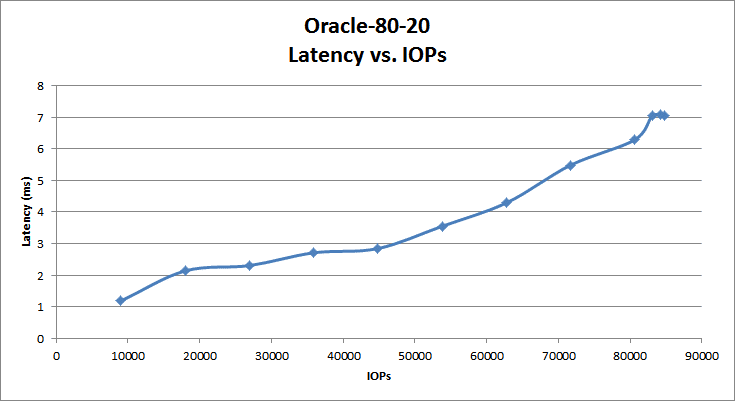
With the Oracle 80-20, we once again saw the USA starting above 1ms (1.2ms at 9,004 IOPS) and peaking at 84,786 IOPS, with a latency of 7ms.
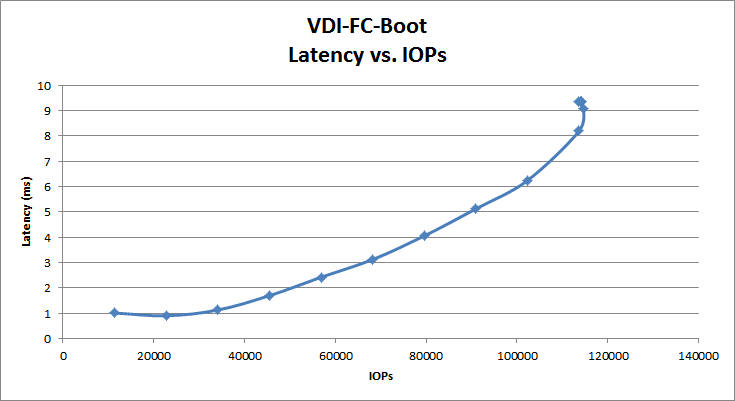
Switching over to VDI Full Clone, the boot test showed the USA start just north of 1ms (1.01ms at 11,402 IOPS) and then drop under 1ms until it hit around 30K IOPS. It peaked at 114,647 IOPS with a latency of 9.3ms.
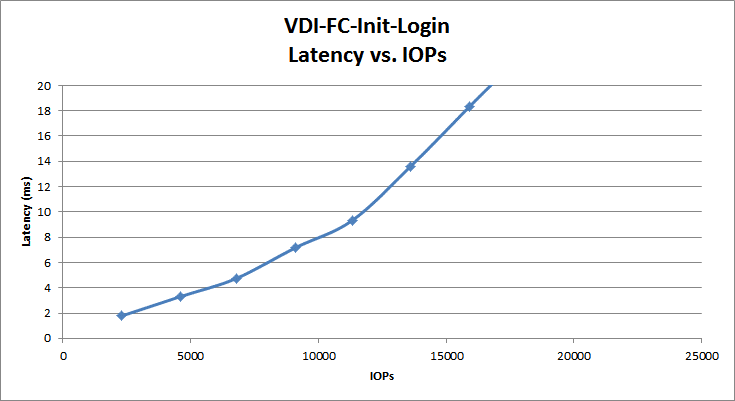
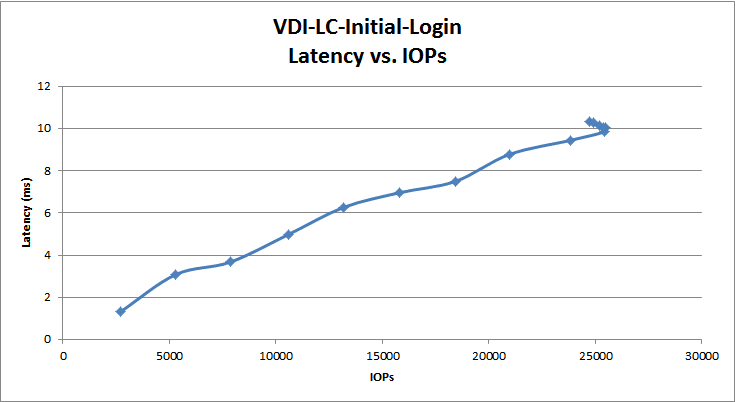
The VDI Full Clone initial login started off at 1.8ms at 2,295 IOPS and peaked at 18,108 IOPS and a latency of 22.9ms.
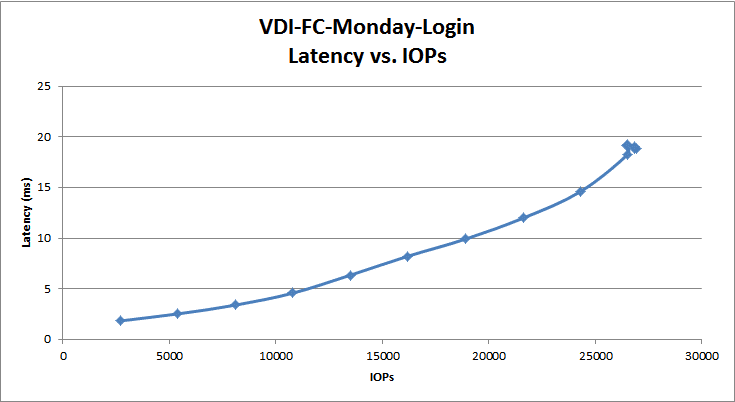
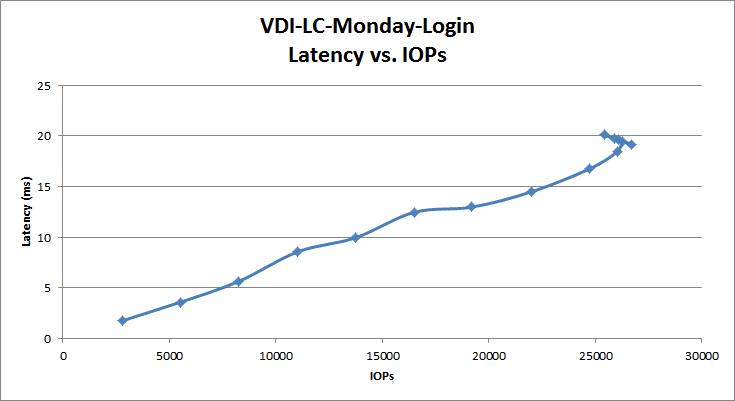
The VDI Full Clone Monday login started off at 1.8ms at 2,696 IOPS and peaked at 26,465 IOPS and a latency of 19.2ms.
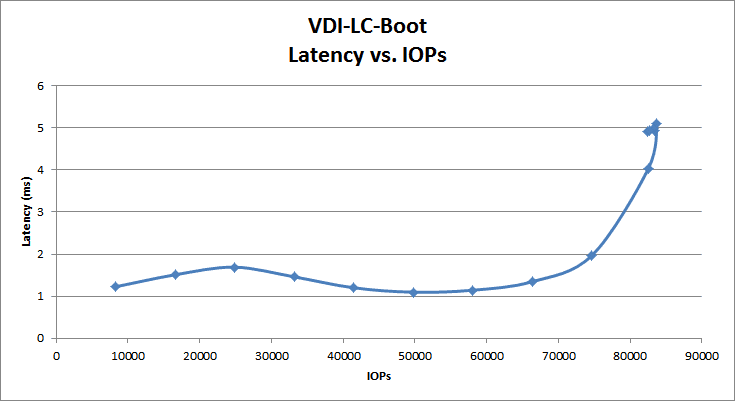
Moving over to VDI Link Clone, the boot test showed performance starting at 1.2ms at 8,308 IOPS and peaking at 83,392 IOPS with a latency of 4.9ms.
In the Linked Clone VDI profile measuring Initial Login performance, the USA started with a latency of 1.3ms at a IOPS of 2,698 and peaked at 24,715 IOPS and a latency of 10.3ms.
In our last profile looking at VDI Linked Clone Monday Login performance, the USA started at a latency of 1.8ms at 2,818 IOPS and peaked at 25,416 IOPS at 20.1ms.
Conclusion
Though it is quite a mouthful, the Unified Storage Appliance powered by Nexenta and Supermicro is a software-defined storage solution that combines Nexenta’s software (NexentaStor 5.0 and NexentaFusion) with Supermicro’s hardware, sales, and support infrastructure. This partnering brings a validated, pre-loaded, and pre-configured complete solution out of the box, which is somewhat unique for a typically software-first solution. The companies offer several different flavors in both all-flash (for performance) and hybrid models (for higher capacity and cost-effectiveness). There are also half-populated and fully-populated configurations within each category and all have the ability to add two JBODs for additional storage. The solution comes with support from Supermicro and the platform offers enough data services and dials to turn to cover most use cases.
Looking at performance, we ran both application workload analyses including SQL Server and Sysbench application workloads, as well as recently introduced VDBench Workload Analysis synthetic benchmarks. With our application workloads, we tested the USA in both iSCSI with compression on, again with deduplication on or off, and as NFS with compression on. In our transactional benchmark for SQL Server, having deduplication turned on had a large impact on performance with the aggregate iSCSI score of 11,748.2 TPS, and without deduplication, our iSCSI configuration yielded 12,494.2 TPS. Deduplication had a much larger impact on SQL Server average latency. iSCSI with compression only had the best performance with an aggregate score of 59.8ms, but iSCSI with compression and deduplication on had an aggregate score of 353.6ms. With our scaling Sysbench test, we tested with loads of 4, 8, and 16 VMs. With a small load of 4VMs, we saw the best performance with just compression on over iSCSI, measuring 3,654 TPS. This compared to 3,218 over NFS with just compression, or 2,547 over iSCSI with both compression and deduplication. At its peak, NFS with compression only scored the highest with 5,301 TPS, with iSCSI using compression only measuring 4,672 TPS and iSCSI with compression and dedupe measuring 4,548 TPS.
Looking at VDBench workload tests performed with compression enabled only over iSCSI, the USA faltered a bit. The solution only showed sub-millisecond performance on three benchmarks and only started at sub-millisecond latency on two of these tests. In random 4K read, the USA was able to maintain sub-millisecond latency until it hit around 200K IOPS. We again saw sub-millisecond performance in the Oracle 90-10 test until around 38K IOPS. And though the VDI Full Clone boot started over 1ms, it did drop below again until it hit around 30K IOPS. In other areas, the USA had a much higher latency floor at the beginning of the test and during the stages where the loads were ramped up.
The Unified Storage Appliance leveraging Nexenta software and Supermicro hardware leaves us with mixed feelings. In terms of configuration options, it easily surpasses other arrays on the market as far as ways to tweak and optimize the storage for very specific production scenarios. For those who want to control every knob and dial, Nexenta clearly delivers. While this is great, the settings can be overwhelming at times for those not fully indoctrinated. Nexenta has put their engineering effort into compression with this latest release, which they state offers a 3:1 capacity savings depending on the workload. When deduplication is enabled though, performance was hurt to the point that it shouldn’t be enabled for most production workloads. The overall data reduction for an all flash system and moderate performance profile put the appliance in a difficult position, as other arrays have figured out how to offer full data reduction without much performance penalty. To be fair, not everyone can do this and not every workload is suitable for deduplication; but enough arrays have been successful at it to make near lossless full data reduction a vital feature for computing TCO.
Pros
- Integration with Supermicro gets a novice user set up out of the box
- Nexenta offers a myriad of knobs and buttons for advanced users to tune
- Supermicro support network provides a more complete offering for what has traditionally been a software-first offering
Cons
- Very high write latency
- Large performance overhead with deduplication turned on
Bottom Line
The Unified Storage Appliance delivers what has traditionally been a software-only Nexenta package in a pre-configured appliance from Supermicro that’s ready to go out of the gate.


 Amazon