

Back in July we reviewed the 120GB Force Series GT and now we finally get our hands on the larger 240GB model. With the 240GB SSD market getting extra attention these days, we put it to the test, stacking it up against other 240GB models, as well as its smaller 120GB brother.
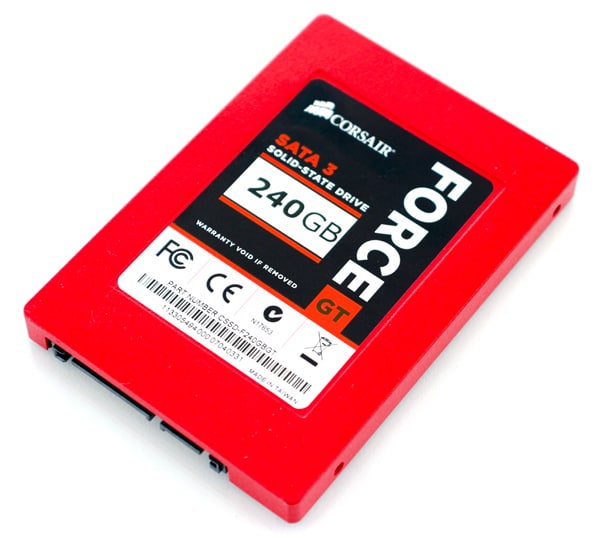
Corsair posts serious performance numbers for the Force GT series: 85,000 IOPS and up to 555MB/s read and 525MB/s write. It features a SandForce controller and uses the latest 25nm synchronous NAND flash memory.
Corsair Force Series GT Specs
- Formatted Capacity – 223.57GB
- SandForce SF-2281 Processor
- 25nm Synchronous IMFT NAND
- 555MB/s Read, 525MB/s write, 85k IOPS (240GB Capacity)
- Power Consumption: 0.6w idle, 2.5w active
- 240GB, 120GB and 60GB Capacities
- MTBF – 2 Million Hours
- 3 Year Warranty
- 2.5″ Form Factor – Includes 3.5″ Bracket
Be sure to check out our Corsair Force Series GT Review (120GB) for the full tear-down of this drive.
Synthetic Benchmarks
These synthetic benchmarks do not necessarily represent real-world performance; rather, they test specific areas of the drive such as maximum read and write speeds to show how well the drive can perform on its best day.
The 2MB sequential transfer benchmark represents how fast the drives can transfer large files. We can see essentially no difference between the Force GT 120GB and 240GB versions here save for the random run where the 240GB version almost doubles the 120GB’s score. The random benchmark uses incompressible data; SandForce controllers like the one the Corsair Force GT use compress data to improve performance (less reading/writing). Not all data can be compressed. The Force GT 240GB seems to be better at doing this than the 120GB.
The Force GT and the OCZ Vertex 3 are almost identical in this benchmark.
Think of the 2MB random transfer benchmark as transferring a number of separate 2MB files. The Force GT 240GB again shows the same performance as the 120GB version except in the random benchmark, where we have a repeat of the last benchmark.
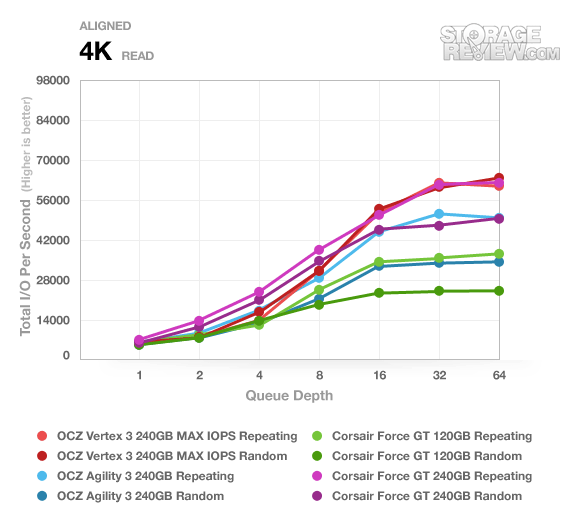
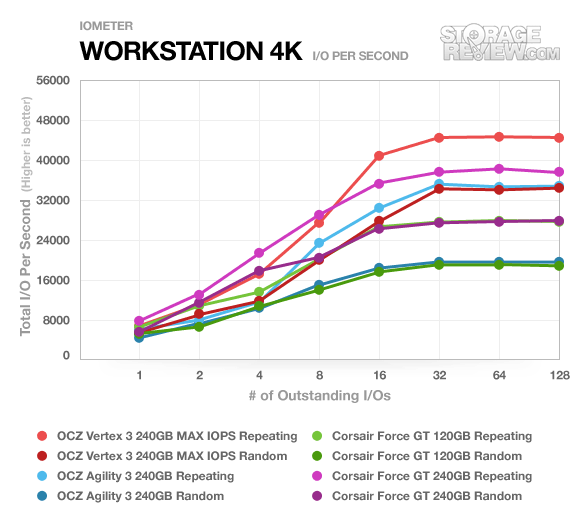
IOPS – or input/output operations per second – test the SSD’s controller. The Force GT 120GB and 240GB have almost interchangeable benchmark numbers; also, we can see the Corsairs finally gaining some ground on the OCZ Vertex 3.
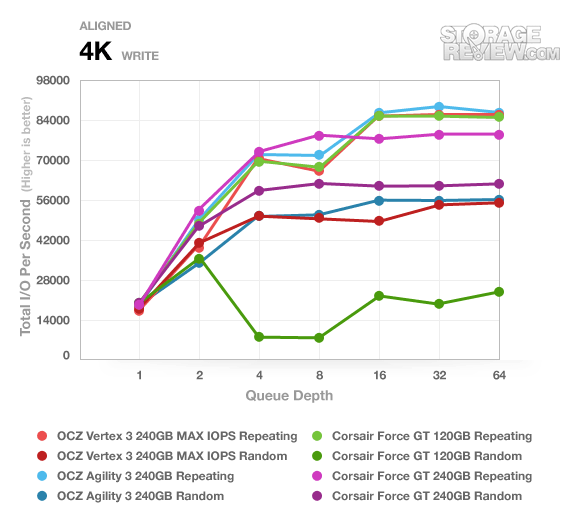
We have similar numbers here as well. More significant is the fact the OCZ Vertex 3 continues to fall behind – check out the maximum numbers.
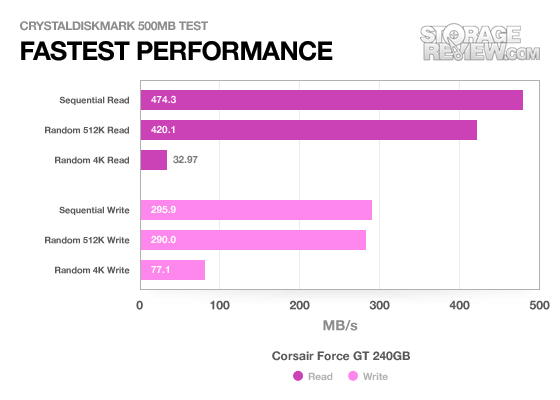
The Force GT 240GB posts great performance here and is significantly better than its 120GB counterpart; we measured 295.9MB/s and 290MB/s for the sequential write and random 512k write, respectively; for comparison, the 120GB version only posted 170.4MB/s and 170MB/s, respectively, or about 42% less.
Our last synthetic benchmarks cover how the drives perform in an enterprise environment; the drives are subjected to server-style workloads. For the general consumer these benchmarks are not as relevant. We normally expect to see a performance increase from left to right as the queue depth increases from 1 to 128.
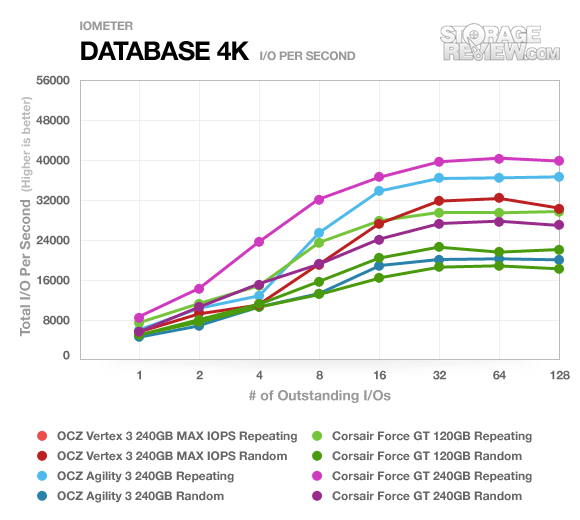
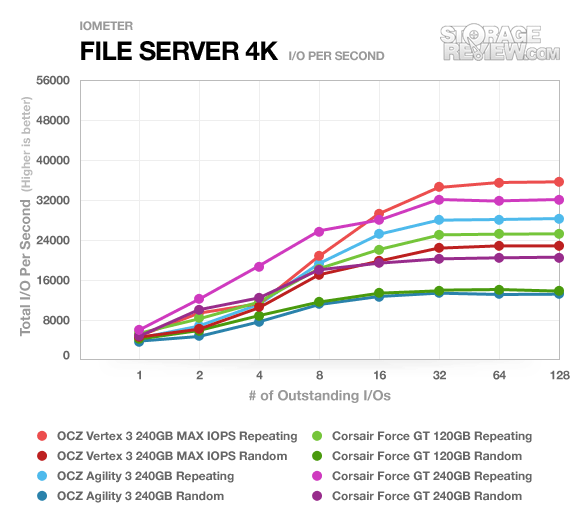
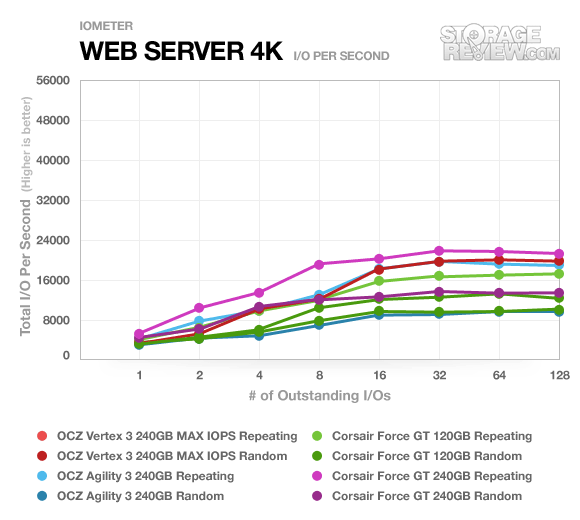
The Force GT 240GB does a lot better here, performing anywhere from 22-39% better than the 120GB version.
Real-World Benchmarks
Our real-world benchmarks are precisely that; we run actual applications and perform operations on real data to show exactly how these drives perform in the real world. There are three StorageMark 2010 benchmarks: HTPC Disk Capture, Productivity, and Gaming.
The first real-life test is our HTPC scenario. In this test we include: playing one 720P HD movie in Media Player Classic, one 480P SD movie playing in VLC, three movies downloading simultaneously through iTunes, and one 1080i HDTV stream being recorded through Windows Media Center over a 15 minute period. Higher IOps and MB/s rates with lower latency times are preferred. In this trace we recorded 2,986MB being written to the drive and 1,924MB being read.
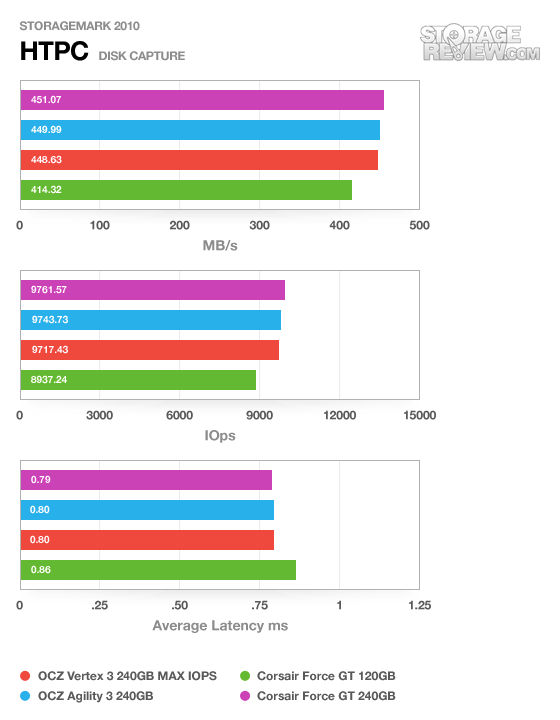
We’re seeing about a 9% performance difference between the 240GB and 120GB Force GT SSDs. This is a noticeable difference in our synthetic benchmarks but not likely a noticeable difference in the real world.
Our second real-life test covers disk activity in a productivity scenario. For all intents and purposes this test shows drive performance under normal daily activity for most users. This test includes: a three hour period operating in an office productivity environment with 32-bit Vista running Outlook 2007 connected to an Exchange server, web browsing using Chrome and IE8, editing files within Office 2007, viewing PDFs in Adobe Reader, and an hour of local music playback with two hours of additional online music via Pandora. In this trace we recorded 4,830MB being written to the drive and 2,758MB being read.
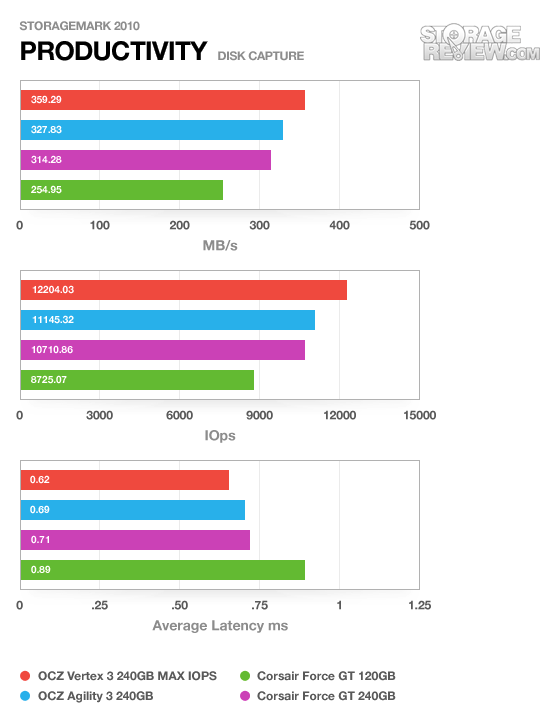
Now we’re seeing some bigger performance differences between the 240GB and the 120GB, to the tune of 29%. Additionally the latency is 19% lower. This may be due to the fact more data is written to the drives in this benchmark.
Our third real-life test covers disk activity in a gaming environment. Unlike the HTPC or Productivity trace, this one relies heavily on the read performance of a drive. To give a simple breakdown of read/write percentages, the HTPC test is 64% write, 36% read, the Productivity test is 59% write and 41% read, while the gaming trace is 6% write and 94% read. The test consists of a Windows 7 Ultimate 64-bit system pre-configured with Steam, with Grand Theft Auto 4, Left 4 Dead 2, and Mass Effect 2 already downloaded and installed. The trace captures the heavy read activity of each game loading from the start, as well as textures as the game progresses. In this trace we recorded 426MB being written to the drive and 7,235MB being read.
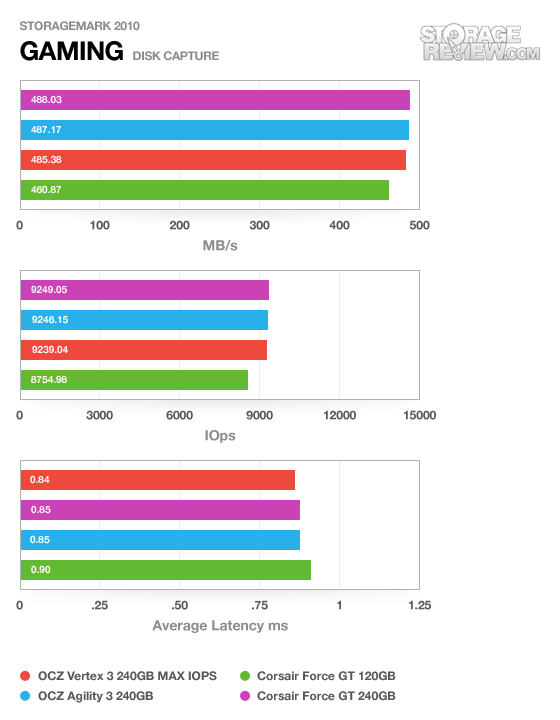
The Force GT 240GB does incrementally better than the 120GB version; it has a 5% lower latency (a good thing) and is about 6% faster overall. In all likelihood, this is not a difference that would be noticed in the real world.
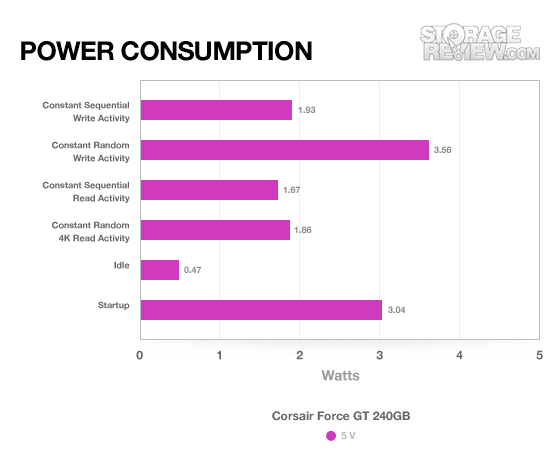
Power Consumption
SSDs are notable for their low power consumption and the Force GT 240GB is no exception to the rule. It’s more or less the same as the 120GB version in this regard. At idle the drive uses just 0.47W; a common notebook hard drive might use twice as much. The highest values we measured were 1.93W for read and 3.56W for random reads (which is kind of high for an SSD).
Conclusion
The Force GT 240GB is a slightly different animal than the 120GB model; it posts significantly better write performance across the board and was especially noticeable in our real-world benchmarks. The Force GT 240GB goes for about $460 street, making it one of the more enthusiast-level SSD offerings (budget 240GB offerings are closer to the $400 mark). The 120GB version for comparison is about $205, so slightly less per GB. Naturally the highest-capacity model carries a slight premium.
Overall the Force GT is one of the best-performing SandForce-based SSDs available today; it doesn’t have a problem keeping up with the OCZ Vertex 3. If you need more space than the 120GB version offers and the 240GB is within your budget, we highly recommend it.
Pros
- Better write performance than the 120GB version
- Blistering overall performance
Cons
- Slightly more money per GB than the 120GB version
Bottom Line
The Corsair Force GT 240GB is an enthusiast-level SSD through and through, keeping up with the best-performing offerings on the market today. It has even better write performance than the 120GB version.


 Amazon