

Scaled Sysbench is the final performance test of the all-flash EMC ScaleIO VxRack Node configured in HCI. In two-layer, we pressed the system to 99.2% capacity and saw phenomenal throughput with the four Dell servers acting as load gens. This time, with the compute and storage together in the 2U chassis, we run the same testing to see what happens. We'd expect to see more weight on the CPUs as the limiting factor, as the system has more work to, but thus far in the HCI testing, ScaleIO has proven to be extremely efficient and lightweight from an overhead perspective; something that is generally the reverse in other HCI solutions.
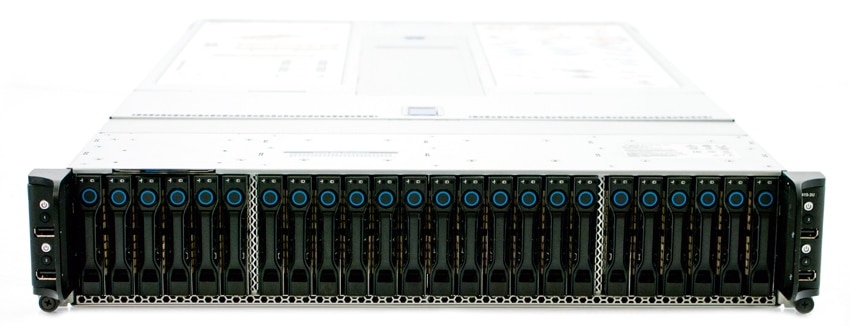
VCE VxRack Node (Performance Compute All Flash PF100) Specifications
- Chassis – # of Node: 2U-4 node
- Processors Per Node: Dual Intel E5-2680 V3, 12c, 2.5GHz
- Chipset: Intel 610
- DDR4 Memory Per Node: 512GB (16x 32GB)
- Embedded NIC Per Node: Dual 1-Gbps Ethernet ports + 1 10/100 management port
- RAID Controller Per Node: 1x LSI 3008
- SSDs Per Node: 4.8TB (6x 2.5-inch 800GB eMLC)
- SATADOM Per Node: 32GBSLC
- 10GbE Port Per Node: 4x 10Gbps ports SFP+
- Power Supply: Dual 1600W platinum PSU AC
- Router: Cisco Nexus C3164Q-40GE
Sysbench Performance
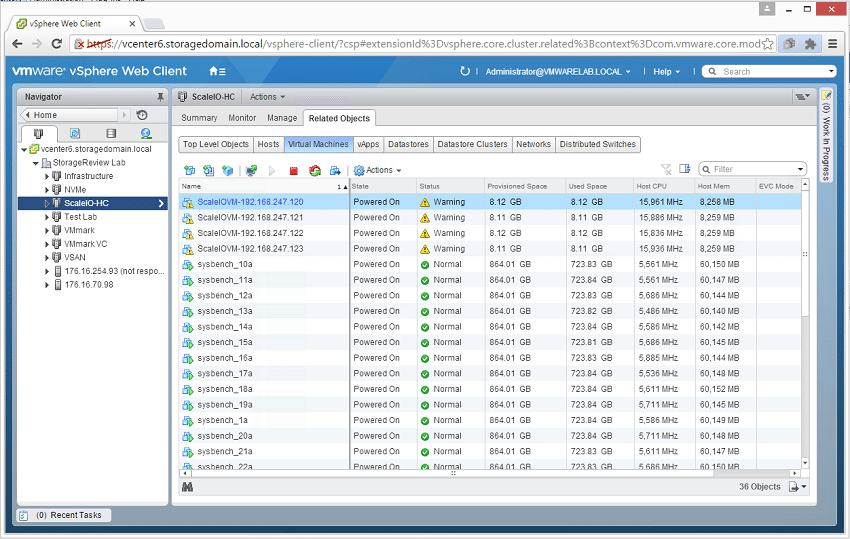
We applied the same configuration to our VxRack Node HCI test as we did with two-layer, with the exception of where the VMs were operating. In our two-layer we hosted the storage on VxRack Node, but compute was provided via four to eight Dell PowerEdge R730 13G servers. In this iteration of testing, the VxRack Nodes themselves ran the workloads. At a certain point, regardless of how fast ScaleIO is, we will see a tradeoff between two-layer and HCI where we run out of CPU cycles due to the added weight of the compute VMs in the HCI configuration and a CPU discrepancy. In the HCI case, we have eight Intel E5-2680 v3 CPUs. In the two-layer config we scaled up to eight servers at the top end, running sixteen Intel E5-2690 v3 CPUs. This translates to a discrepancy of 240GHz vs. 499.2GHz at max workload for reference.
Sysbench Testing Configuration (per VM)
- CentOS 6.3 64-bit
- Storage Footprint: 1TB, 800GB used
- Percona XtraDB 5.5.30-rel30.1
- Database Tables: 100
- Database Size: 10,000,000
- Database Threads: 32
- RAM Buffer: 24GB
- Test Length: 3 hours
- 2 hours preconditioning 32 threads
- 1 hour 32 threads
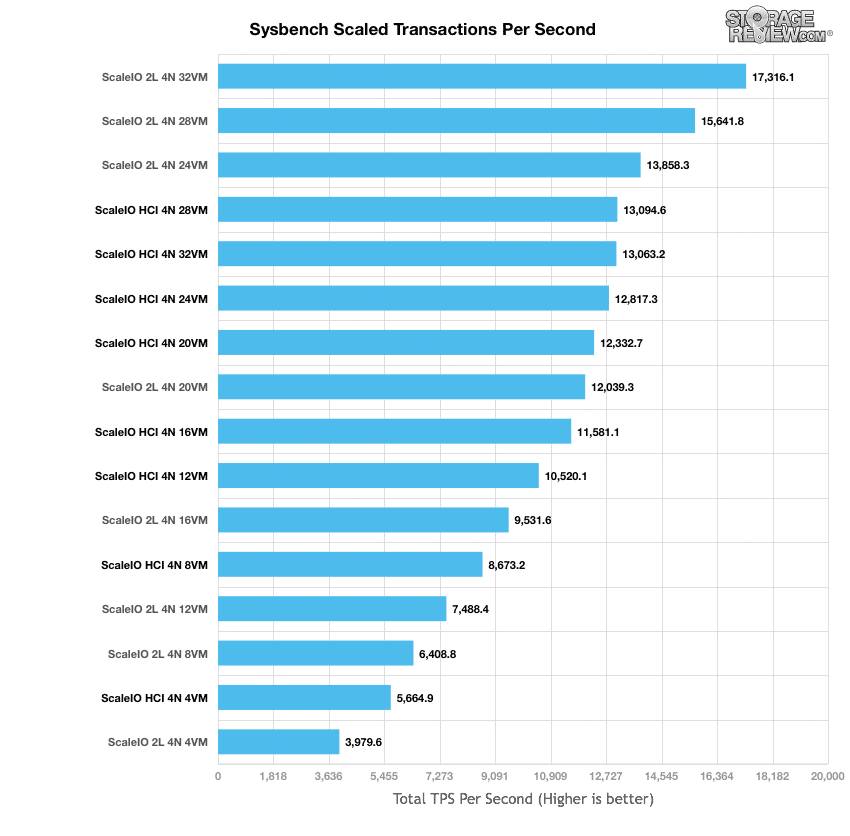
We will be comparing the EMC VxRack Node in HCI to the EMC VxRack Node in two-layer, referring to the results as HCI and 2L respectively. At 4VMs the HCI gave us 5,664.9 TPS compared to the 2L’s 3,979.4 TPS. As we continue to scale up the HCI stayed ahead of the 2L until we reached 24VMs; here, the HCI gave us 12,817.3 TPS while the 2L gave us 13,858.3 TPS. While the HCI config still slightly increased its overall aggregate performance, after 20VMs performance was tapering off and by 32VMs we saw performance start to dip down. This was a sign of the CPUs reaching their tipping point.
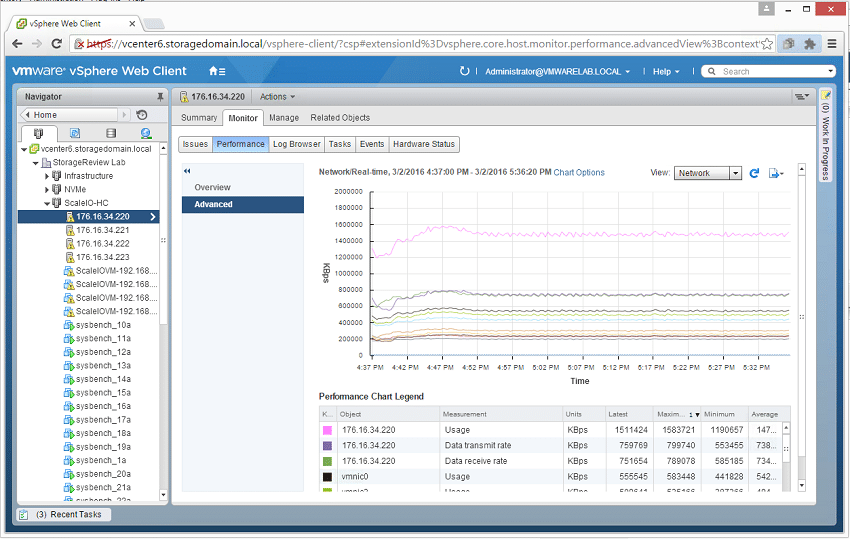
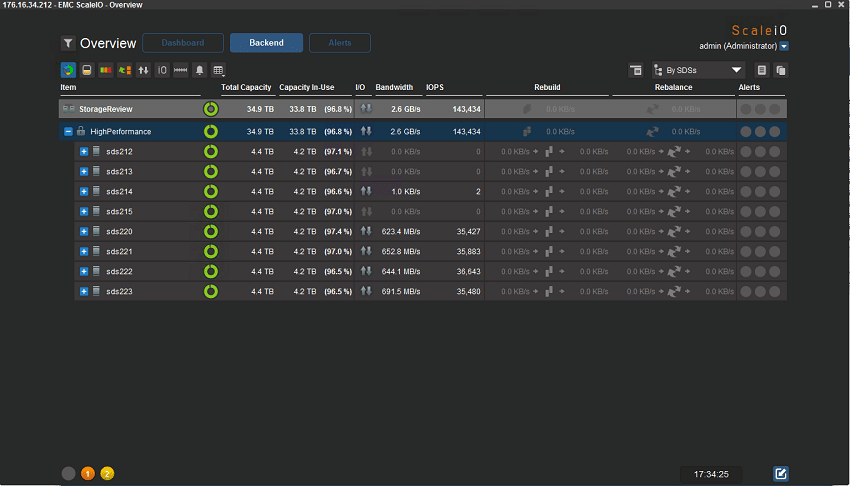
Looking at the storage impact via ScaleIO GUI with 32VMs working, we see about 2.6GB/s of traffic and a bit over 143k IOPs at the system level.
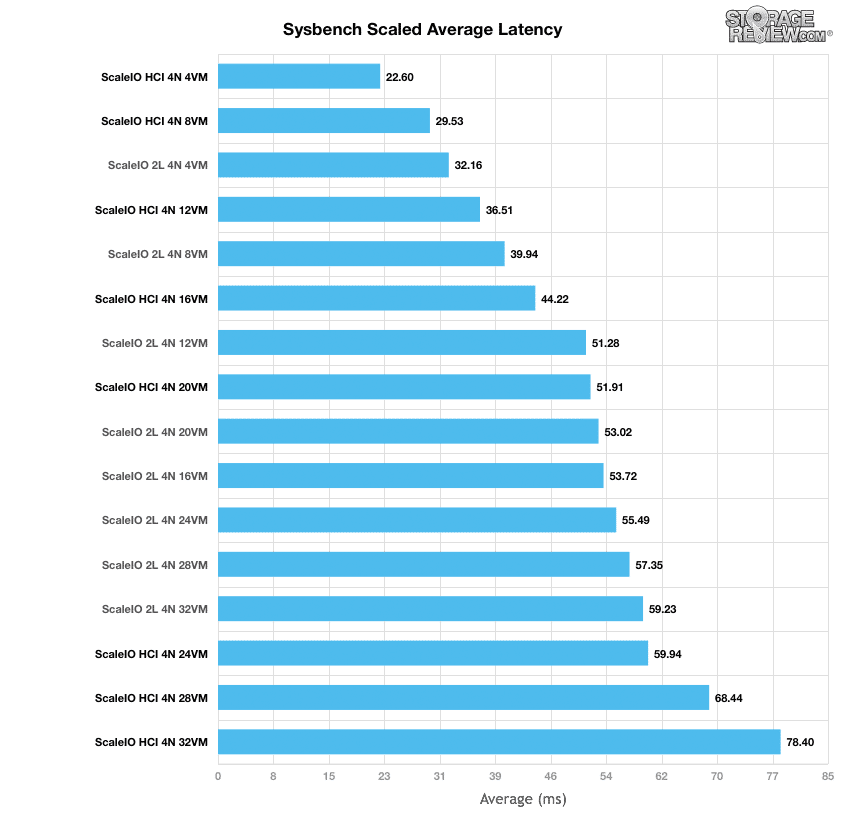
Scaled average latency paints a somewhat similar picture, with the HCI showing lower latency than the 2L at first. At 4VMs the HCI had a latency of only 22.6ms compared to the 2L’s 32.16ms. As we scaled up we slowly saw the tides turn with the 2L have lower latency starting at 24VMs on up. Still, at 32VMs the HCI only had an average latency of 78.4ms.
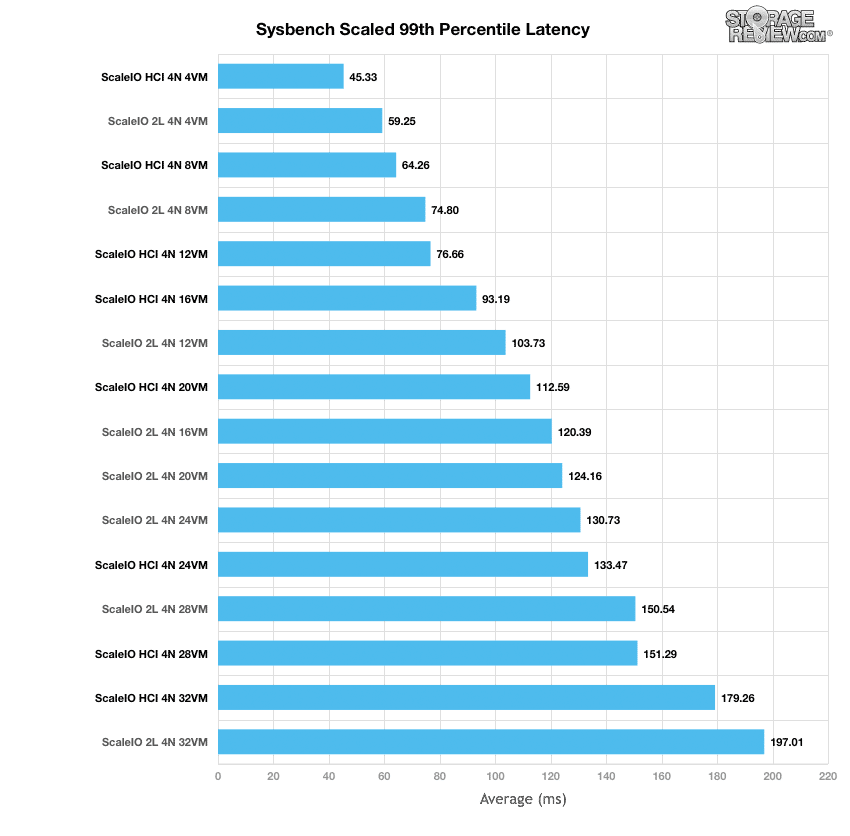
Shifting our focus towards peak latency profiles with the 99th percentile latency, here the HCI started off with lower latency (45.33ms at 4VMs) and once again lost its wining place to the 2L at 24VMs. However, once we hit 32VMs the HCI had a latency of 179.26ms beating the 2L’s 197.01ms.
Conclusion
Again, the EMC VxRack Node did extremely well in this testing. While we'd expect some management overhead in the HCI configuration, we really didn't see any adverse impact at all. In fact, the HCI configuration beat the two-layer configuration up to a point, where CPU becomes the limiting factor. This is also reflected in our recent article on SQL Server tests running on HCI, where it outperformed two-layer with lower latency metrics. Either way though, the performance was excellent, easily proving once again that ScaleIO is the leading software-defined solution on the market in terms of performance and flexibility.
Diving into the details, ScaleIO had no trouble balancing the overhead of the SDS worker operating on the same system as the MySQL workloads. With a lower clockspeed of the platform compared to our two-layer tests (2.5GHz vs 2.6GHz) we saw improved latency and higher transactional performance running in an HCI environment, with the workloads closer to the storage itself. While this might seem intuitive at first, we have never seen this play out with any other HCI environment, as they've always been slower than an external storage array attached to dedicated compute servers. The breaking point happened when our Sysbench workers consumed all available CPU resources on the cluster, losing its advantage at 20VMs running compared to two-layer.
The interesting thing to point out though is there was still storage IO left untapped, which can still be presented outside of the ScaleIO HCI cluster. This means that in addition to the HCI load, you could share out storage in two-layer mode concurrently as well. This is fundamental to the value proposition ScaleIO offers, which allows an organization to make the system bend to their needs. Being as flexible and efficient as it is, ScaleIO really never showed any weakness besides running out of capacity or running out of available CPU cycles on the hosts themselves.
EMC VxRack Node Review: Overview
EMC VxRack Node Powered By ScaleIO: Scaled Sysbench OLTP Performance Review (2-layer)
EMC VxRack Node Powered By ScaleIO: SQL Server Performance Review (2-layer)
EMC VxRack Node Powered By ScaleIO: Synthetic Performance Review (2-layer)
EMC VxRack Node Powered By ScaleIO Review: Synthetic Performance Review (HCI)
EMC VxRack Node Powered By ScaleIO: SQL Server Performance Review (HCI)
EMC VxRack Node Powered By ScaleIO: VMmark Performance Review (HCI)


 Amazon