

After our first look at EMC's VxRack Node running in HCI mode measuring synthetic workload performance, we turn our attention to SQL Server OLTP performance. In this particular test our focus is on application-level latency, instead of completely stressing the system in terms of both CPU and storage I/O. To find out just how well ScaleIO holds up under pressure, we put its HCI configuration head to head against its phenominal two-layer results to see if EMC has a few tricks up its sleeve.
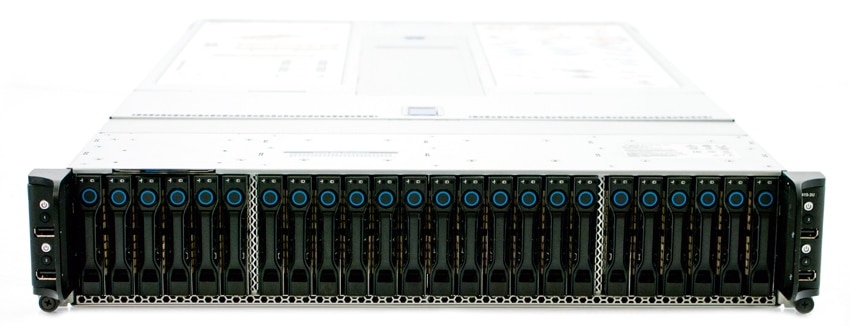
VxRack Node (Performance Compute All Flash PF100) Specifications
- Chassis: 2U-4 node
- OS: ESXi vSphere 5.5
- Processors Per Node: Dual Intel E5-2680 V3, 12c, 2.5GHz
- Chipset: Intel 610
- DDR4 Memory Per Node: 512GB (16x 32GB)
- Embedded NIC Per Node: Dual 1-Gbps Ethernet ports + 1 10/100 management port
- RAID Controller Per Node: 1x LSI 3008
- SSDs Per Node: 4.8TB (6x 2.5-inch 800GB eMLC)
- SATADOM Per Node: 32GBSLC
- 10GbE Port Per Node: 4x 10Gbps ports SFP+
- Power Supply: Dual 1600W platinum PSU AC
SQL Server Performance
Each SQL Server VM is configured with two vDisks; 100GB volume for boot and a 500GB volume for the database and log files. From a system resource perspective, we configured each VM with 16 vCPUs, 64GB of DRAM and leveraged the LSI Logic SAS SCSI controller. While our Sysbench workloads tested previously saturated the platform in both storage I/O and capacity, the SQL test is looking for latency performance. Being an HCI configuration, we have one SQL Server VM running on each of the four PF100 VxRack Nodes. At the time this data was collected, we were running ESXi 5.5 on the cluster, whereas our two-layer results were measured inside an ESXi 6.0 environment.
This test uses SQL Server 2014 running on Windows Server 2012 R2 guest VMs, being stressed by Dell's Benchmark Factory for Databases. In this test we spread out four 1,500-scale databases evenly across the EMC VxRack Node to illustrate the aggregate performance inside a 4-node VMware cluster.
SQL Server Testing Configuration (per VM)
- Windows Server 2012 R2
- Storage Footprint: 600GB allocated, 500GB used
- SQL Server 2014
- Database Size: 1,500 scale
- Virtual Client Load: 15,000
- RAM Buffer: 48GB
- Test Length: 3 hours
- 2.5 hours preconditioning
- 30 minutes sample period
SQL Server OLTP Benchmark Factory LoadGen Equipment
- Dell PowerEdge R730 VMware ESXi vSphere 6.0 Virtual Client Hosts (2)
- Four Intel E5-2690 v3 CPUs for 124GHz in cluster (Two per node, 2.6GHz, 12-cores, 30MB Cache)
- 512GB RAM (256GB per node, 16GB x 16 DDR4, 128GB per CPU)
- SD Card Boot (Lexar 16GB)
- 2 x Mellanox ConnectX-3 InfiniBand Adapter (vSwitch for vMaotion and VM network)
- 2 x Emulex 16GB dual-port FC HBA
- 2 x Emulex 10GbE dual-port NIC
- VMware ESXi vSphere 6.0 / Enterprise Plus 4-CPU
- 10GbE Switching Hardware
- Front-End Ports: Mellanox SX1036 10/40GbE Switch
- Back-End Ports: Cisco Nexus 3164 10/40GbE Switch
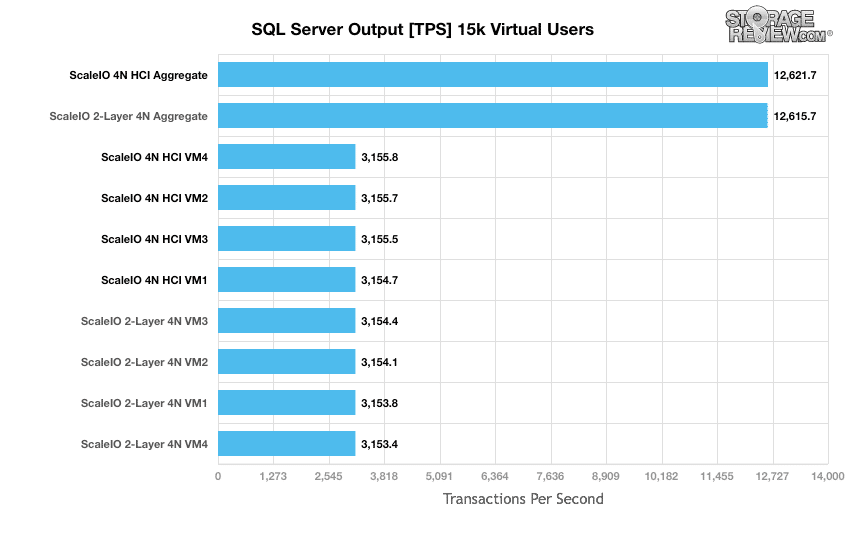
In the SQL Server TPC-C test, we look for workload balance across the cluster. With four VMs running in steady-state on four VxRack PF100 Nodes in an HCI configuration, we measured performance ranging from 3154.7 TPS to 3155.8 TPS on the low sidel. In aggregate we saw cluster-wide performance measure 12,621.7 TPS on the ScaleIO HCI cluster. Across the board ScaleIO in HCI outpaced the same storage presented to an outside compute cluster in two-layer mode.
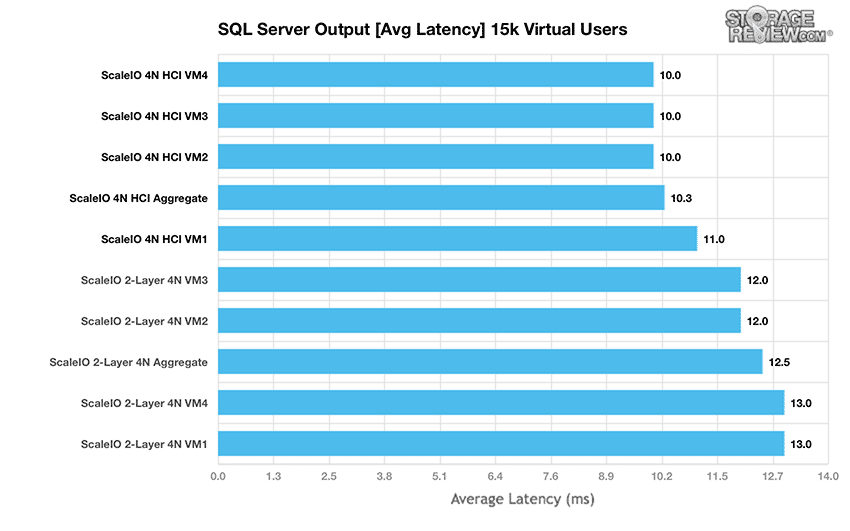
Looking at average latency across our 4 SQL VMs, we were surprised to see how well ScaleIO in an HCI configuration compared to two-layer. We've never seen HCI platforms surpass traditional storage with outside compute resources. Most of the time this is caused by compute overhead from the storage components sharing the same compute resources as the workloads. In the case of ScaleIO though, it obviously had no impact, even though we had lower-end CPUs (2.5GHz vs 2.6GHz) in these nodes compared to the servers we used in two-layer testing. Application latency across four VMs ranged from 10ms to 11ms, with an aggregate average of 10.3ms.
Conclusion
In our first look at application performance with EMC's ScaleIO VxRack Node in HCI, we are still surprised by just how well it performs. When running the application on the same hardware as the storage resources, ScaleIO software has no negative hit to the workload itself. This is an impressive feat in and of itself, considering other HCI platforms almost always sap a large percentage of CPU resources to manage background processes (some as high as 30%). To that end, our HCI results surpassed those that we measured with ScaleIO in two-layer mode, dropping average latency from 12.5ms average down to 10.3ms. For customers demanding the highest performing hyper-convereged storage solution for SQL Server, ScaleIO just upped the bar again by being the most efficient HCI solution we've ever tested.
EMC VxRack Node Review: Overview
EMC VxRack Node Powered By ScaleIO: Scaled Sysbench OLTP Performance Review (2-layer)
EMC VxRack Node Powered By ScaleIO: SQL Server Performance Review (2-layer)
EMC VxRack Node Powered By ScaleIO: Synthetic Performance Review (2-layer)
EMC VxRack Node Powered By ScaleIO Review: Synthetic Performance Review (HCI)
EMC VxRack Node Powered By ScaleIO: VMmark Performance Review (HCI)


 Amazon