

The Fujitsu Storage ETERNUS AF250 is the company’s latest all-flash array designed to meet the needs of the midmarket. The Fujitsu Storage ETERNUS AF line encompasses the company’s all-flash storage systems that they market as incredibly fast and flexible, being made for next-generation data centers. The ETERNUS AF250 is the smaller entry-level array for enterprises that are looking for the benefits of all-flash for mission-critical workloads and applications that need the performance boost. The AF250 is designed to be a cost effective array for Tier0 and Tier1 applications in small- to mid-sized enterprises.
Within its 2U-form factor, the Fujitsu Storage ETERNUS AF250 fits 24 SAS SSDs for a raw total capacity just shy of 370TB (using 15.36TB drives). This dual-controller array also has upward of 64GB of memory and supports various RAID levels. According to Fujitsu, the AF250 can hit sequential performance of 760K IOPS and random performance of 430K IOPS, with read latency as low as 170μs and write latency as low as 60μs. This level of performance makes it ideal in use cases such as real-time business analytics or VDI environments.
While 370TB seems like a lot of capacity, it depends on the enterprise. Also the 15+TB drives come at a premium that some companies would rather not pay. To this end, the AF250 has inline deduplication/compression that can increase the capacity by a level of 5. Or, to put it another way, with the same array using 15TB drives, users can see effective capacity in the 1.84PB range, all within a 2U form factor.
Our A250 review system is configured with 46TB raw system capacity, leveraging more cost effective 1.92TB SSDs.
Fujitsu Storage ETERNUS AF250 specifications:
- Form factor: 2U
- Number of Controllers: 2
- Number of host interfaces: 4/8 ports [FC(16Gbit/s), iSCSI(10Gbit/s)]
- Max System Memory: 64GB
- Supported RAID levels: 0, 1, 1+0, 5, 5+0, 6
- Host interfaces
- Fibre Channel (16 Gb/s)
- iSCSI (10 Gb/s, 10 GBASE-T)
- iSCSI (10 Gb/s, 10 GBASE-SR)
- Max Number of Hosts: 1,024
- Storage
- Max Capacity: 737TB
- Total drive bays: 48 (with expansion)
- Drive Type supported:
- 2.5-inch, SSD (15.36TB / 7.68TB / 3.84 TB / 1.92 TB / 960GB / 400 GB)
- 2.5-inch, SSD (self-encrypting) (1.92 TB)
- Drive interface: SAS (12Gb/s)
- Performance
- Latency: Write 60μs, Read 170μs (Minimum)
- Sequential access performance: 760K IOPS (100 % Read, 4 KB Blocks)
- Random access performance: 430K IOPS (100 % Read, 4 KB Blocks)
- Physical
- Dimensions (WxDxH): 482 x 645 x 88 mm (19 x 25.4 x 3.5 inch)
- Weight: 35 kg (77 lb)
- Environmental
- Temperature (not operating): 0 – 50 °C
- Humidity (operating): 20 – 80 % (relative humidity, non-condensing)
- Humidity (not operating): 8 – 80 % (relative humidity, non-condensing)
- Altitude: 3,000 m (10,000 ft.)
- Sound pressure (LpAm): 47dB(A)
- Sound power (LWAd; 1B = 10dB): 6.5B
- Power
- Power voltage: AC 100 – 120 V / AC 200 – 240 V
- Power frequency: 50 / 60 Hz
- Power supply efficiency: 92% (80 PLUS gold)
- Maximum Power Consumption: AC 100 – 120 V: 1,240 W (1,260 VA)
- Maximum Power Consumption: AC 200 – 240 V: 1,240 W (1,260 VA)
- Power phase: Single
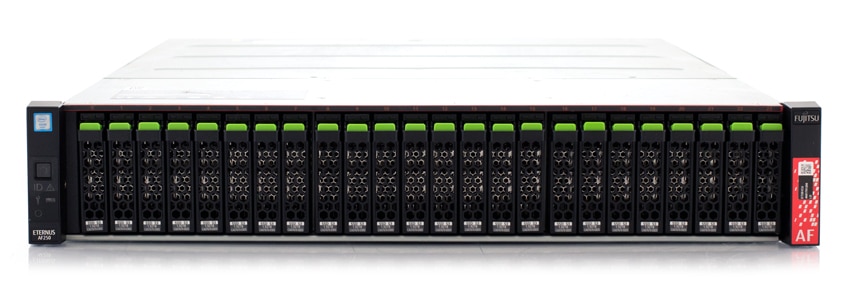
Design and Build
The Fujitsu ETERNUS AF250 is a 2U array with 24 drive bays running across the front of the device. In lieu of a fancy bezel, the AF250 sets itself slightly apart with the bright green buttons to release the drive bays. On the left-hand side, you will find the power button and LED indicator lights. On the right-hand side is the Fujitsu branding.
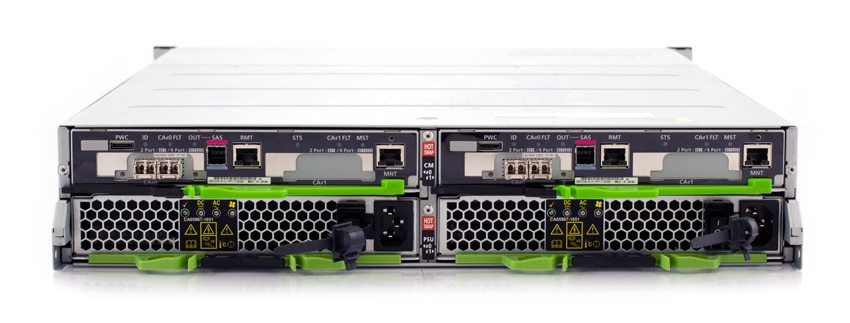
Swinging around to the rear of the device we see the dual controllers and dual power supplies. Each controller offers two CNA ports which can be configured as FC or iSCSI. Next to those are a SAS port for expansion, a remote management port, and local out-of-band management port.
Management
Fujitsu and its ETERNUS AF line is all about simplicity–from the setup to day-to-day use to its licensing model. Fujitsu applies this to the array’s GUI as well. After signing in, the main screen that comes up is Overview. As the name of the dashboard implies, it is a general overview of the system showing the hardware components (as well as whether they are normally functioning, in a state of alert, or error), overall system information, and off to the right-hand side are charts and information on RAID Groups, Thin Provisioning Pool, and Snap Data Pool.
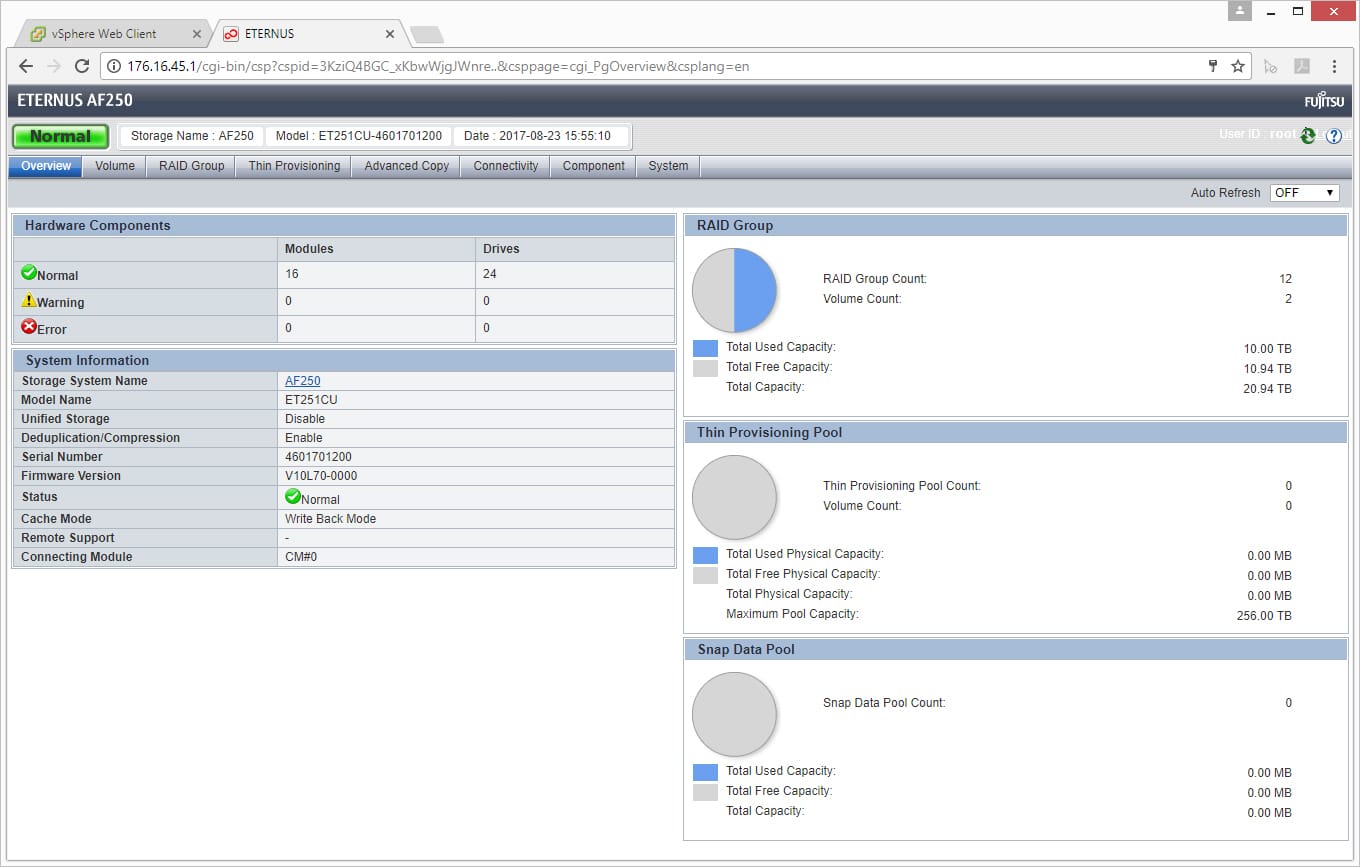
Right-click on the image and open in new tab for a larger view
The next main tab we look at is the Volume tab. From this tab, one can see the volume’s name, status, type, usage, capacity, RAID group, encryption, process, and allocation. Along the right-hand side of the screen are various actions one can take such as creating a volume, deleting one, renaming, formatting, expanding, starting or stopping RAID migration, setting allocation, and so on.
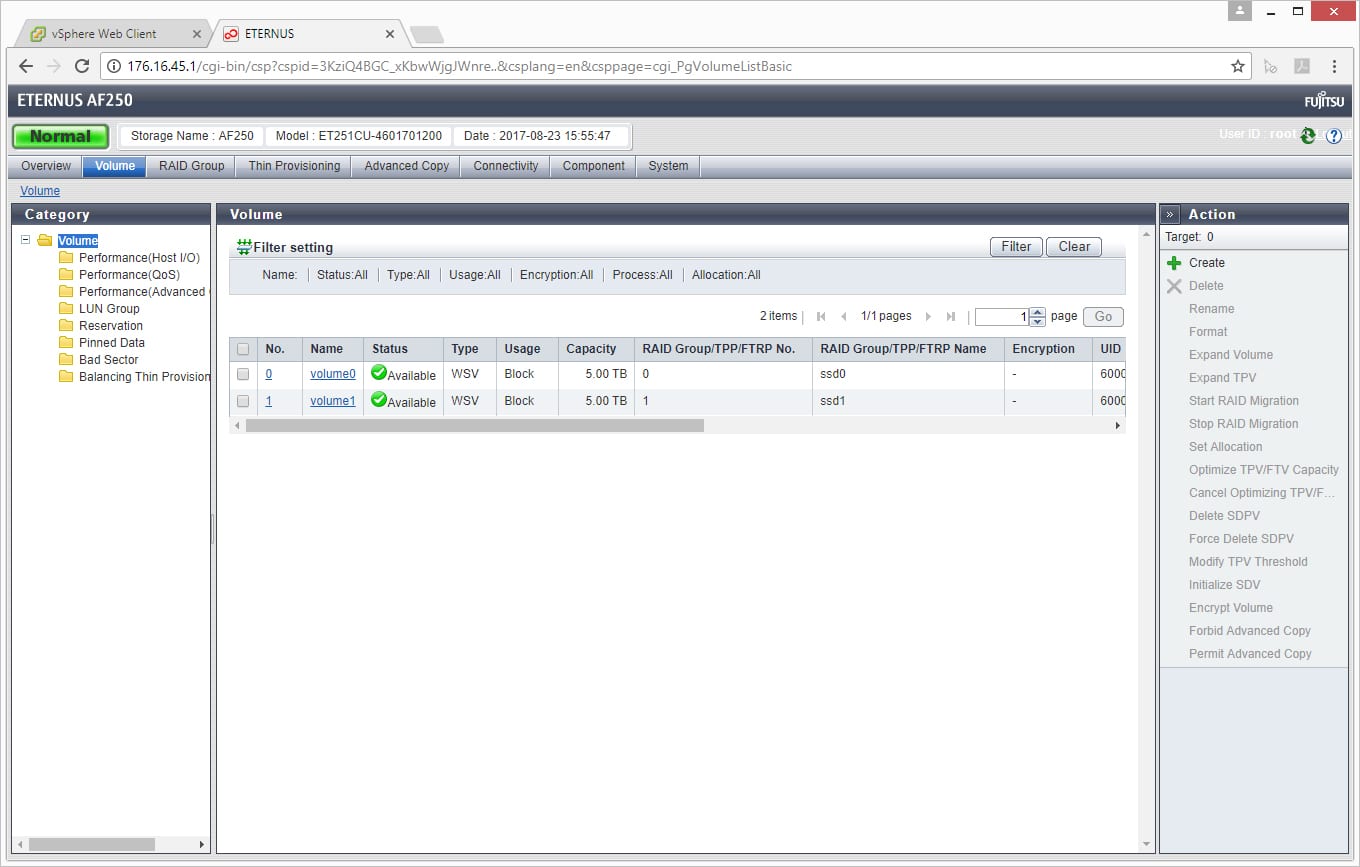
Right-click on the image and open in new tab for a larger view
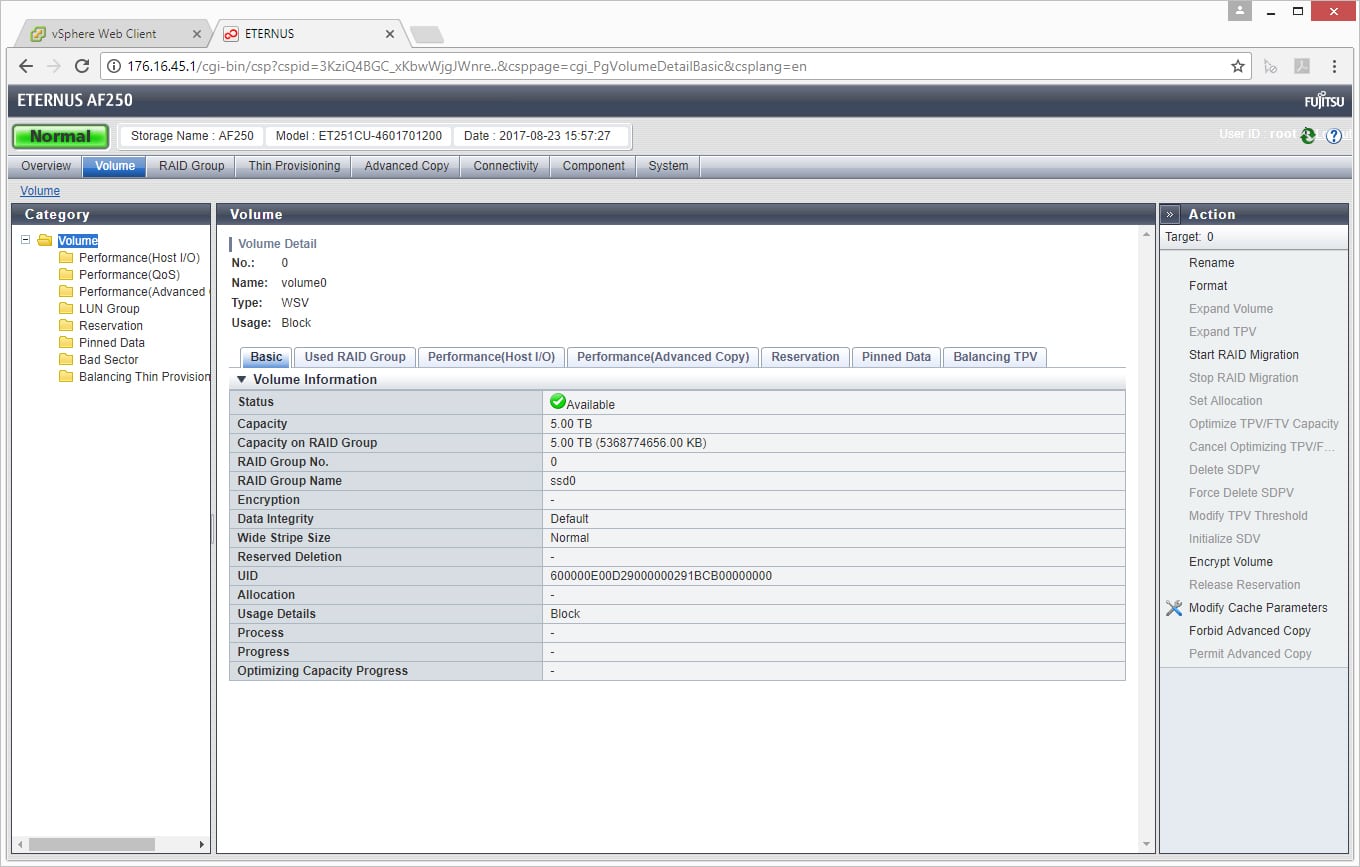
Clicking on one of the volumes (Volume0) gives users more information about the volume, while at the same time giving options on the right that can be done with the volume. Across the top, after clicking on volume, are several other sub-tabs. The basic tab gives basic information, and for this example, we can see that the volume is available, as well as its capacity, its RAID group, and so on.
Right-click on the image and open in new tab for a larger view
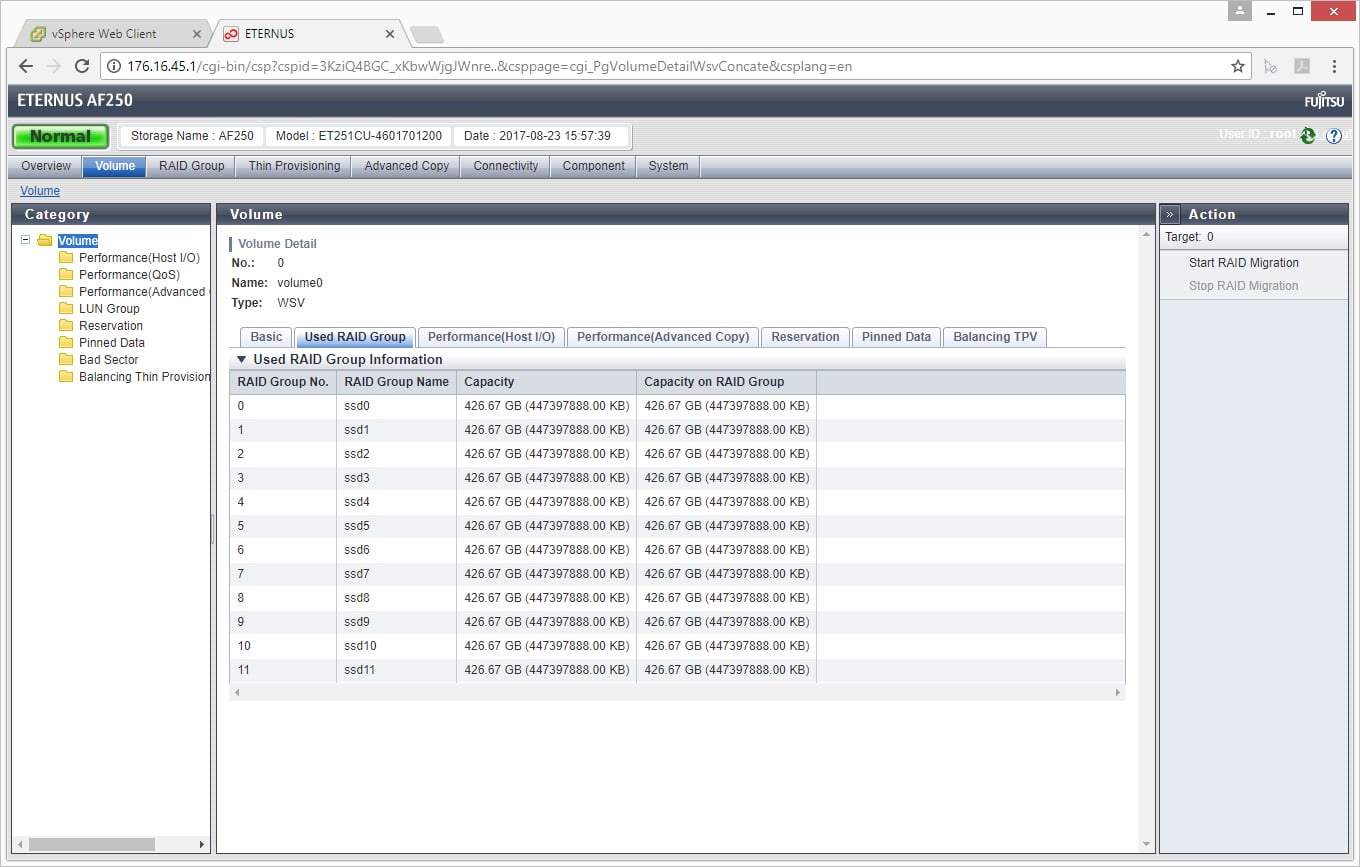
The next tab we are going to look at is RAID Group. Under this tab, users can see information such as RAID group number, name, and capacity. Also, on the right-hand side, users can take actions of either starting or stopping RAID migration.
Right-click on the image and open in new tab for a larger view
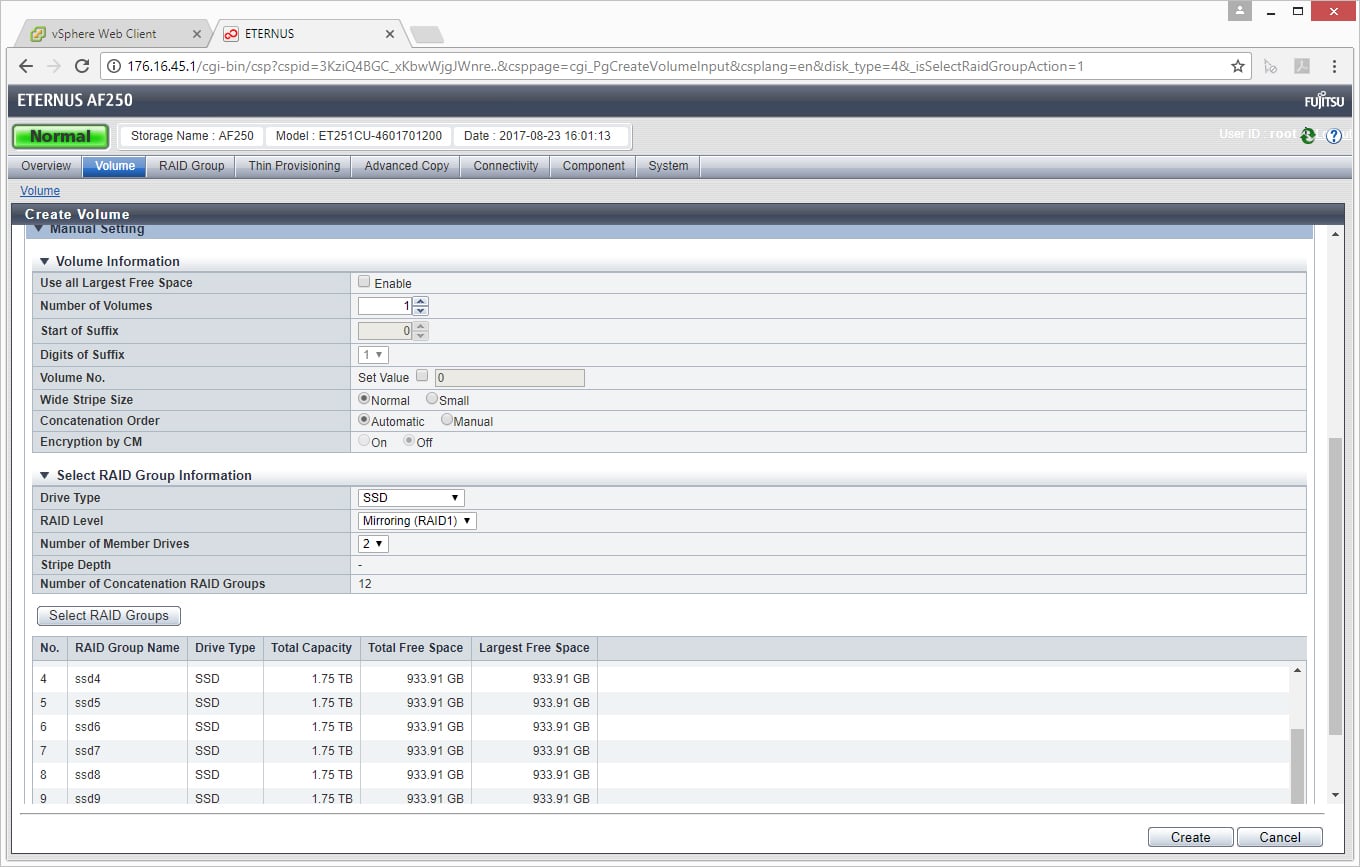
While we had two volumes set up for our testing, more volumes can easily be created by clicking on the Create button on the right-hand side of the main Volume screen. Once this is clicked, users will have to go through and add Volume and RAID Group information.
Right-click on the image and open in new tab for a larger view
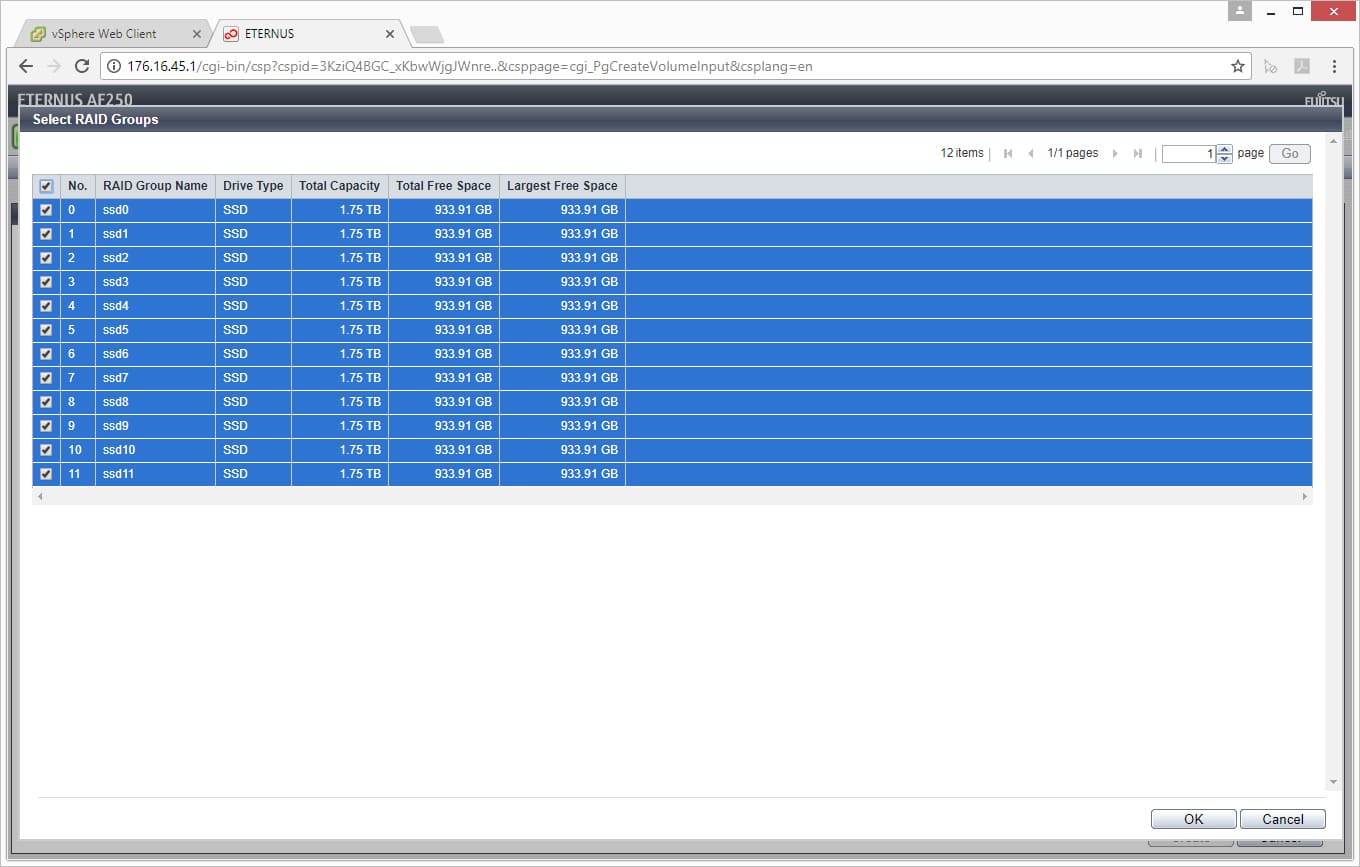
Once the information is added, users can click on the Select Raid Groups button to see which disks or RAID groups they would like to choose. Here they can see the name, type (it will be SSD for the AF line), total capacity, total free space, and largest free space.
Right-click on the image and open in new tab for a larger view
This brings us to a good segue into our next main tab, RAID Groups. Here one can easily see the number, name, status, usage, RAID level, total capacity, total free space, controlling CM, and process. Users can filter the listing of the RAID groups, create, delete, or rename new ones.
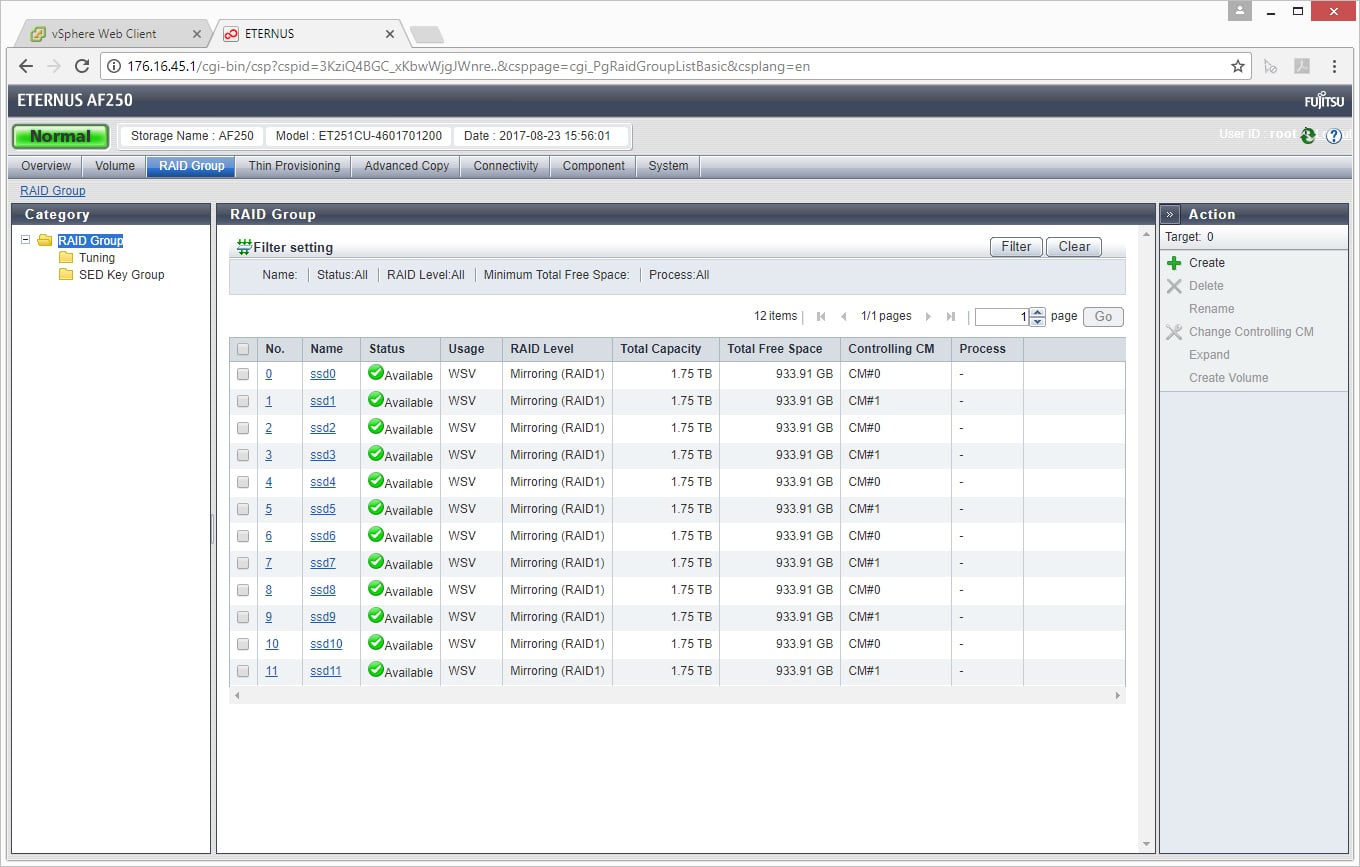
Right-click on the image and open in new tab for a larger view
By clicking on a drive we can drill down a bit deeper. Aside from the basic information and volume layout, we can look at specific drive information. This tells us the type of drive, what its capacity is, and what its usage is for.
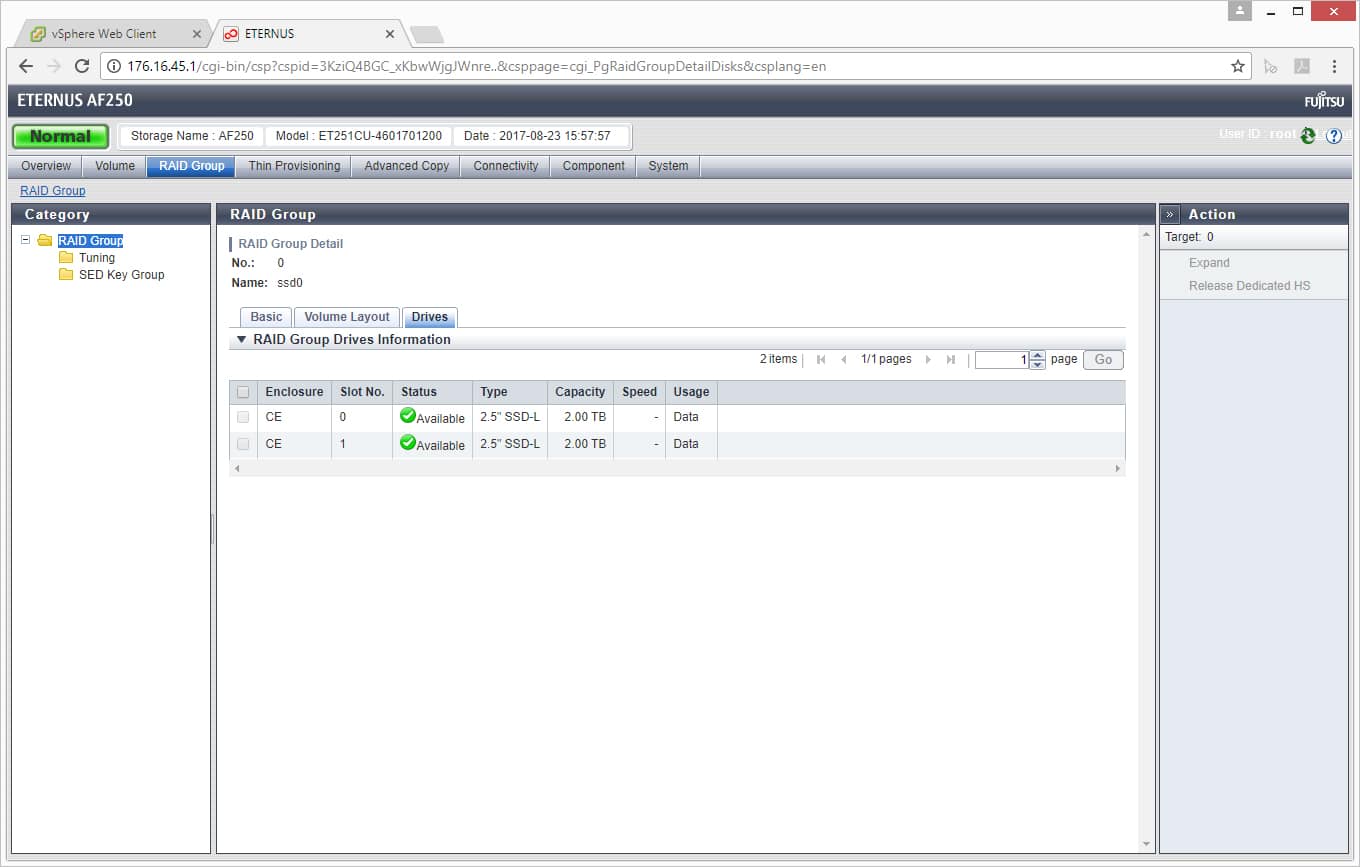
Right-click on the image and open in new tab for a larger view
The next main tab we hit is Thin Provisioning. As we had no thin provisioning pools in our setup, you will have to use your imagination some. However, one could easily create a pool on the right hand side. Once created, users would see its number, name, drive type, RAID level, status, used states, encryption, chunk size, deduplication, compression, and capacity.
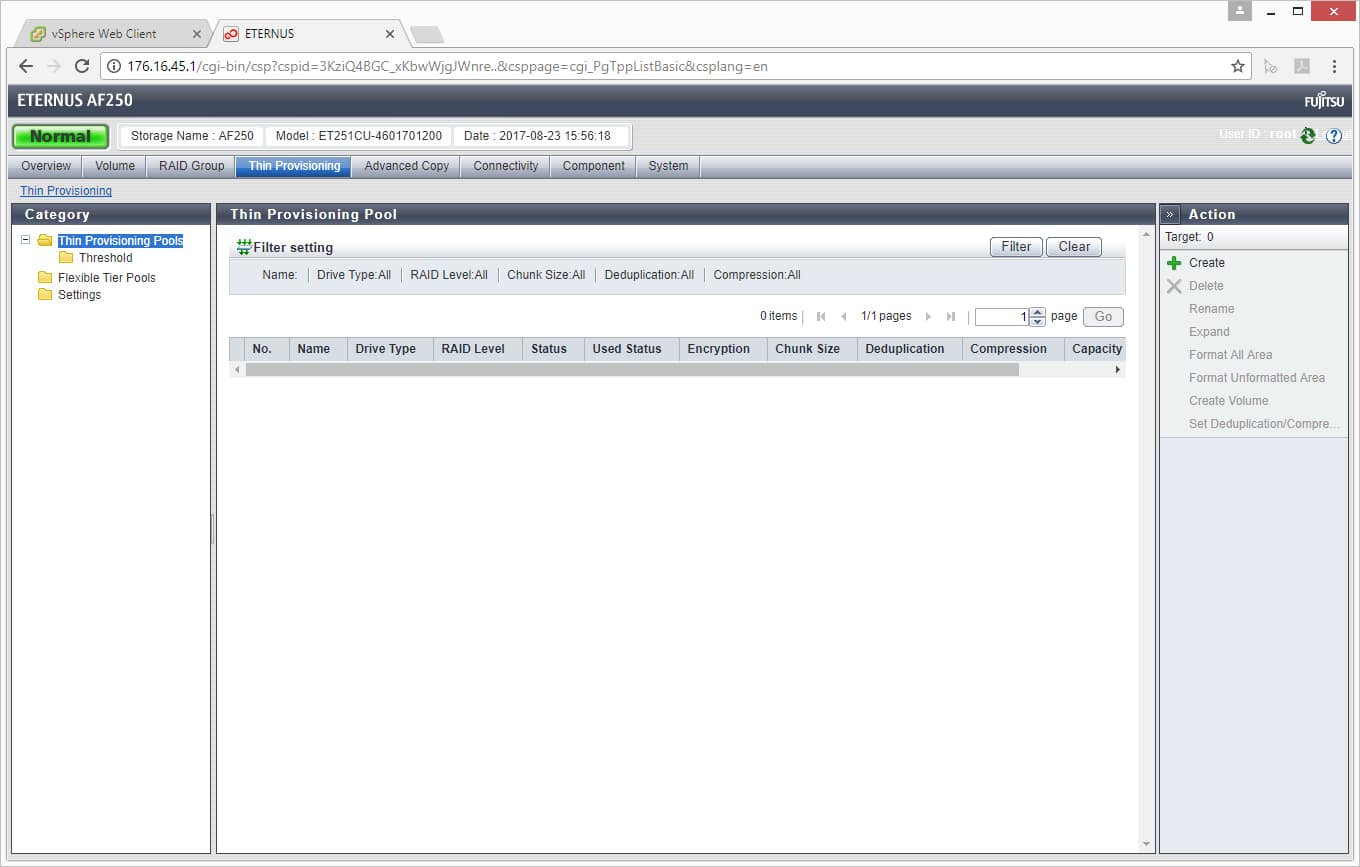
Right-click on the image and open in new tab for a larger view
The Advanced Copy tab enables users to create and keep track of advanced copies or copies of business data volumes on the AF250. From this tab, users can begin a copy session, monitor it, and see how much total capacity they have for copies (128TB in this case).
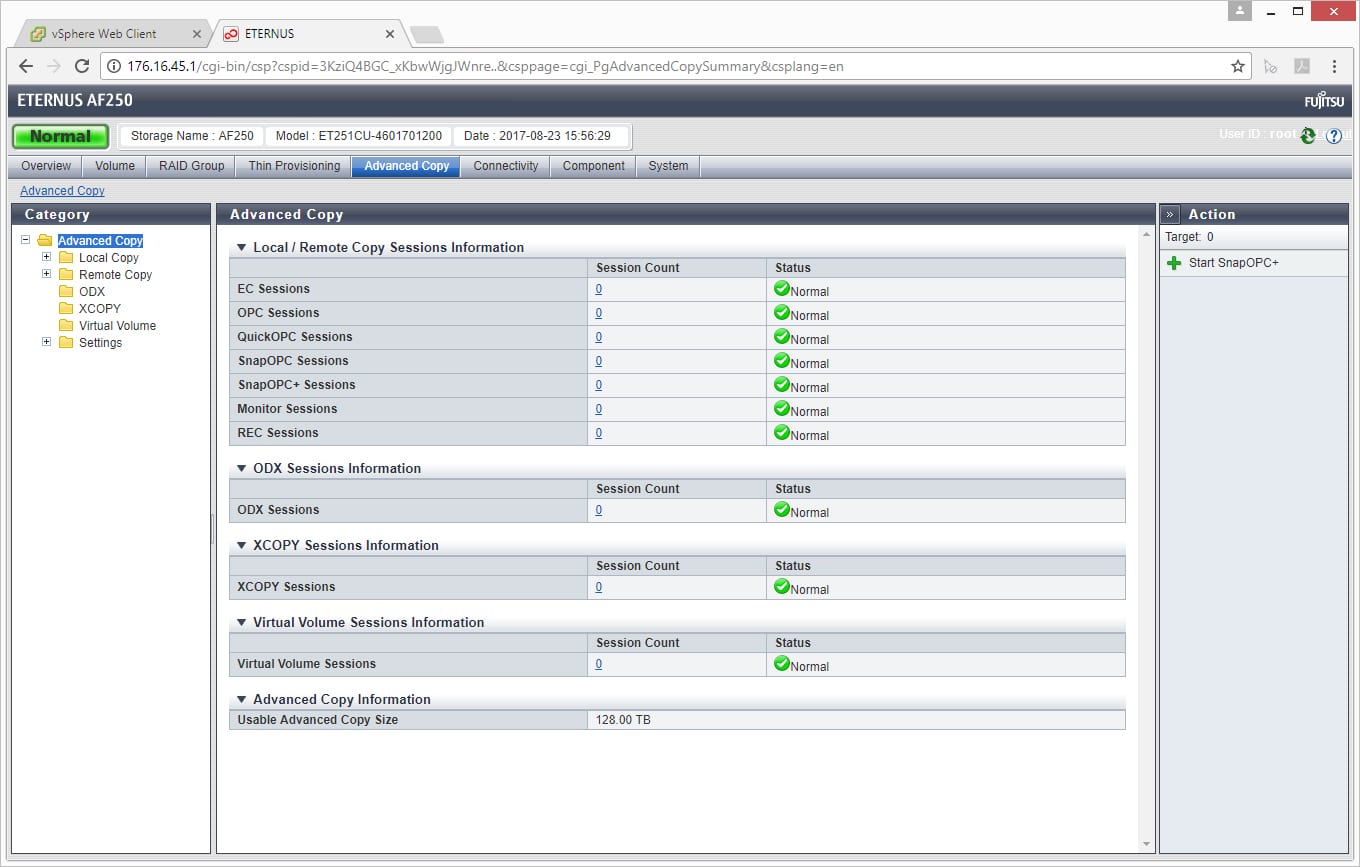
Right-click on the image and open in new tab for a larger view
The Connectivity tab is as it sounds. The main tab shows the host group, host, CA port group, CA port, LUN group, and Host response. To the right, users can add either FC/RCoE or iSCSI host groups, create FC, iSCSI, or FCoE port groups, add LUN groups, or create host affinity. On the left-hand side of the screen, users can drill down a bit more into each of the group types.
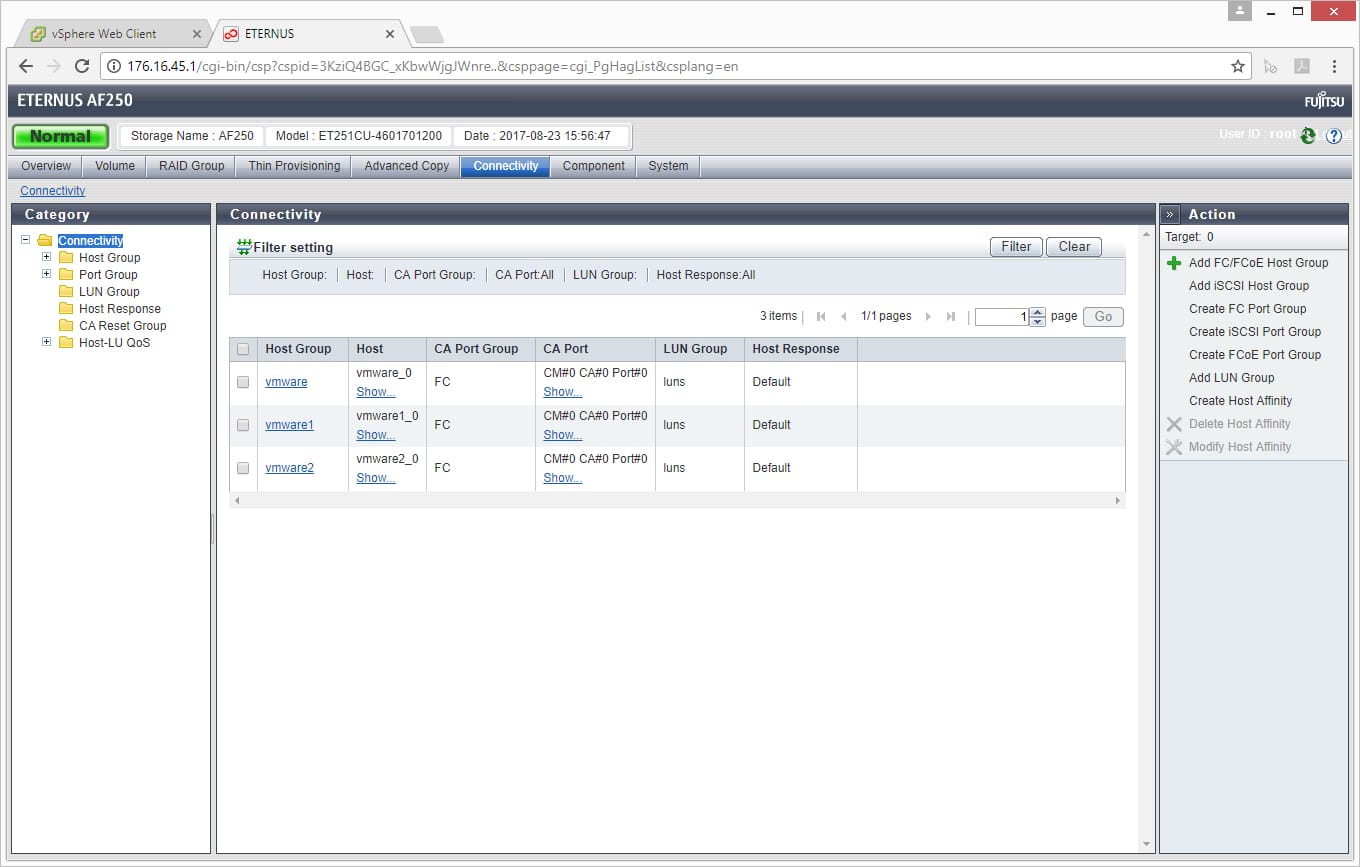
Right-click on the image and open in new tab for a larger view
Drilling down some, we look at Port groups and down into FC. Here we can see the port, its type, SFP type, status, port mode, connection, Loop ID, transfer rate, FC frame size, and reset screen.
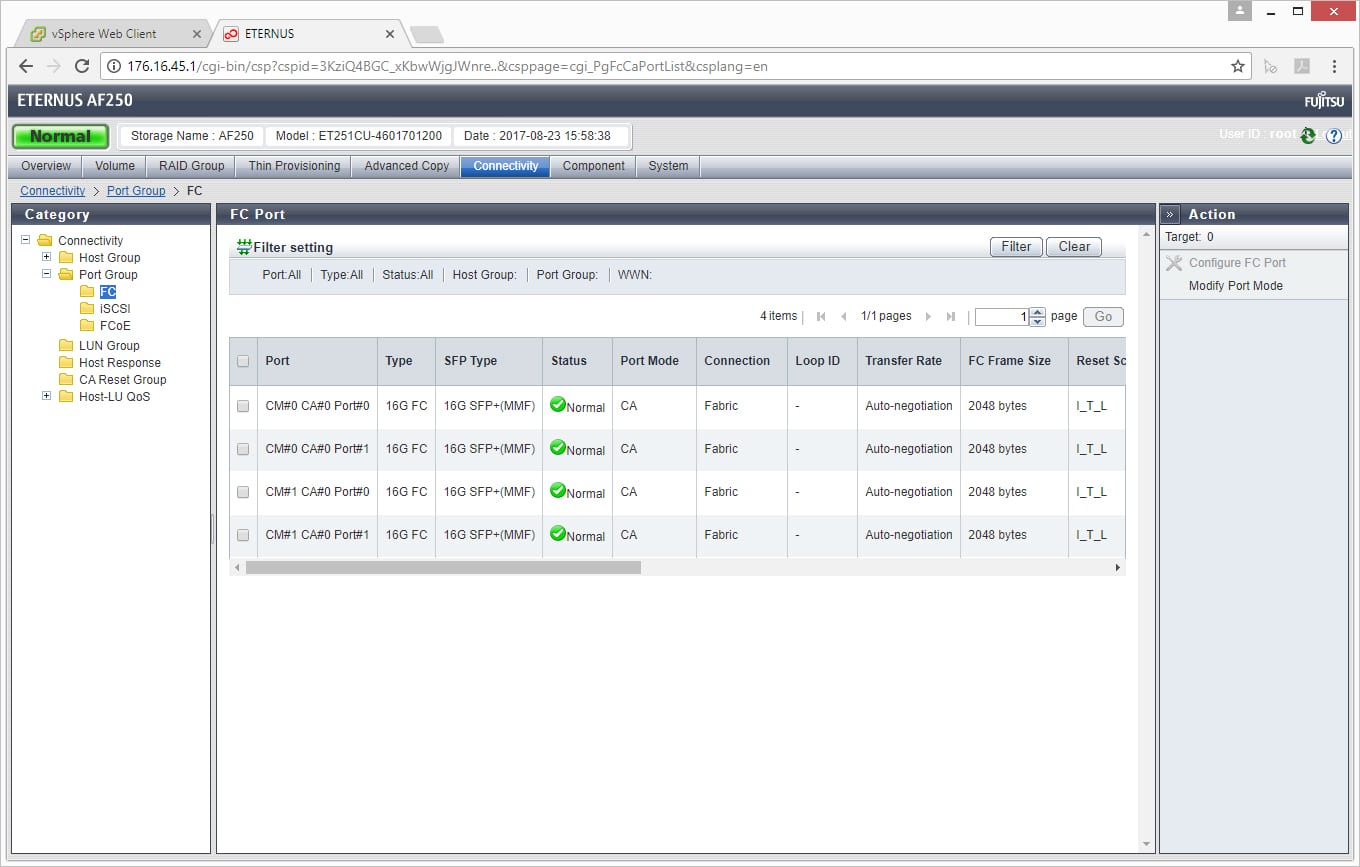
Right-click on the image and open in new tab for a larger view
We also drilled down into LUN groups. Here we see the number, name, status, number of LUNs, and LUN overlap in the LUN group.
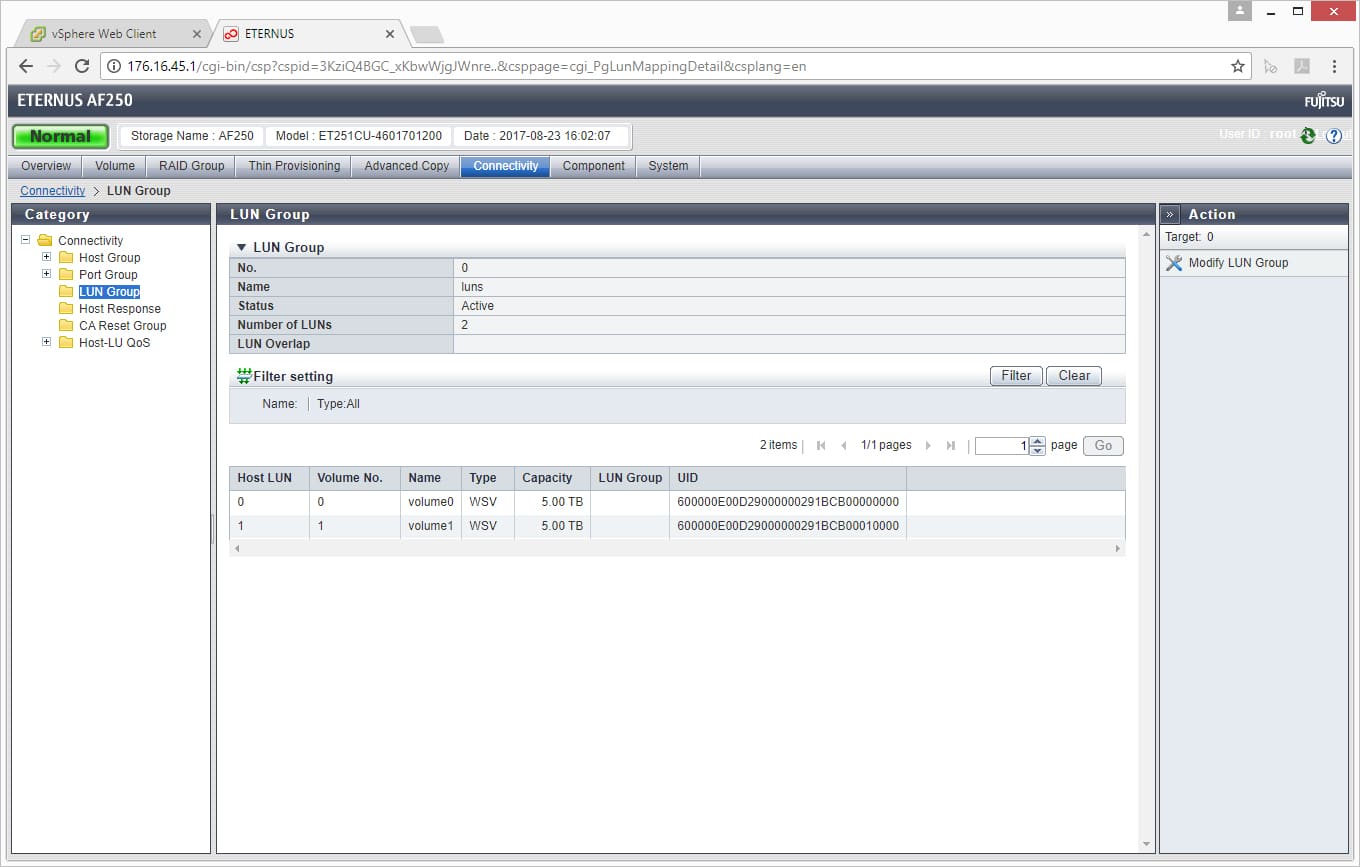
Right-click on the image and open in new tab for a larger view
The Components tab shows all components that are attached to the AF250. Users will be able to see what all is connected as well as its status to help pinpoint issues on the hardware side.
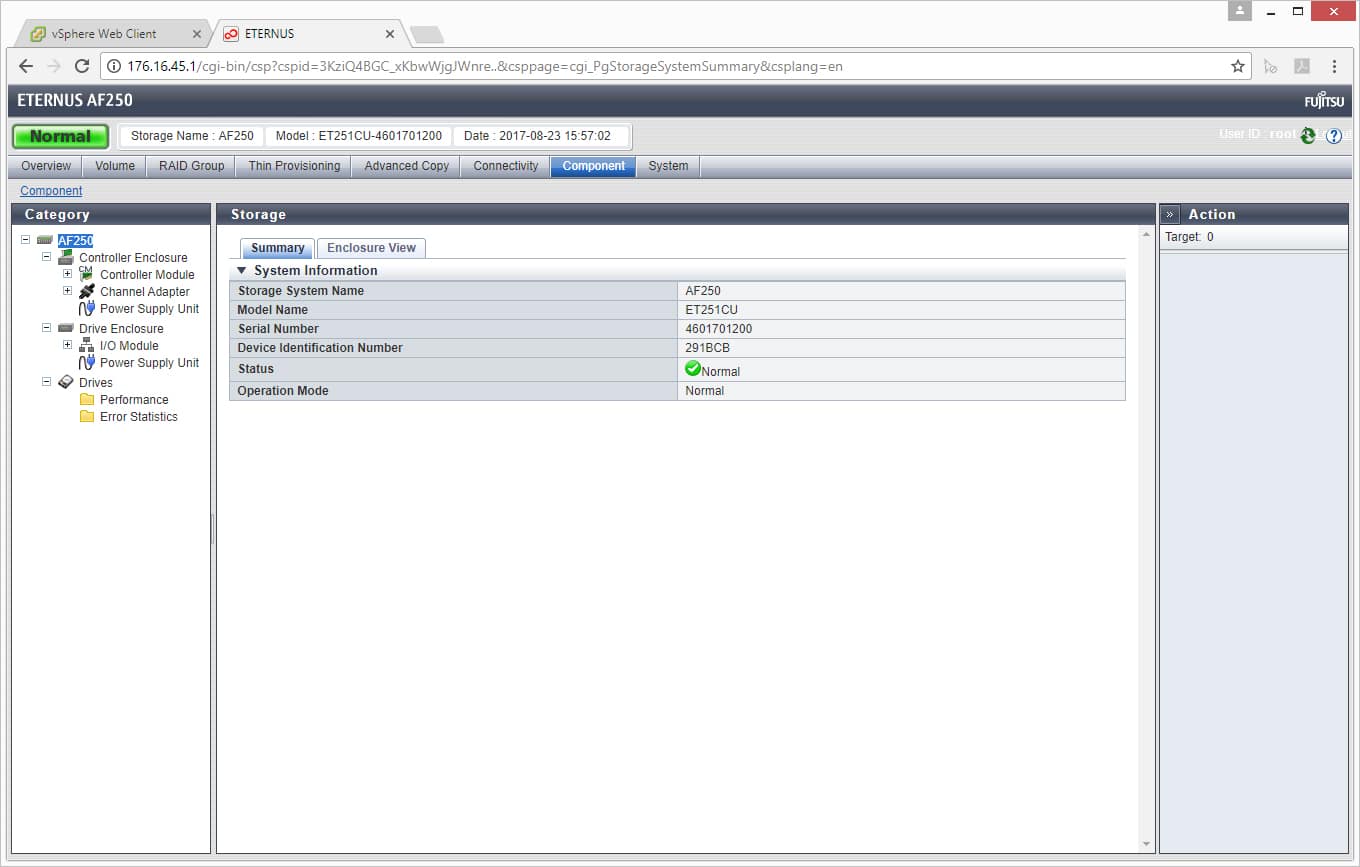
Right-click on the image and open in new tab for a larger view
And finally, the System tab gives users an overall look at the entire system. Here is where the system will be set up, changes to passwords are made, deduplication and compression is turned on/off, and where admins can check any aspect of the system.
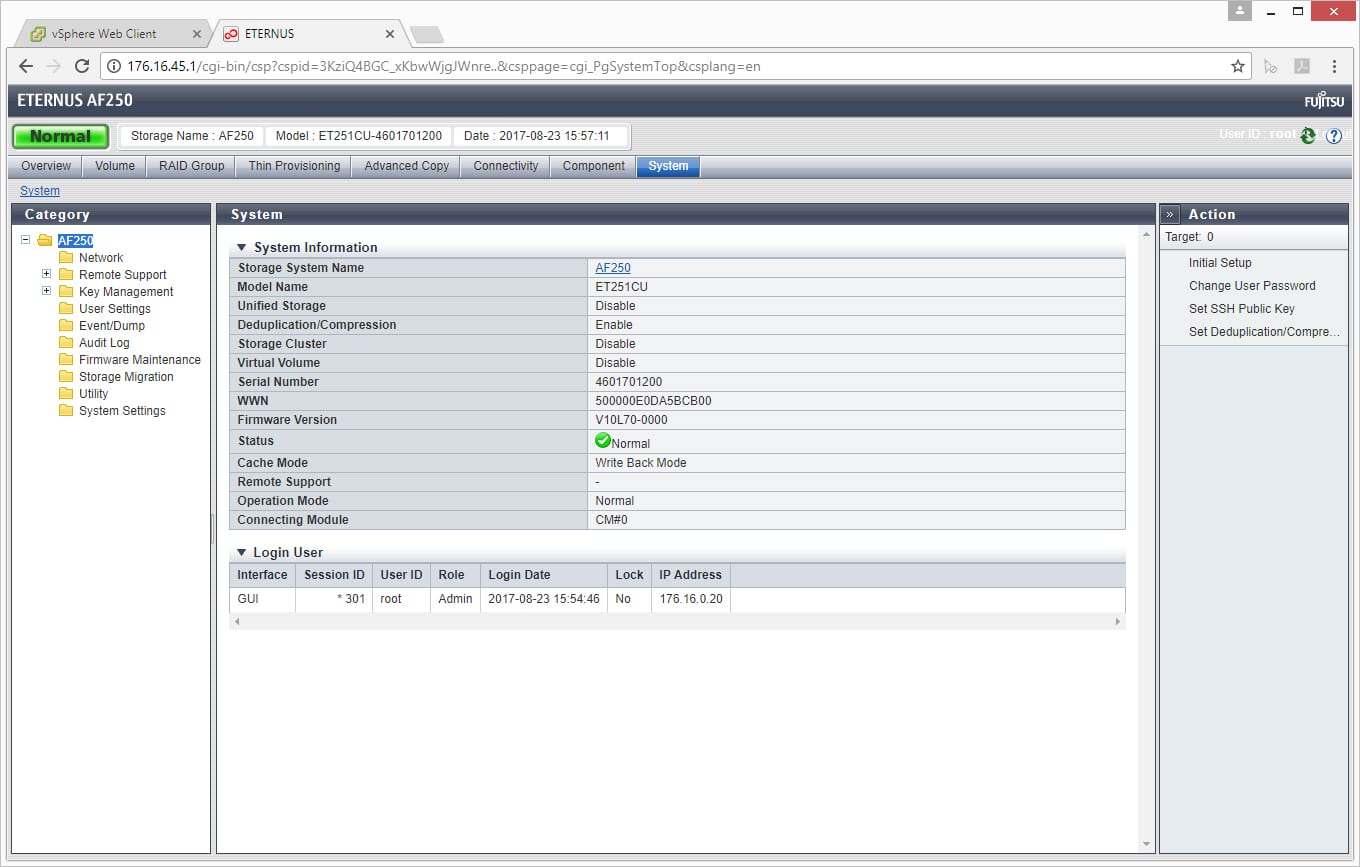
Right-click on the image and open in new tab for a larger view
Application Workload Analysis
The application workload benchmarks for the Fujitsu ETERNUS AF250 consist of the MySQL OLTP performance via SysBench and Microsoft SQL Server OLTP performance with a simulated TPC-C workload. In each scenario, the array was leveraging LUNs served from a disk group configured with 12 RAID1 SSD pairs in a wide-stripe. Two LUNs were leveraged, balanced across both controllers.
SQL Server Performance
Each SQL Server VM is configured with two vDisks: 100GB volume for boot and a 500GB volume for the database and log files. From a system resource perspective, we configured each VM with 16 vCPUs, 64GB of DRAM and leveraged the LSI Logic SAS SCSI controller. While our Sysbench workloads tested previously saturated the platform in both storage I/O and capacity, the SQL test is looking for latency performance.
This test uses SQL Server 2014 running on Windows Server 2012 R2 guest VMs, and is stressed by Quest’s Benchmark Factory for Databases. While our traditional usage of this benchmark has been to test large 3,000-scale databases on local or shared storage, in this iteration we focus on spreading out four 1,500-scale databases evenly across the AF250 (two VMs per controller).
SQL Server Testing Configuration (per VM)
- Windows Server 2012 R2
- Storage Footprint: 600GB allocated, 500GB used
- SQL Server 2014
- Database Size: 1,500 scale
- Virtual Client Load: 15,000
- RAM Buffer: 48GB
- Test Length: 3 hours
- 2.5 hours preconditioning
- 30 minutes sample period
SQL Server OLTP Benchmark Factory LoadGen Equipment
- Dell PowerEdge R730 Virtualized SQL 4-node Cluster
- Eight Intel E5-2690 v3 CPUs for 249GHz in cluster (Two per node, 2.6GHz, 12-cores, 30MB Cache)
- 1TB RAM (256GB per node, 16GB x 16 DDR4, 128GB per CPU)
- 4 x Emulex 16GB dual-port FC HBA
- 4 x Emulex 10GbE dual-port NIC
- VMware ESXi vSphere 6.5 / Enterprise Plus 8-CPU
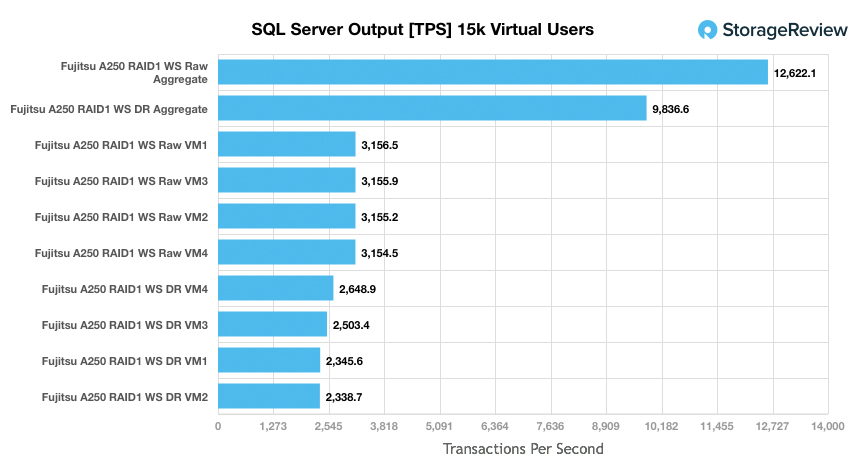
Looking at transactional performance of the Fujitsu ETERNUS AF250 in RAID1, raw performance had an aggregate of 12,622.1 TPS with individual VMs ranging from 3,154.5 TPS to 3,156.5 TPS. With the data reduction (referred to as DR for the rest of this review) the AF250 had an aggregate score of 9,836.6 TPS with individual VMs ranging from 2,338.7 TPS to 2,648.9 TPS.
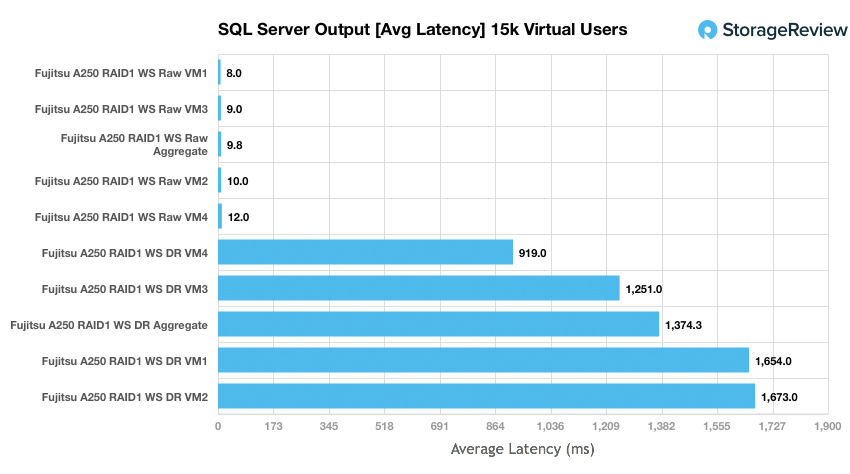
Switching over to average latency for SQL Server, the raw had an impressive aggregate score of 9.8ms with individual VMs ranging from 8ms to 12ms. With the DR on, it was much less impressive with an aggregate score of 1,374.3ms, with individual VMs ranging from 919ms to 1,673ms. In terms of peak SQL performance, 9.8ms average is exceptionally low.
Sysbench Performance
Each Sysbench VM is configured with three vDisks, one for boot (~92GB), one with the pre-built database (~447GB), and the third for the database under test (270GB). From a system-resource perspective, we configured each VM with 16 vCPUs, 60GB of DRAM and leveraged the LSI Logic SAS SCSI controller. Load gen systems are Dell R730 servers; we use four in this review, with 4VMs per host.
Dell PowerEdge R730 Virtualized MySQL 4-5 node Cluster
- 8 Intel E5-2690 v3 CPUs for 249GHz in cluster (Two per node, 2.6GHz, 12-cores, 30MB Cache)
- 1-1.25TB RAM (256GB per node, 16GB x 16 DDR4, 128GB per CPU)
- 4 x Emulex 16GB dual-port FC HBA
- 4 x Emulex 10GbE dual-port NIC
- VMware ESXi vSphere 6.5 / Enterprise Plus 8-CPU
Sysbench Testing Configuration (per VM)
- CentOS 6.3 64-bit
- Storage Footprint: 1TB, 800GB used
- Percona XtraDB 5.5.30-rel30.1
- Database Tables: 100
- Database Size: 10,000,000
- Database Threads: 32
- RAM Buffer: 24GB
- Test Length: 3 hours
- 2 hours preconditioning 32 threads
- 1 hour 32 threads
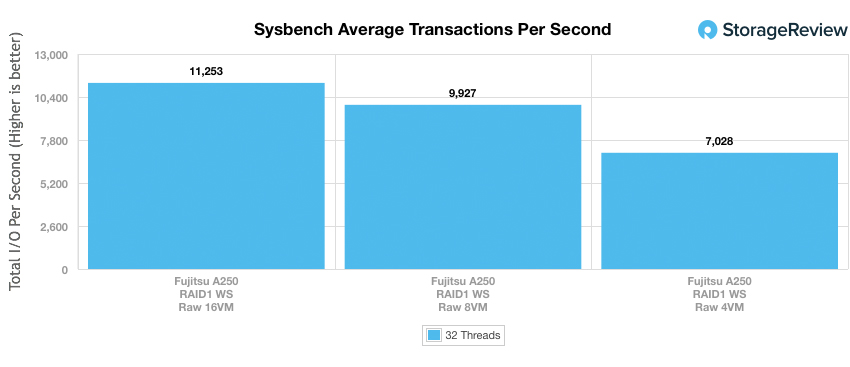
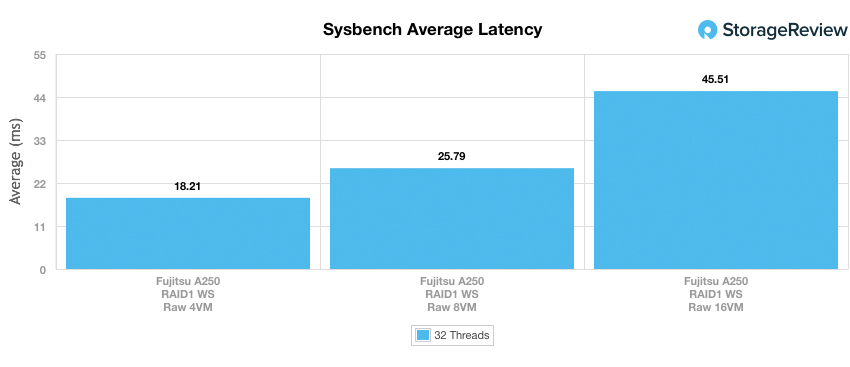
For Sysbench, we tested several sets of VMs including 4VM, 8VM, and 16VM. Unlike SQL Server, here we only looked at raw performance. In transactional performance, the AF250 had a fairly strong beginning with 7,028 TPS for 4VM and went up to 11,253 TPS at 16VM.
With average latency, the AF250 had 18.21ms at 4VM. When the VMs were doubled to 8, latency only went up to 25.79ms. Doubling the VMs once more only had the latency jump up to 45.51ms.
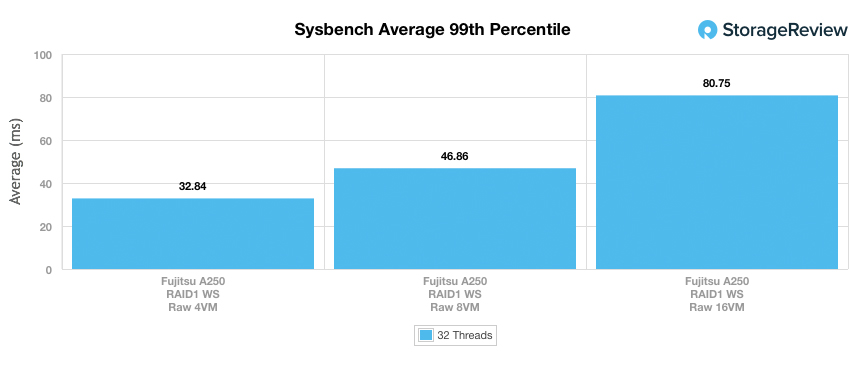
In our worst-case scenario latency benchmark, the AF250 again showed very consistent performance with a 99th percentile latency of 32.84ms at 4VM and topping out at 80.75ms latency at 16VM.
VDBench Workload Analysis
When it comes to benchmarking storage arrays, application testing is best, and synthetic testing comes in second place. While not a perfect representation of actual workloads, synthetic tests do help to baseline storage devices with a repeatability factor that makes it easy to do apples-to-apples comparison between competing solutions. These workloads offer a range of different testing profiles ranging from “four corners” tests, common database transfer size tests, as well as trace captures from different VDI environments. All of these tests leverage the common vdBench workload generator, with a scripting engine to automate and capture results over a large compute testing cluster. This allows us to repeat the same workloads across a wide range of storage devices, including flash arrays and individual storage devices. On the array side, we use our cluster of Dell PowerEdge R730 servers:
Profiles:
- 4K Random Read: 100% Read, 128 threads, 0-120% iorate
- 4K Random Write: 100% Write, 64 threads, 0-120% iorate
- 64K Sequential Read: 100% Read, 16 threads, 0-120% iorate
- 64K Sequential Write: 100% Write, 8 threads, 0-120% iorate
- Synthetic Database: SQL and Oracle
- VDI Full Clone and Linked Clone Traces
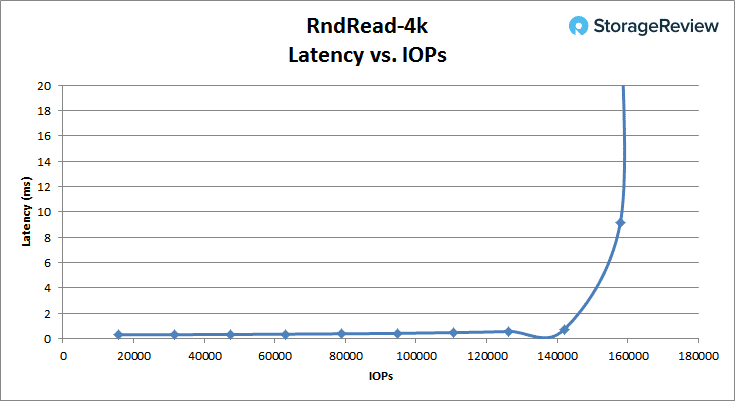
Looking at peak read performance, the Fujitsu ETERNUS AF250 was able to deliver very strong low-latency 4K read performance, measuring 0.28ms at the beginning, and staying under 1ms until it went over 142K IOPS. The array peaked at 158K IOPS at a latency of 25.77ms.
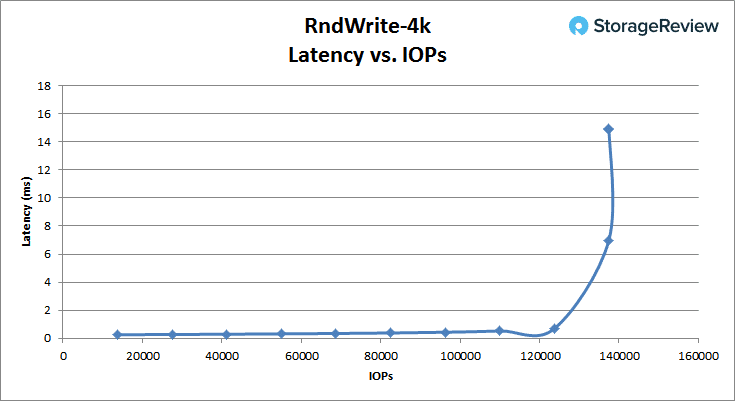
Looking at 4K peak write performance, the AF250 showed exceptional low-latency performance starting at 0.27ms and staying under 1ms until it went over 124K IOPS. It peaked at a latency of 14.89ms and IOPS at over 137K.
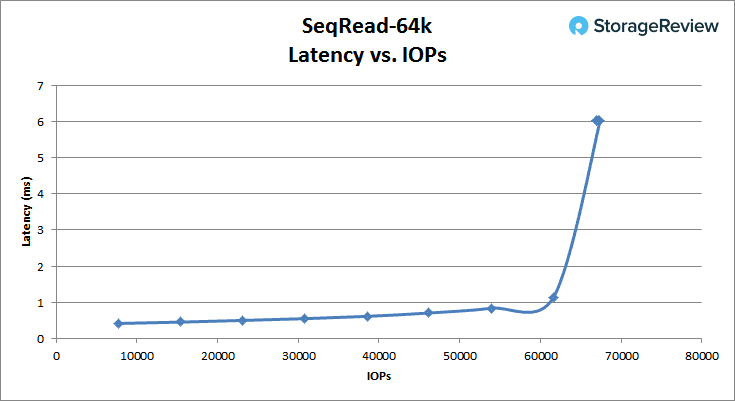
Switching to 64K peak read, the AF250 started at 0.41ms and stayed under 1ms until it hit 60K IOPS. It peaked at 67,391 IOPS with a latency of 6.01ms and a bandwidth of 4.21GB/s.
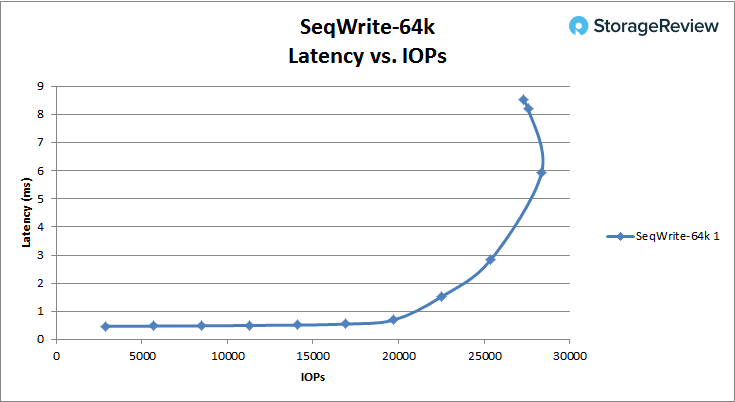
For 64K sequential peak write, the AF250 started at 0.47ms latency and stayed under 1ms until it hit over 20K IOPS. The array peaked at 27,623 at 8.5ms latency and 1.77GB/s bandwidth.
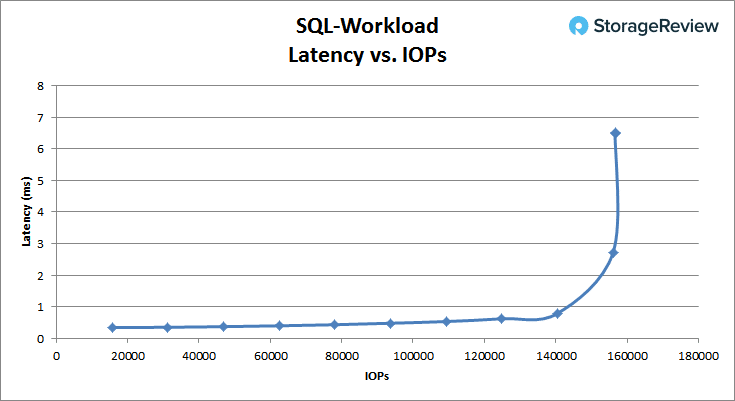
In our SQL workload, the AF250 started at 0.35ms and stayed under 1ms until it hit over 140K IOPS. It peaked at 156,638 IOPS at 6.48ms latency.
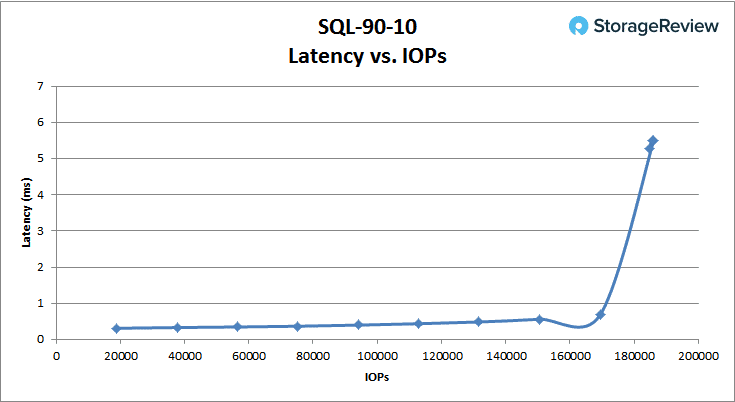
In the SQL 90-10 benchmark, the AF250 started at 0.31ms and stayed under 1ms until it went over 170K IOPS. It peaked at 186,021 IOPS at 5.5ms latency.
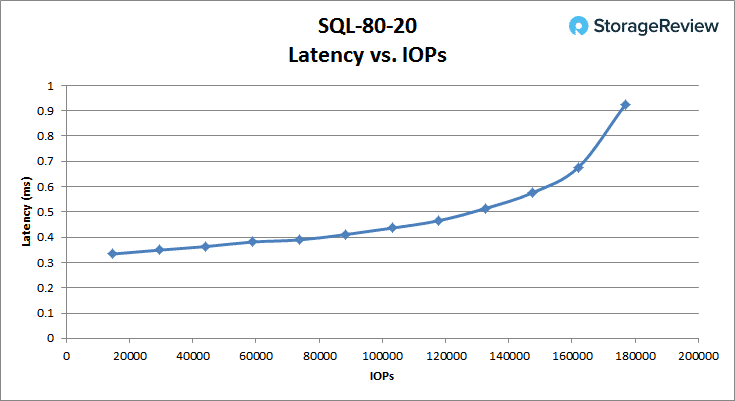
The SQL 80-20 benchmark was the most impressive in our VDbench tests to date. The AF250 was able to stay in sub-millisecond latency for the entire run. It started at 0.33ms and peaked at 0.92ms with 176,789 IOPS.
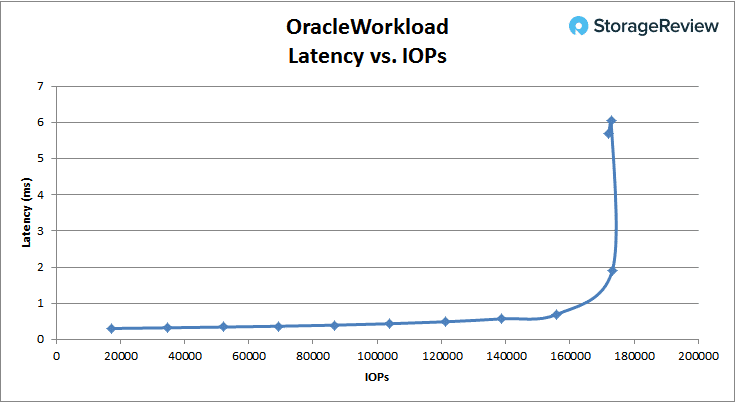
With the Oracle Workload, the AF250 started at 0.3ms and stayed under 1ms until it hit over 160K IOPS. It peaked at 172,811 IOPS with a latency of 6.05ms.
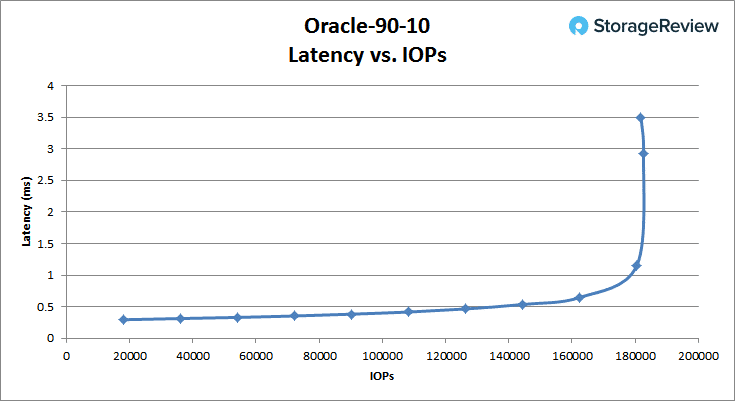
With the Oracle 90-10, the AF250 started again at 0.3ms and stayed under 1ms until it went over 170K IOPS. It peaked at 181,813 IOPS at 3.5ms latency.
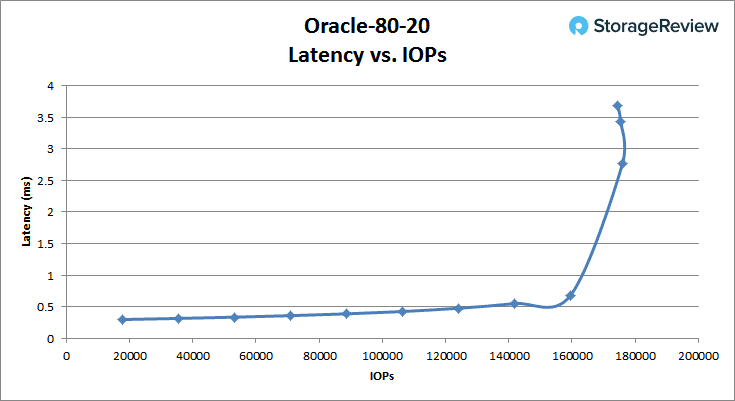
With the Oracle 80-20, the AF250 started once more at 0.3ms and stayed under 1ms until it went over 160K IOPS. The array peaked at 174,519 IOPS with a latency of 3.68ms.
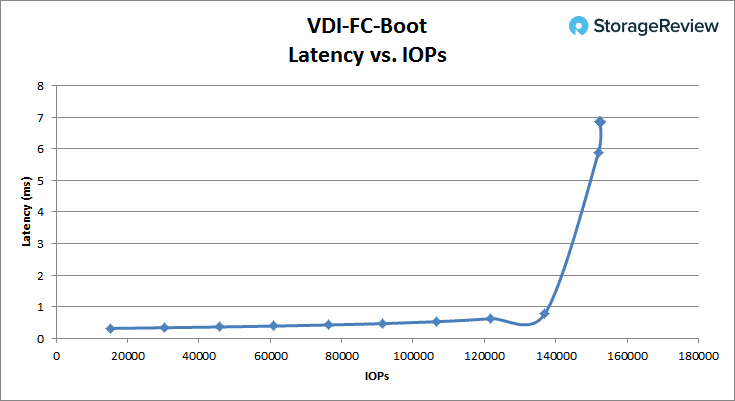
Switching over to VDI Full Clone, the boot test showed the AF250 starting at a latency of 0.32ms and staying under 1ms up to around 137K IOPS. It peaked at 152,469 IOPS with a latency of 6.84ms.
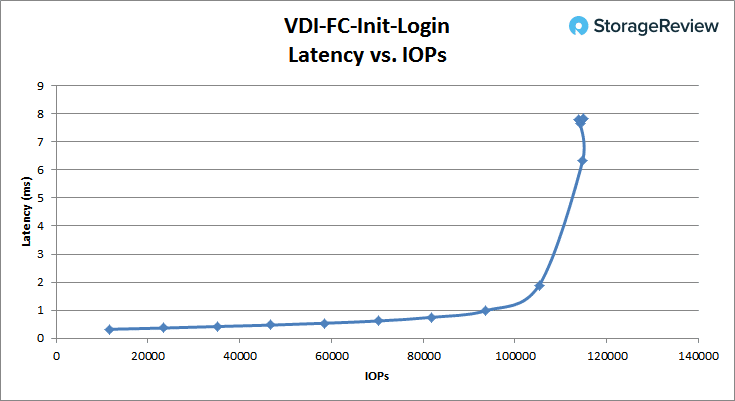
The VDI Full Clone initial login started off at 0.33ms and stayed under 1ms until just under 94K IOPS. It peaked at 113,865 IOPS at 7.8ms latency.
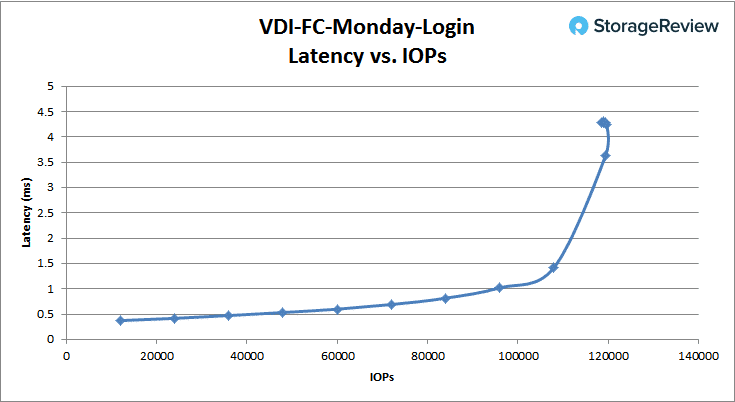
The VDI Full Clone Monday login started off at 0.37ms and stayed under 1ms until around 95K IOPS. It peaked at 118,884 IOPS at 4.3ms latency.
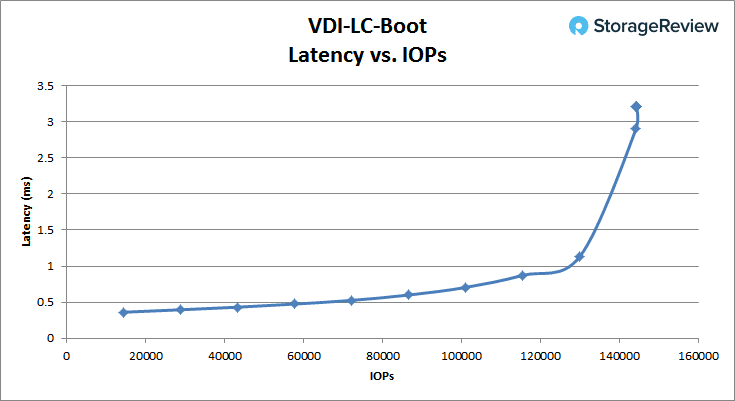
Moving over to VDI Linked Clone, the boot test showed performance starting at 0.36ms and stayed under 1ms until it hit over 120K IOPS. It peaked at 144,317 IOPS with a latency of 3.2ms.
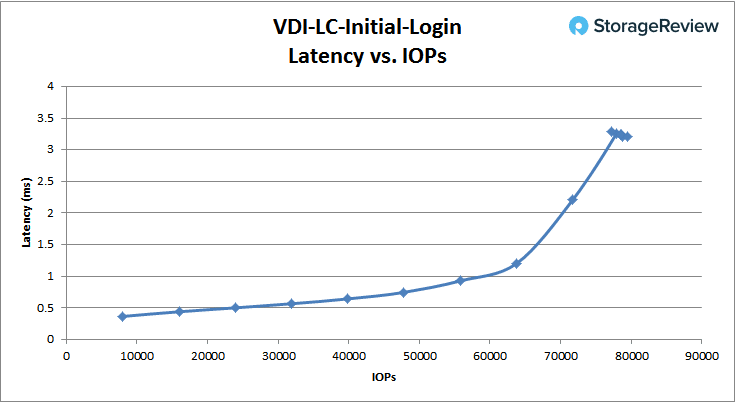
In the Linked Clone VDI profile measuring Initial Login performance, the AF250 started at 0.36ms and stayed under 1ms until around 60K IOPS. It peaked at 79,496 IOPS at 3.2ms latency.
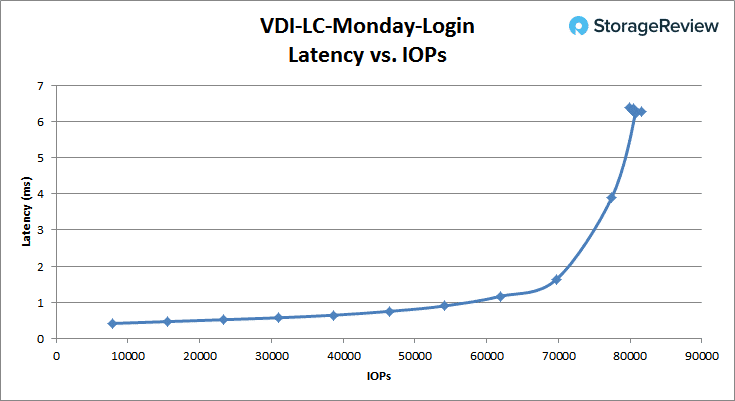
In our last profile looking at VDI Linked Clone Monday Login performance, the AF250 stated at 0.41ms latency and stayed under 1ms until about 55K IOPS. It peaked at 80,703 IOPS and 6.27ms latency.
Conclusion
The Fujitsu Storage ETERNUS AF250 is the company’s midmarket version of its all-flash ETERNUS storage line. The array can pack quite a bit of storage in its small 2U-form factor. Leveraging 15.36TB SSDs, the array can host almost 370TB without using compression and data reduction (with DR on, its effective capacity jumps all the way up to around 1.84PB, still within 2U). Capacity is one side of the coin, but if a company is going to invest in an all-flash array, performance is more than likely a top concern; the AF250 has quoted performance of 760K IOPS sequential performance and 430K IOPS random performance with 170μs read latency and 60μs write latency.
With our application workloads, we tested the array both with and without the inline data reduction services (DR) turned on. In our transactional benchmark for SQL Server, the AF250 performed well in Raw with an aggregate score of 12,622.1 TPS and an average latency of 9.8ms in aggregate. This makes it the fastest storage array for SQL Server that we have tested to date, punching well above its class. With DR on, it took a fairly big hit seeing its TPS aggregate score only hit 9,836.6 and an average latency of 1,374.3ms. Sysbench showed fairly good TPS scores (7,028 at 4VM, 9,927 at 8VM, and 11,253 at 16VM). The AF250 was able to pull off fairly good latency scores as well, with that average ranging from 18.21ms to 45.51ms and the worst-case scenario ranging from 32.84ms to 80.75ms.
Looking at VDBench tests of its raw storage in RAID1 wide-striped, it was impressive to see such strong performance at sub-millisecond latency. In random 4K, the AF250 was able to stay under 1ms until it hit 142K IOPS read and 124K IOPS write. In the 64K tests, the array stayed under 1ms until it hit 60K IOPS read and 20K IOPS write, with bandwidth scores of 4.21GB/s read and 1.77GB/s write. We ran three SQL workloads at 100% read, 90% read and 10% write, and 80% read and 20% write, with the AF250 hitting scores of 140K and 170K IOPS on the first two tests with the 80/20 test staying under 1ms throughout. The same three tests were run with an Oracle workload, resulting in performance under 1ms latency until 160K, 170K, and 137K IOPS respectively. We also ran VDI Full Clone and Linked Clone benchmarks for Boot, Initial Login, and Monday Login. The AF250 was able to hit 137K, 94K, and 95K IOPS under 1ms in Full Clone, and 120K, 60K, and 55K IOPS under 1ms in Linked Clone.
The Fujitsu AF250 turned out to be an exceptionally fierce competitor in the midmarket space, with street pricing under $100,000 for our review unit. Out of the gate, Fujitsu talks a big game in terms of the strong performance characteristics of the array, which while not uncommon, doesn’t always turn out to be the case once an array hits our lab. Across all of our tests, the AF250 proved itself well, with low latency and strong low-queue depth performance being its trademark and SQL Server results being the fastest we’ve ever recorded. While data-reduction is offered as a feature on this platform, it had a dramatic impact on performance. Fujitsu doesn’t feel it is a highly sought-after item for their customers, with many leveraging applications working with already-compressed data or applications like transactional databases where deduplication will be less effective. To make up for this though, the unit offers roughly twice the raw flash than competitive models in this price band. While effective capacity of the A250 may put it at a disadvantage for VDI or other use cases, in most other Tier0/1 workloads, performance is the key driver–and on that front, the A250 absolutely excels.
Pros
- Fastest SQL Server performance measured on a storage array to date
- Exceptionally low sub-millisecond latency across all of our synthetic workloads
- Aggressively priced with 46TB of raw flash
Cons
- Large performance overhead with data reduction turned on
The Bottom Line
The Fujitsu Storage ETERNUS AF250 is ideal for the midmarket organization that needs a cost-effective solution capable of delivering high density storage and strong performance for mission-critical workloads.


 Amazon