

As part of StorageReview’s continued advancements in both testing protocol and enterprise lab development, we’re taking a renewed look at first generation flash drives that we have previously reviewed. These re-reviews of early PCIe flash storage devices gave us the opportunity to refine and re-calibrate our enterprise review process before rolling out new reviews of second generation PCIe storage cards and application accelerators. We have been going through our revised testing methodology over the last several months with first and second-generation cards supplied from industry leaders as we hone in on testing protocols that are more relevant to the enterprise storage buyer. In this review, we’re again working with the 640GB Fusion ioDrive Duo – this time using more sophisticated tests across both Windows and Linux.
How the StorageReview team evaluates enterprise storage continues to evolve, thanks to continued input from industry leaders and key partners. This collaborative approach makes review output like this even more detailed and relevant to the industry at large. Working closely with manufacturers allows us to incorporate new testing ideas to our reviews on a continuous basis and cover items that might otherwise be overlooked. Below readers will find over 70 charts dedicated to analyzing the ioDrive Duo nearly to the point of minutia; and this doesn’t even include the new series of application-level benchmarks that are under development. While the detail may seem overbearing to some, to others who need a specific piece of kit to solve a storage problem, these details are critical. The entire review is posted below in a single page, as always, for reader convenience.
Before diving into the ioDrive’s performance, it’s important to highlight a few of the key differences between Fusion-io’s flash storage and a typical SSD. Flash on SSDs (as the name Solid State Drive correctly implies) is hidden behind a SATA or SAS interface, obfuscating the NAND for compatibility reasons. With the ioDrive product, users essentially get access to a flash memory storage tier, which offers much lower latency and better overall performance than an SSD. The reasons for this come down to architecture and the way the ioDrive interfaces with the host system.
Where an enterprise PCIe SSD often has multiple block-device controllers and an additional chip to RAID together multiple devices on a single card, Fusion-io takes a different approach to life. Fusion ioMemory interfaces with NAND Flash like a processor would interact with system memory, this is done using a combination of Fusion-io’s NAND controller (FPGA), which communicates directly over PCIe, and Fusion-io’s driver or Virtual Storage Layer software installed on the host system to translate the device into a traditional block-device. Through Fusion-io’s Virtual Storage Layer or VSL, the software emulates a block device for compatibility, although recently Fusion-io has released an SDK that allows native access (bypassing the kernel block layer) within some applications.
IoMemory is also non-traditional in the sense that it consumes system resources for the VSL drivers to function, leveraging the host CPU while also creating a footprint in system memory. According to Fusion-io, this architecture more closely resembles the architecture of RAM, hence the name ioMemory. The benefits include faster file location lookups and even though ioMemory hits the CPU, its usage is highly efficient and actually drives performance by lowering transactional latency. In terms of management, another core architecture benefit is since Fusion-io uses an FPGA as the NAND controller, it allows for very low-level software/firmware updates that can address bug fixes and performance enhancements. This contrasts with standard SSD controllers, where fundamental changes can only be made via fabricating a new controller.
Fusion-io ioDrive Duo Specifications
- Single Level Cell (SLC)
- 320GB ioDrive Duo SLC
- 1.5GB/s Read Bandwidth (64kB)
- 1.5GB/s Write Bandwidth (64kB)
- 261,000 Read IOPS (512-byte)
- 262,000 Write IOPS (512-byte)
- Access Latency 0.026ms (512-byte)
- 640GB ioDrive Duo SLC
- 1.5GB/s Read Bandwidth (64kB)
- 1.5GB/s Write Bandwidth (64kB)
- 252,000 Read IOPS (512-byte)
- 236,000 Write IOPS (512-byte)
- Access Latency 0.026ms (512-byte)
- 320GB ioDrive Duo SLC
- Multi Level Cell (MLC)
- 640GB ioDrive Duo MLC
- 1.5GB/s Read Bandwidth (64kB)
- 1.0GB/s Write Bandwidth (64kB)
- 196,000 Read IOPS (512-byte)
- 285,000 Write IOPS (512-byte)
- Access Latency 0.029ms (512-byte)
- 1.28TB ioDrive Duo MLC
- 1.5GB/s Read Bandwidth (64kB)
- 1.1GB/s Write Bandwidth (64kB)
- 185,000 Read IOPS (512-byte)
- 278,000 Write IOPS (512-byte)
- Access Latency 0.03ms (512-byte)
- 640GB ioDrive Duo MLC
- PCI-Express 2.0 x8
- OS Compatibility
- Microsoft: Windows 64-Bit Microsoft XP/Vista/Win7/Server 2003/2008/2008 R2
- Linux: RHEL 5/6; SLES 10/11; OEL 5/6; CentOS 5/6; Debian Squeeze; Fedora 15/16;openSUSE 12; Ubuntu 10/11
- UNIX: Solaris 10 U8/U9/U10 x64; OpenSolaris 2009.06 x64; OSX 10.6/10.7, HP-UX* 11i
- Hypervisors: VMware ESX 4.0/4.1/ESXi 4.1/5.0,Windows 2008 R2 with Hyper-V, Hyper-V Server 2008 R2
- Operating Temperature: 0-55C
- Five Year Warranty or Maximum Endurance Used
- VSL Version Reviewed: 3.1.1
Design and Build
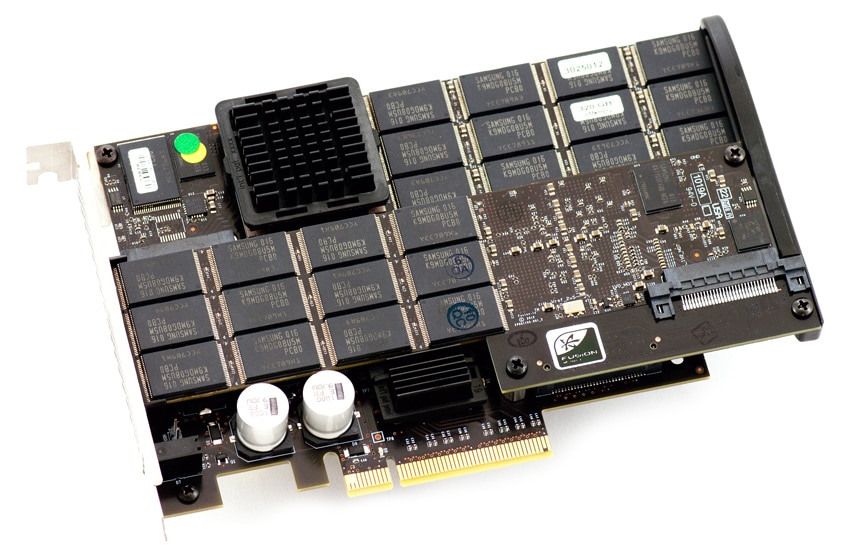
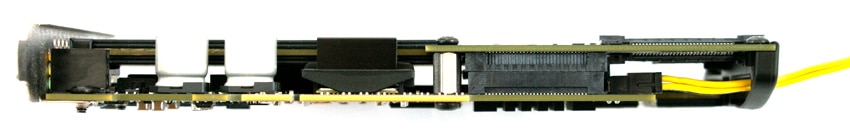
The Fusion ioDrive Duo is a Full-Height Half-Length x8 PCI-Express card, with two individual ioDimms connected to the main interface board. While the PCI-Express card is mechanically an x8 device, on Gen1 platforms it uses 8-lanes for bandwidth, while on PCIe Gen2 systems it only needs 4-lanes. Each card represents a unique 320GB ioMemory device, using 4 lanes of the PCIe connection. The design is very compact and clean, including a sturdy support bracket on the back portion of the card. This helps strengthen the card to keep it functioning in harsh operating conditions and gives it a nice finished appearance.
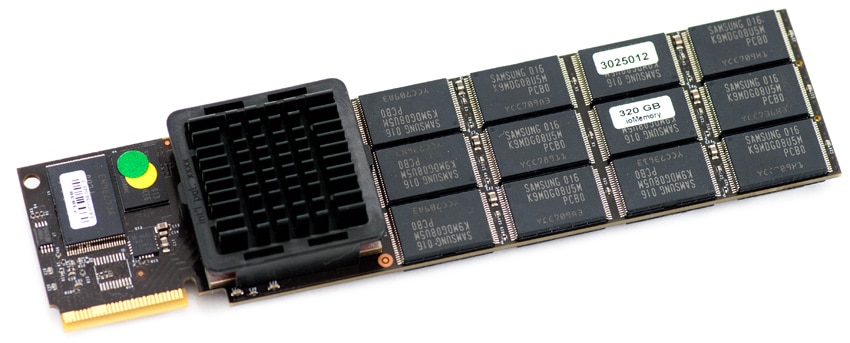
The heart (or hearts) of the MLC-based ioDrive Duo are the two ioDimms. Each identical ioDimm represents one ioDrive, with its own Xilinx Virtex-5 FPGA and 400GB pool of MLC NAND. The ioDrive Duo we reviewed used Samsung NAND, but Fusion-io is manufacturer agnostic. The NAND is split up between 25 double-stacked 16GB chips per device, with 320GB usable with the stock formatting. That ratio puts the stock over-provisioning levels to 20%, roughly on par with most enterprise flash devices. Fusion-io also offers the ability to modify the over-provisioning levels to allow for customization and increased performance by trading user-capacity for background activities.
From a functionality standpoint, the ioDrives all include indication LEDs that show the status of the drive from power up to power down. Depending on the LEDs that are active, it will display the following modes of the card:
- Power Off
- Power On (Driver not loaded, device not attached)
- Power On (Driver loaded, device not attached)
- Active Write Activity
- Active Read Activity
- Location Beacon
For a more traditional approach, the ioDrive Duo also includes a standard HDD Activity LED hookup. This connection allows a connection to a computer case’s front-mount HDD activity light to the ioDrive Duo.
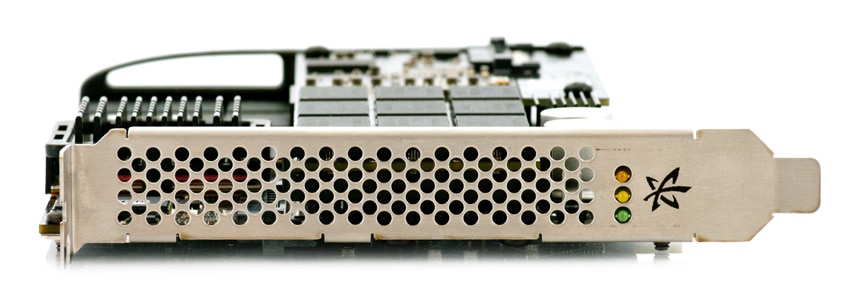
The ioDrive Duo is passively cooled, incorporating three heat sinks; designed to work in a forced-cooling server environment. These heat sinks cool one Xilinx Virtex-5 FPGA on each ioDimm as well as a PCIe-switch that interfaces both devices with the single PCIe slot. Fusion-io lists a recommended airflow of 300LFM, with an ambient temperature below 55C. To prevent damage, the ioDrive is designed to throttle performance if it reaches an internal temp of 78C and power off at 85C. It should be noted that these cards are not designed for a workstation environment, as workstations typically don’t offer cooling support for PCIe add-ons in stock configurations. To address those markets, Fusion-io recently announced the ioFX, which is basically a single ioDimm with active cooling.
Another difference between Fusion “Duo” ioMemory devices and many of the competing PCIe solutions, is that they require more power than what is generally supported from an x8 PCIe 2.0 connection to maintain full performance. PCIe 2.0 electrical spec allows for 25w to be drawn from an x8 connection, which under heavy write conditions, twin-ioDimm models such as the ioDrive Duo can exceed. While they will conform to spec without supplying additional power, full write performance will be limited. To solve this problem Fusion-io offers two solutions; one is requiring an external power adapter, the other is allowing the card to draw more than 25 watts in systems that support it. To decide which option makes the most sense for an installation, Fusion-io has a server configuration guide for most tier one servers that provides best case setup instructions.
To protect user’s data, Fusion-io offers two key features. First, Fusion-io products include power cut features that ensure data integrity during unexpected power outages. For more uncommon failures like a NAND die failing, an advantage of the NAND architecture on first-generation Fusion-io devices is their Flashback redundancy, allowing for a single NAND failure without taking down the entire device. Second-generation models offer Adaptive Flashback, supporting multiple NAND failures.
Software
Fusion-io leads the way when it comes to offering a wide portfolio of well-polished intuitive software, which few storage vendors come close to matching if they provide any software at all. Out of the box, Fusion-io offers utilities to fully manage the ioMemory devices in all major operating systems through both GUIs and console applications. Management features span everything from including ways to easily manage over-provisioning to gain performance by trading user capacity, to monitoring drive stats, to even live streaming data on what the card is doing on a second by second basis. No other PCIe storage manufacturer comes close to offering this level of drive management support, let alone with this level of intuitive ease of use.
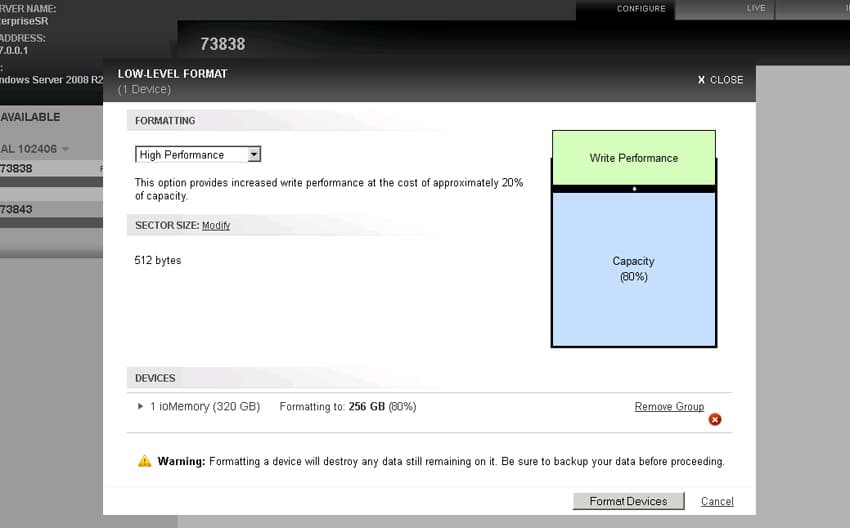
ioSphere Low-Level Format (Over-Provisioning into High-Performance Mode)
One of the most interesting capabilities of the ioSphere software is the ability to see the type of activity hitting the ioMemory device. This information ranges from bandwidth and I/O activity to current device temperature, remaining device endurance, or even the system resources used by the VSL drivers.
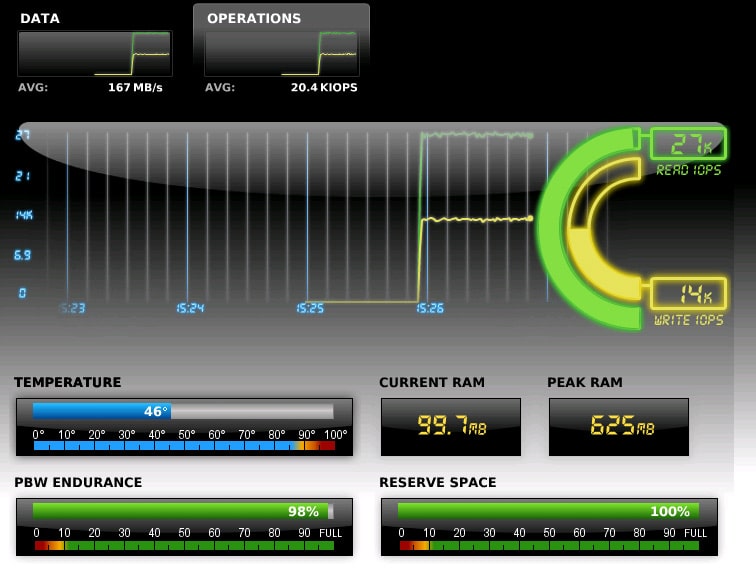
ioSphere Live Performance Streaming
To see more detailed information, there is also a page that offers the full printout of specs of the currently selected ioMemory device. This can be anything from the total amount of information transmitted to or from the device to what the current power draw is through the PCIe bus.
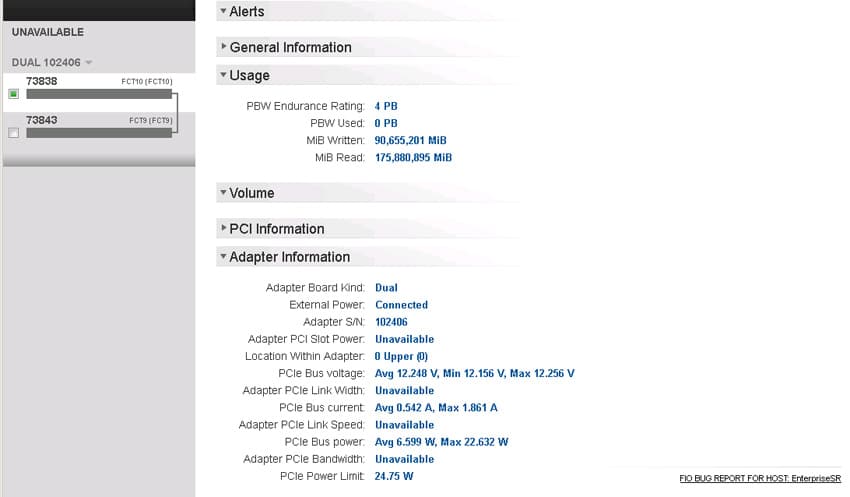
ioShpere Lifetime Usage Information
No matter if you prefer a GUI or a console interface to get your information or setup your ioDrive Duo, Fusion-io also offers a full line of console-based utilities to handle everything from polling drive status to formatting the drive. All of these utilities are set up to work in multiple operating systems, so no matter which platform is in use; you don’t need to load a spare OS to manage a Fusion-io product.
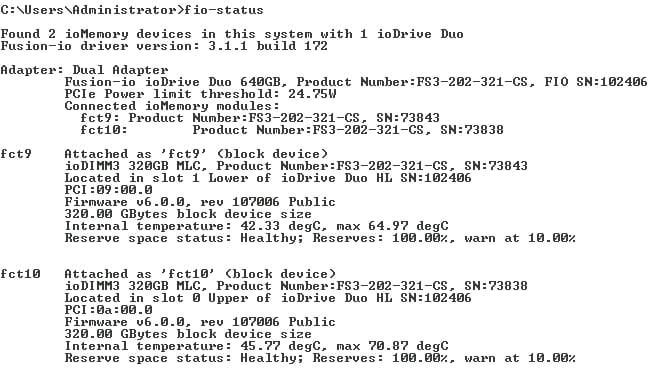
Fusion-io Command Line Status (basic)
Testing Background and Comparables
When it comes to testing enterprise hardware, the environment is just as important as the testing processes used to evaluate it. At StorageReview we offer the same hardware and infrastructure found in many data centers where the devices we test would ultimately be destined for. This includes enterprise servers as well as proper infrastructure equipment like networking, rack space, power conditioning/monitoring, and same-class comparable hardware to properly evaluate how a device performs. None of our reviews are paid for or controlled by the manufacturer of the equipment we are testing; with relevant comparables picked at our discretion from products we have in our lab.
StorageReview Enterprise Testing Platform:
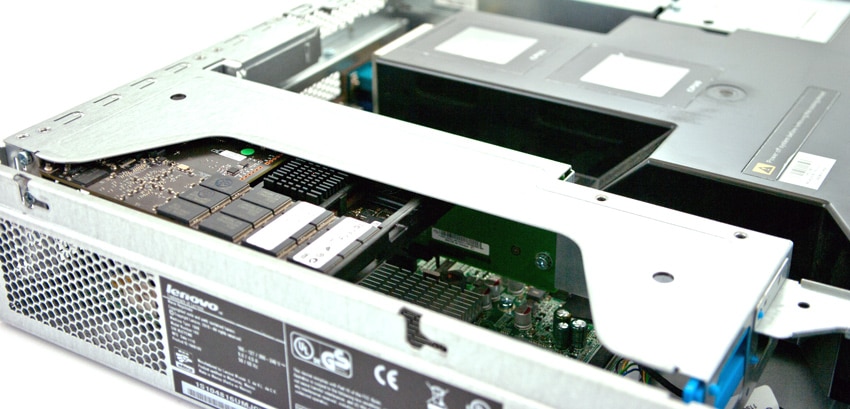
Lenovo ThinkServer RD240
- 2 x Intel Xeon X5650 (2.66GHz, 12MB Cache)
- Windows Server 2008 Standard Edition R2 SP1 64-Bit and CentOS 6.2 64-Bit
- Intel 5500+ ICH10R Chipset
- Memory – 8GB (2 x 4GB) 1333Mhz DDR3 Registered RDIMMs
640GB Fusion-io ioDrive Duo
- Released: 1H2009
- NAND Type: MLC
- Controller: 2 x Proprietary
- Device Visibility: JBOD, software RAID depending on OS
- Fusion-io VSL Windows: 3.1.1
- Fusion-io VSL Linux 3.1.1
300GB LSI WarpDrive SLP-300
- Released: 1H2010
- NAND Type: SLC
- Controller: 6 x LSI SandForce SF-1500 through LSI SAS2008 PCIe to SAS Bridge
- Device Visibility: Fixed Hardware RAID0
- LSI Windows: 2.10.43.00
- LSI Linus: Native CentOS 6.2 driver
1.6TB OCZ Z-Drive R4
- Released: 2H2011
- NAND Type: MLC
- Controller: 8 x LSI SandForce SF-2200 through custom OCZ VCA PCIe to SAS Bridge
- Device Visibility: Fixed Hardware RAID0
- OCZ Windows Driver: 1.3.6.17083
- OCZ Linux Driver: 1.0.0.1480
Standard Synthetic Benchmarks
We split the standard synthetic IOMeter testing portion of this review into two parts. The first is our standard low queue-depth tests, which are performed at a queue depth of 4 per worker (4 workers total spread out over two managers). The initial tests are more in line with single-user environments, whereas higher queue depth ranges in the second half are more like what the card would see in a server with I/O requests stacked up.
Our first test looks at straight-line sequential read and write speeds in a sustained burst condition. Fusion-io lists a 1.5GB/s read speed and 1.0GB/s write speed on the 640GB MLC-based ioDrive Duo.
We measured sequential transfer performance of 1,584MB/s read and 1,045MB/s write.
Next we look at large-block random transfers, with a 2MB transfer in IOMeter.
With a 2MB random transfer, the ioDrive Duo maintained a read speed of 1,589MB/s and a write speed of 1046MB/s.
Our next test looks at low-queue depth random 4K transfer speeds with four total workers with a queue depth of 1 each.
At a low queue depth the Fusion ioDrive Duo offered the highest performance, with speeds measuring 189MB/s read and 366MB/s write, or 48,403 IOPS read and 93,740 IOPS write.
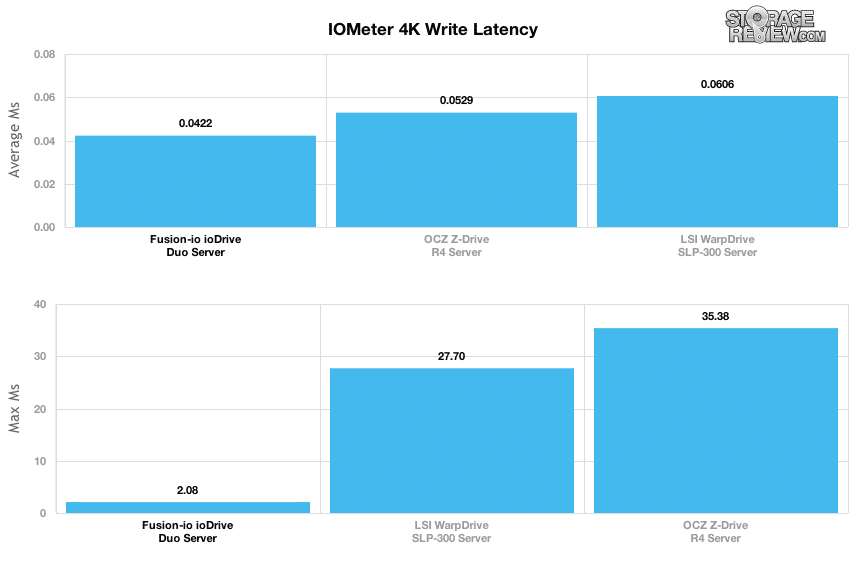
With performance and latency going hand in hand, we looked at average and peak latency during our low queue depth 4K random transfer test. The Fusion ioDrive Duo measured a 0.0422ms average response time with a peak response of 2.08ms.
The next half of our synthetic benchmarks are ramped tests, covering performance from early queue depth levels to either a max of 64 per worker (effective QD=256) or 128 (effective QD=512). This section also includes our server profile tests, which from the start are designed to show how well enterprise products perform under demanding mixed server loads.
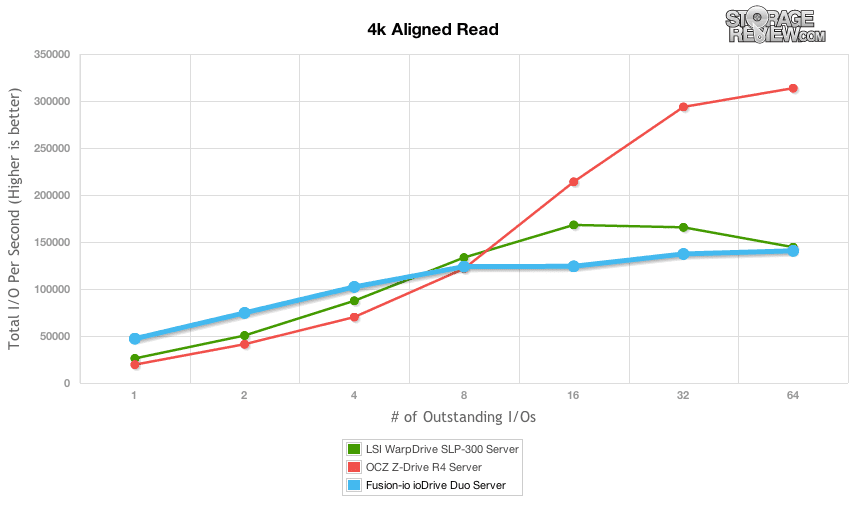
Looking at the random 4K read performance of the ioDrive Duo, it maintained nearly twice the speed of both the LSI WarpDrive and OCZ Z-Drive R4 at a queue depth of 1 and 2, with the lead slipping at a queue depth of 4 before it was overshot by both competing models. In this test performance topped at 140,000 IOPS read at a queue depth of 64, although it maintained speeds above 120,000 IOPS from a queue depth of 8 and above.
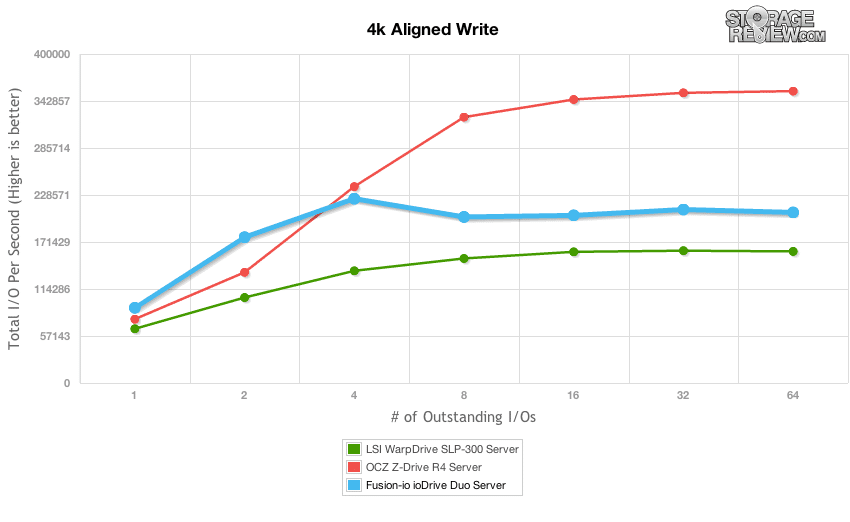
Switching to a ramped 4K random write test, the ioDrive Duo showed a similar performance profile, beating the other competing models at lower queue depths. In this test performance of the ioDrive Duo peaked with a speed of 224,000 IOPS write at a queue depth of 4, leveling off between 201,000 to 210,000 IOPS between a queue depth of 8 to 64.
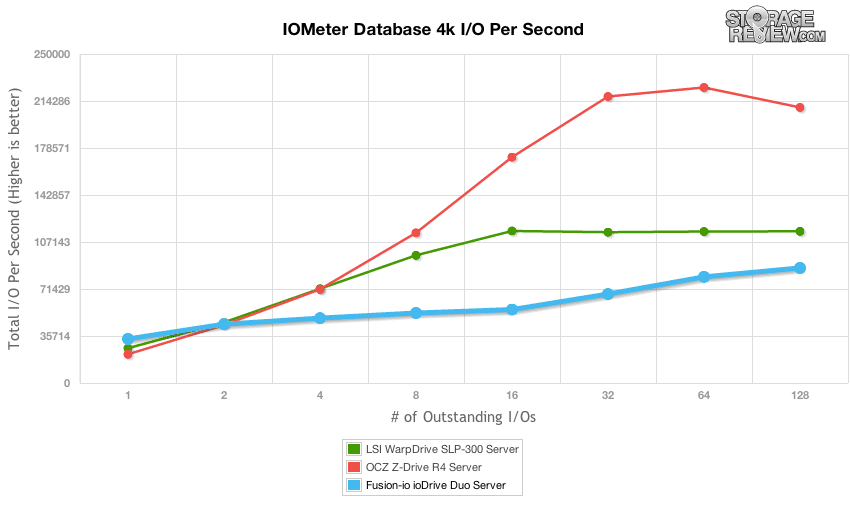
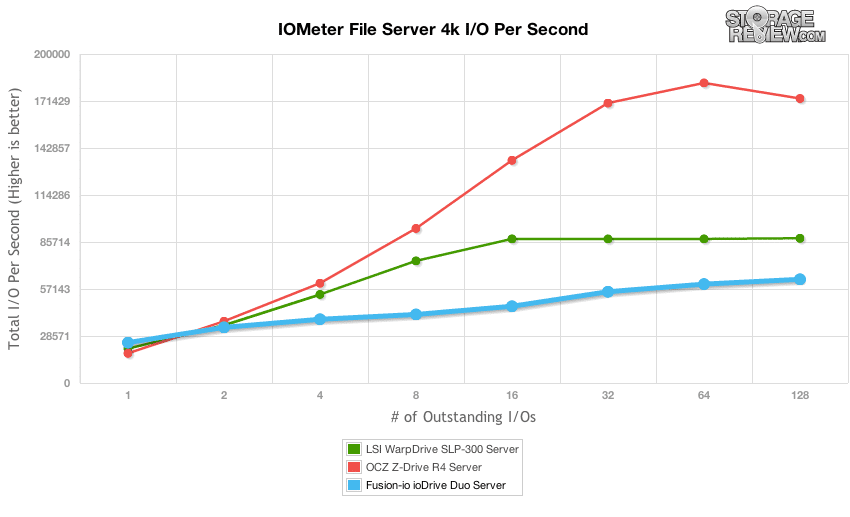
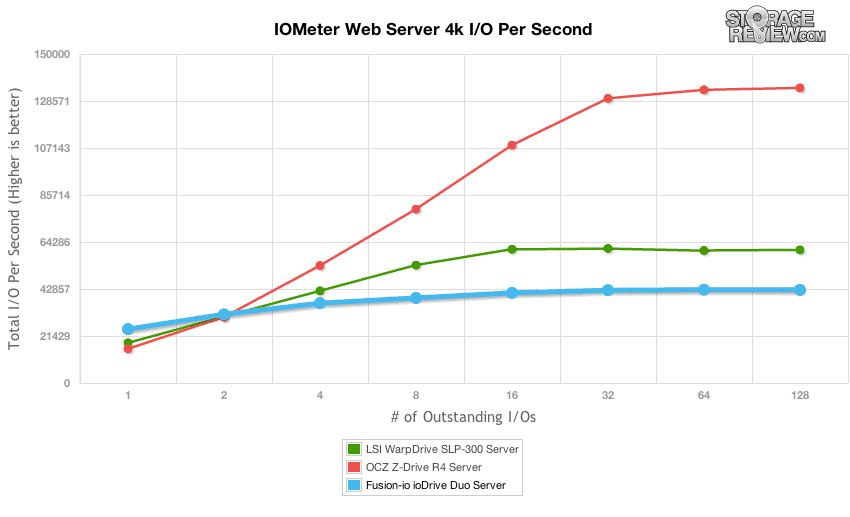
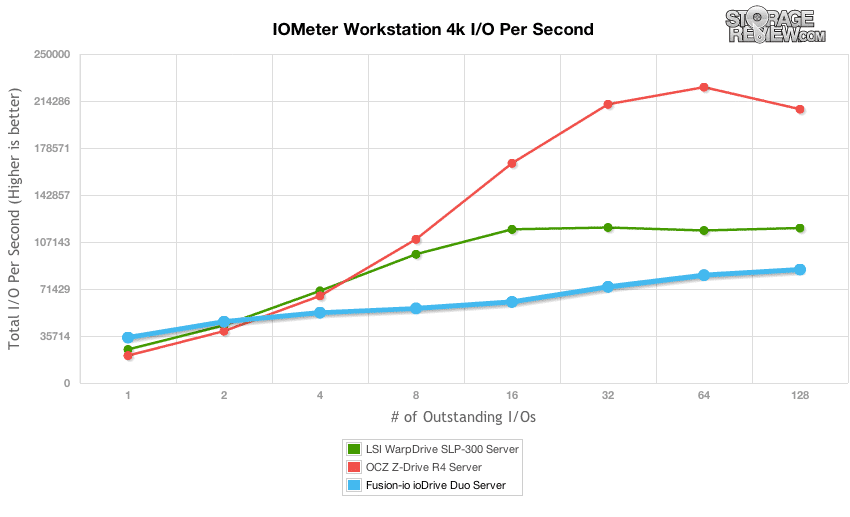
Our last group of standard synthetic benchmarks looks at scaled performance using our server profiles in IOMeter. These tests measure performance from a low queue depth to a max of 128 per worker (effective QD=512). This section is designed to show how well enterprise products perform under different demanding mixed workloads in burst conditions. In our enterprise-focused mixed workloads, the ioDrive Duo lead the pack at a queue depth of 1 and 2, with the exception of the File Server test, and then trailed behind the other drives at the highest queue depths.
Enterprise Real-World Benchmarks
Our enterprise trace covers a Microsoft Exchange mail-server environment. We captured the activity of our StorageReview mail server over a period of days. This server hardware consists of a Dell PowerEdge 2970 running Windows Server 2003 R2 environment operating off of three 73GB 10k SAS hard drives in RAID5 on the Dell Perc 5/I integrated controller. The trace consists of many small transfer requests, with a strong 95% read load with 5% write traffic.
Since some PCIe devices require higher loads to reach maximum performance, we include both a Light and Heavy profile for trace playback. In this we limit effective queue depth to 8 in the weaker profile and increase it to 48 in the Heavy profile.

With an effective queue depth restricted to 8, representing lighter activity conditions, the ioDrive Duo offered the highest transfer speeds in our Mail Server trace playback test with a speed of 969MB/s average. This compared to 508MB/s average from the LSI WarpDrive or 625MB/s from the OCZ Z-Drive R4 under the same conditions. Expanding the allowed queue depth to 48, the Z-Drive R4 took the top spot with an average speed of 1,327MB/s average, with the ioDrive Duo coming in next with a speed of 1,227MB/s and the WarpDrive SLP-300 trailing with a speed of 830MB/s.
One trade-off of increasing queue depth to increase transfer rates is it can affect response times as the outstanding I/Os increase. With a light load, the ioDrive Duo maintained its transfer speed of 969MB/s with a response time of 0.06ms. For the Z-Drive R4 to surpass it with a transfer speed of 1,327MB/s, its response time increased 3.5 times to 0.21ms while the WarpDrive had a 0.45ms average response for a transfer rate of 830MB/s.
Enterprise Synthetic Workload Analysis (Stock Settings)
The way we look at PCIe storage solutions dives deeper than just looking at traditional burst or steady-state performance. When looking at averaged performance over a long period of time, you lose sight of the details behind how the device performs over that entire period. Since flash performance varies greatly as time goes on, our new benchmarking process analyzes the performance in areas including total throughput, average latency, peak latency, and standard deviation over the entire preconditioning phase of each device. With high-end enterprise products, latency is often more important than throughput. For this reason we go to great lengths to show the full performance characteristics of each device we put through our Enterprise Test Lab.
We have also added performance comparisons to show how each device performs under a different driver set across both Windows and Linux operating systems. For Windows, we use the latest drivers at the time of original review, which each device is then tested under a 64-bit Windows Server 2008 R2 environment. For Linux, we use 64-bit CentOS 6.2 environment, which each Enterprise PCIe Application Accelerator supports. Our main goal with this testing is to show how OS performance differs, since having an operating system listed as compatible on a product sheet doesn’t always mean the performance across them is equal.
All devices tested go under the same testing policy from start to finish. Currently, for each individual workload, devices are secure erased using the tools supplied by the vendor, preconditioned into steady-state with the identical workload the device will be tested with under heavy load of 16 threads with an outstanding queue of 16 per thread, and then tested in set intervals in multiple thread/queue depth profiles to show performance under light and heavy usage. For tests with 100% read activity, preconditioning is with the same workload, although flipped to 100% write.
Preconditioning and Primary Steady-State Tests:
- Throughput (Read+Write IOPS Aggregate)
- Average Latency (Read+Write Latency Averaged Together)
- Max Latency (Peak Read or Write Latency)
- Latency Standard Deviation (Read+Write Standard Deviation Averaged Together)
At this time Enterprise Synthetic Workload Analysis includes four common profiles, which can attempt to reflect real-world activity. These were picked to have some similarity with our past benchmarks, as well as a common ground for comparing against widely published values such as max 4K read and write speed, as well as 8K 70/30 commonly used for enterprise drives. We also included two legacy mixed workloads, including the traditional File Server and Webserver offering a wide mix of transfer sizes. These last two will be phased out with application benchmarks in those categories as those are introduced on our site, and replaced with new synthetic workloads.
- 4K
- 100% Read or 100% Write
- 100% 4K
- 8K 70/30
- 70% Read, 30% Write
- 100% 8K
- File Server
- 80% Read, 20% Write
- 10% 512b, 5% 1k, 5% 2k, 60% 4k, 2% 8k, 4% 16k, 4% 32k, 10% 64k
- Webserver
- 100% Read
- 22% 512b, 15% 1k, 8% 2k, 23% 4k, 15% 8k, 2% 16k, 6% 32k, 7% 64k, 1% 128k, 1% 512k
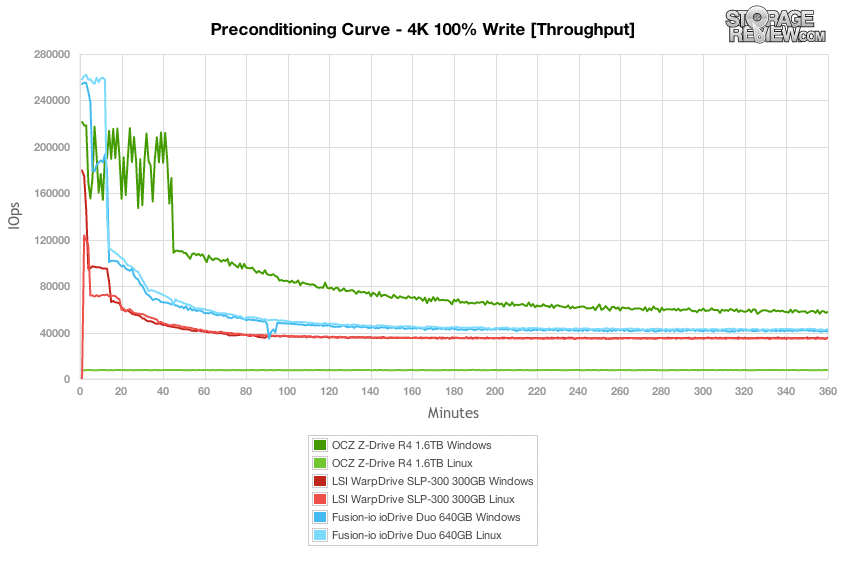
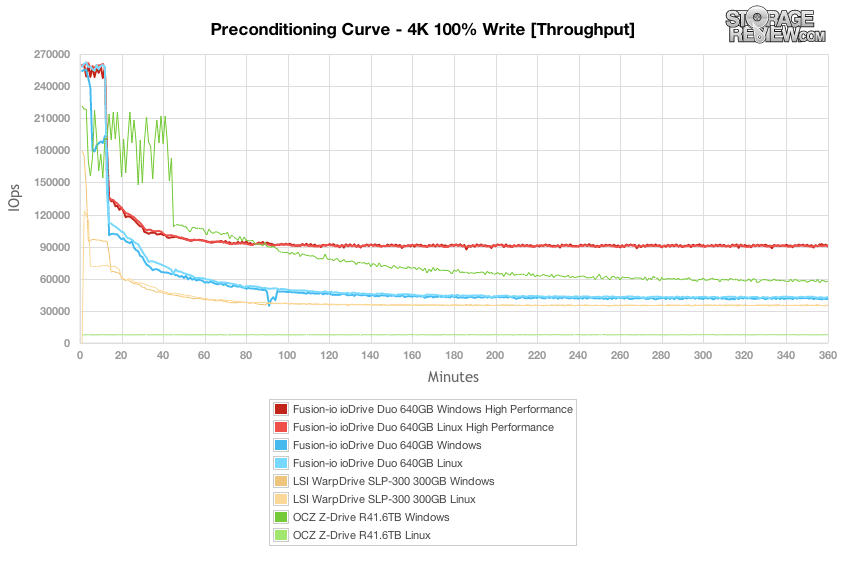
Looking at 100% 4K write activity under a heavy load of 16 threads and 16 queue over a 6 hour period, we found that the Fusion ioDrive Duo offered the highest peak transfer speeds in our Lenovo ThinkServer RD240. This held true for both Windows Server 2008 R2 64-bit as well as CentOS 6.2, which happened to have a small lead over the Windows performance. Next in line was the 1.6TB OCZ Z-Drive R4, although only in Windows. The OCZ driver for CentOS 6.2 [1.0.0.1480] wouldn’t respond properly to higher queue depth requests, regardless of the number of threads, and maintained a speed of roughly 7,600 IOPS throughout this stage of the test. Next in line was the LSI WarpDrive SLP-300, which offered very similar throughput in both Windows and Linux.
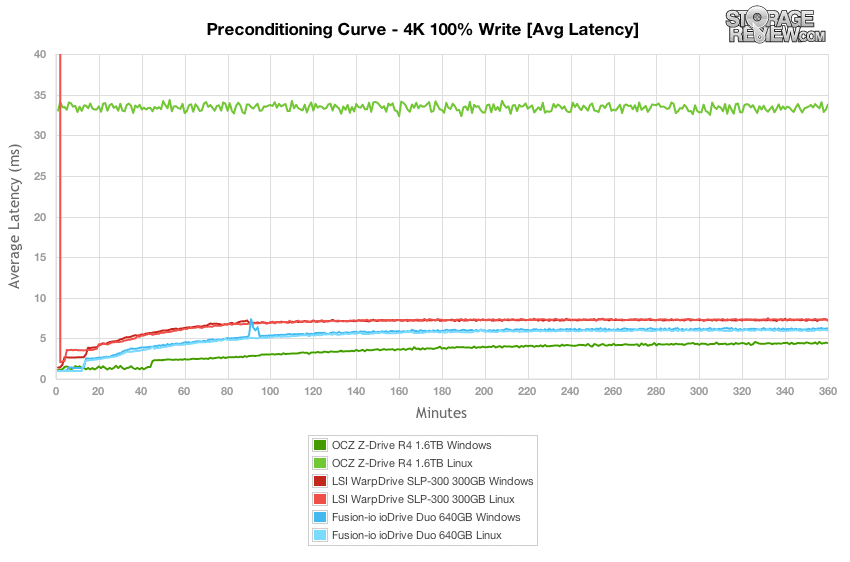
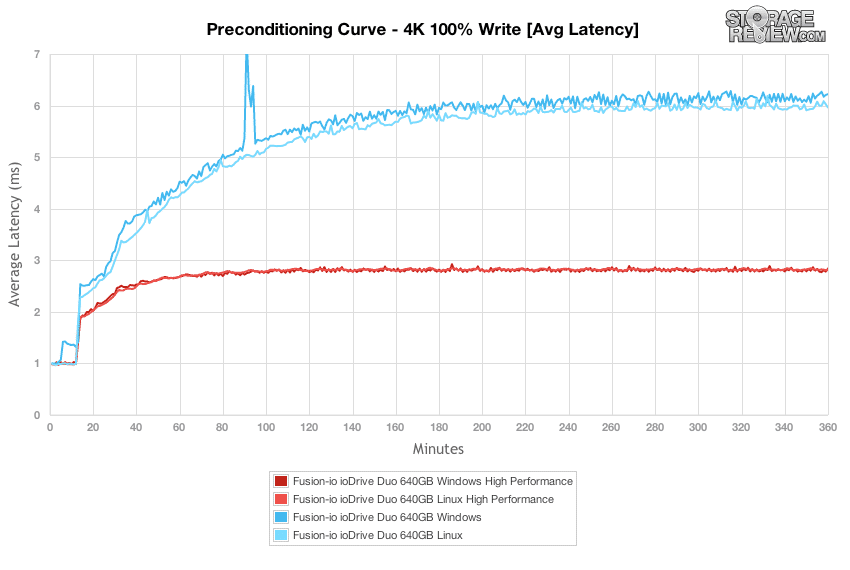
Looking at average latency over the duration of our 4K 100% write preconditioning test, the fastest and slowest drive was the OCZ Z-Drive R4. In a Windows environment, with the driver completely functional, average latency was much quicker than the Fusion ioDrive Duo or LSI WarpDrive. In a Linux environment with its rather lackluster performance, it was exponentially higher than the other devices in this category.
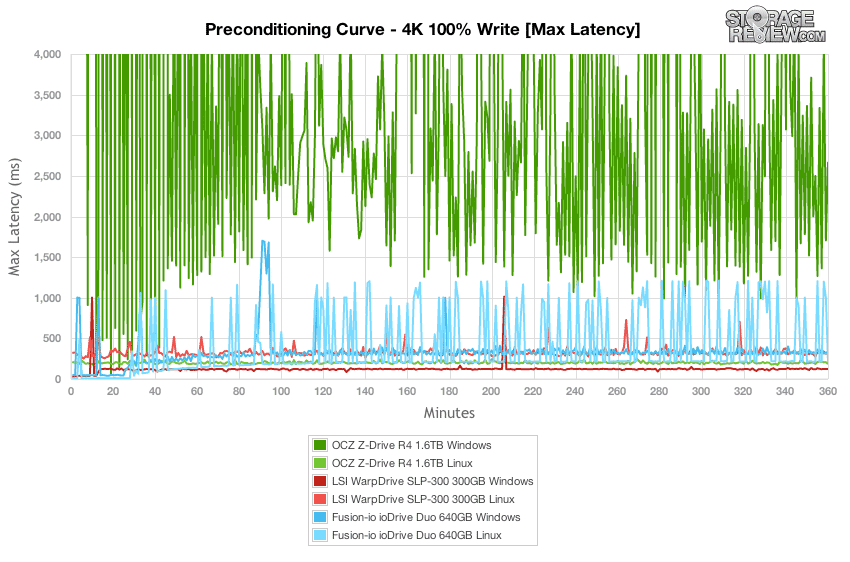
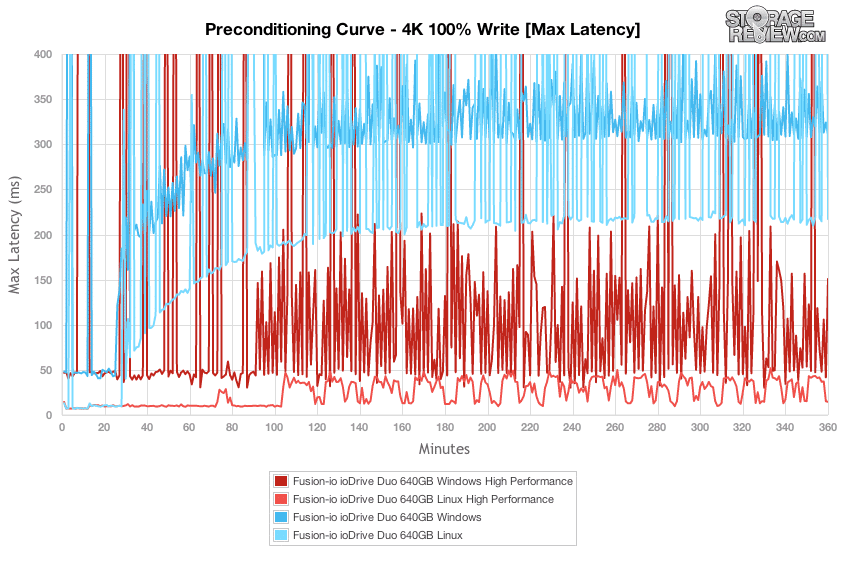
Drilling into the max latency output per interval during the 4K 100% write preconditioning test, you can start to see how big of an impact controller and NAND come into play with a heavy-write environment. The Fusion ioDrive Duo with MLC NAND came in between the SLC-based LSI WarpDrive and the MLC-based OCZ Z-Drive R4 in terms of peak latency spikes. Comparing the performance in both Windows and Linux, we saw more consistent output in the Windows environment over Linux, with many fewer spikes, although not smaller spikes. The MLC-based Z-Drive R4 in Windows had large spikes that landed well above our chart scale, with Linux performance being quite steady, although far from heavily-tasked at the low IOPS performance. The LSI WarpDrive offered its best performance in Windows, with a much flatter latency curve, although it still saw one spike in excess of 1,000ms.
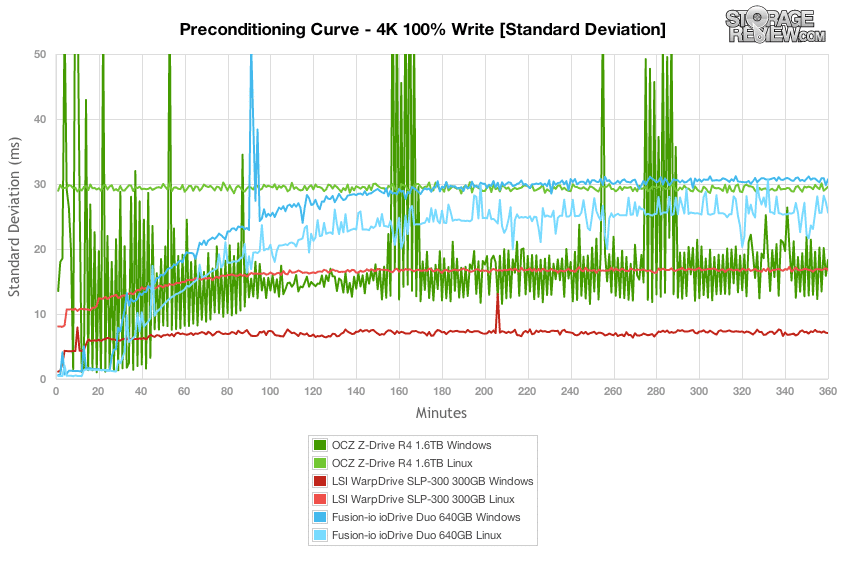
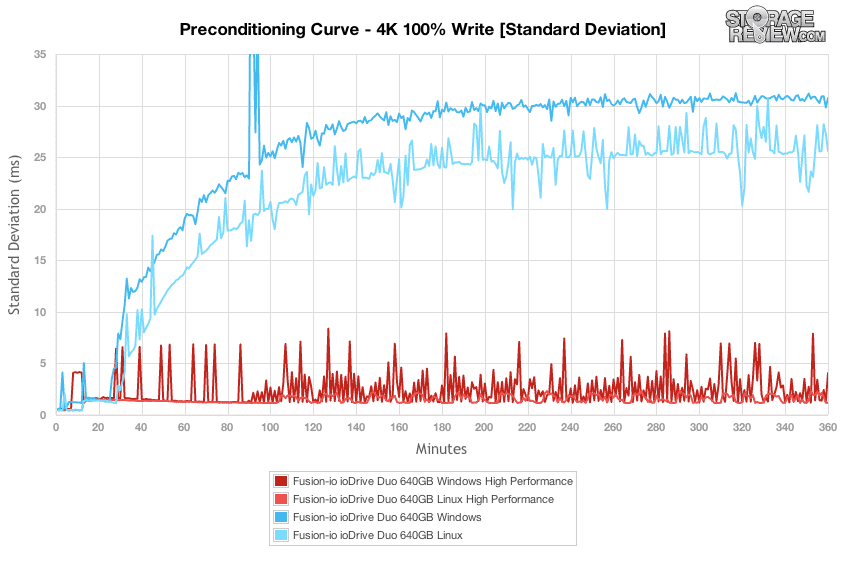
When considering the max latency performance of a particular storage product, the area that frequently gets glossed over is just how many of the thousands or millions of I/Os had a high response value. This is why its important to monitor not only peak latency to see the highest peaks, but also to look at standard deviation, which shows the variation in latency. Even if a drive has a rather low average latency with all values averaged out, it might still have a fairly large quantity of I/Os that might be considered unacceptable depending on the application you are using.
With the SLC NAND configuration, the LSI WarpDrive maintained a very good latency standard deviation, with its strength primarily showing in a Windows environment. The Fusion ioDrive Duo came in toward the upper range of standard deviation, although it was fairly consistent, like the pattern found in the WarpDrive. Comparing its driver performance, it was consistently faster in Linux in this particular test. The OCZ Z-Drive R4 had a wide range of higher latency output over the duration of our test, although it did start to even out at times once it reached steady-state, although still had periods of time with high latency again.
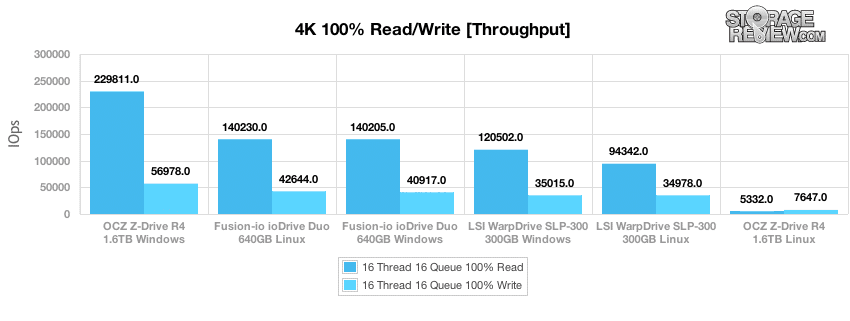
After the preconditioning tests had finished, we started immediately with our primary test sampling. In steady state, the PCIe storage device with the highest throughput in this group was the OCZ Z-Drive R4 in Windows. It measured a peak of 229,811 IOPS read and a write speed of 56,978 IOPS. Next in line was the Fusion ioDrive Duo, measuring 140,230 IOPS read and 42,644 IOPS write. Windows performance of the ioDrive Duo came in just below that, with a small dip in write performance. The LSI WarpDrive SLP-300 offered its strongest 4K write speed in Windows, measuring 120,502 IOPS read and 35,015 IOPS write.
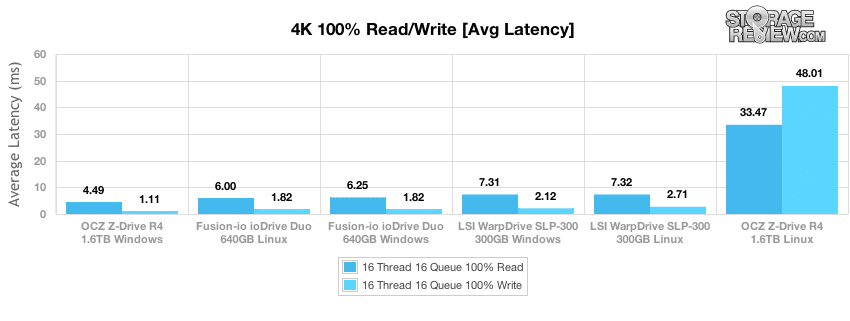
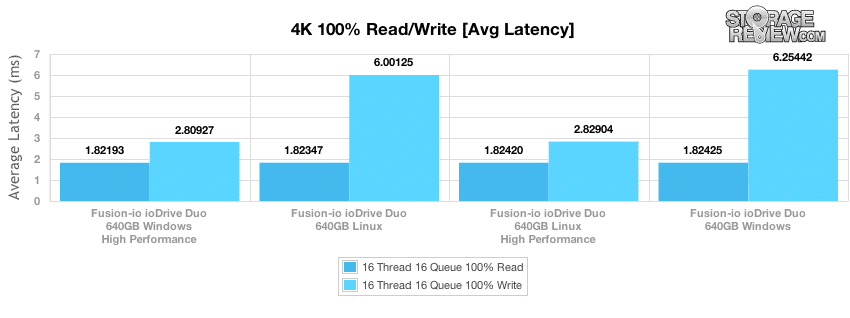
In steady-state measurement of high-load 4K read and 4K write, the OCZ Z-Drive R4 with its class-leading throughput speeds in Windows came in at the front, with an average latency of 4.49ms read and 1.11ms write. The Fusion ioDrive Duo came in next with read speeds measuring 6.00ms in Linux and 6.25ms in Windows, and 1.82ms write in both OSs. Next came in the WarpDrive with a speed of 7.31ms read in Windows and 7.32ms read in Linux, with write speeds of 2.12ms in Windows and 2.71ms in Linux.
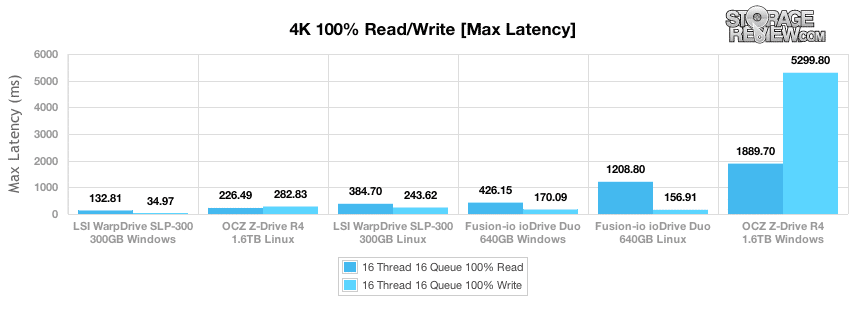
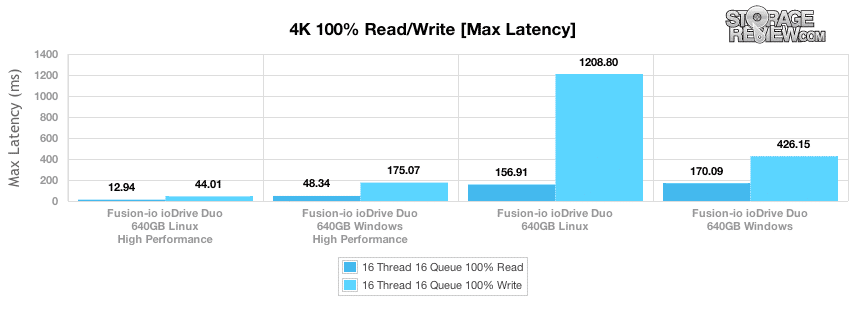
Looking at peak latency over the sampling time of our steady-state test, the SLC-based LSI WarpDrive came in the lowest or best in both Windows and Linux, followed by the Fusion ioDrive Duo in Windows first with 426.15ms peak read and 170.09ms peak write, and then in Linux with 1,208ms peak read and 156.91ms peak write. In Windows the OCZ Z-Drive R4 had the highest peaks, measuring 1,889ms read and 5,299ms write in Windows.
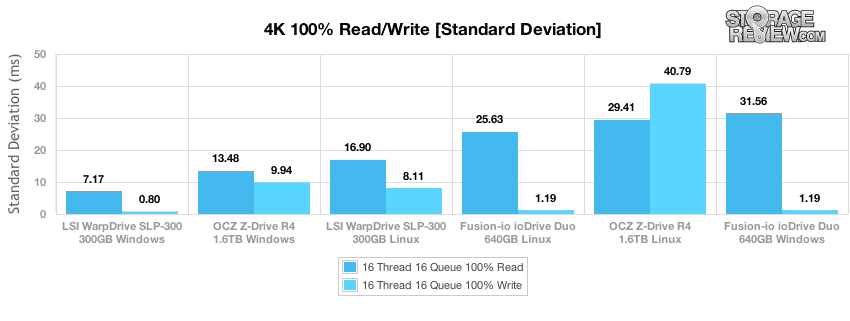
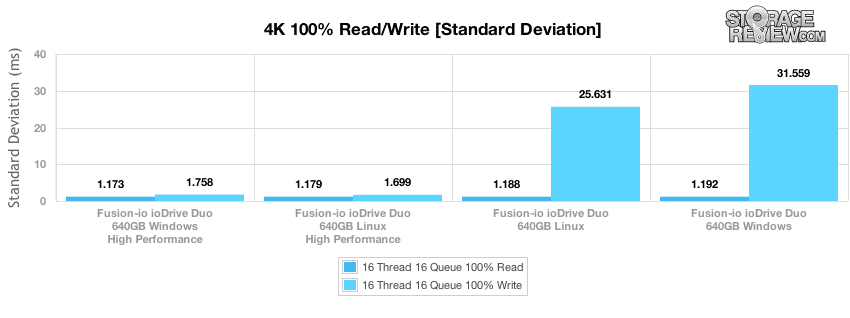
Looking at the standard deviation over the period of our steady-state 4K read and write test, the most consistent PCIe Application Accelerator in our 4K test for both read and write activity is the LSI WarpDrive in Windows. Ranking by consistent 4K write performance, the OCZ Z-Drive R4 in Windows comes in next, followed by the WarpDrive in Linux, followed by the ioDrive Duo in Linux, then the ioDrive Duo in Windows. Ranking by consistently fast read speed, both Windows and Linux performance of the ioDrive Duo came in after the SLC-based WarpDrive, then the WarpDrive in Linux, followed by the Z-Drive R4 in Windows.
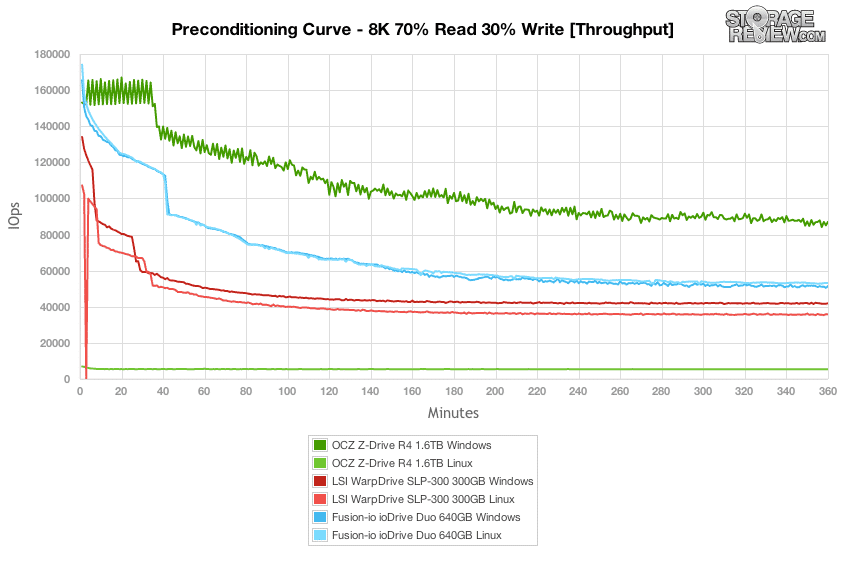
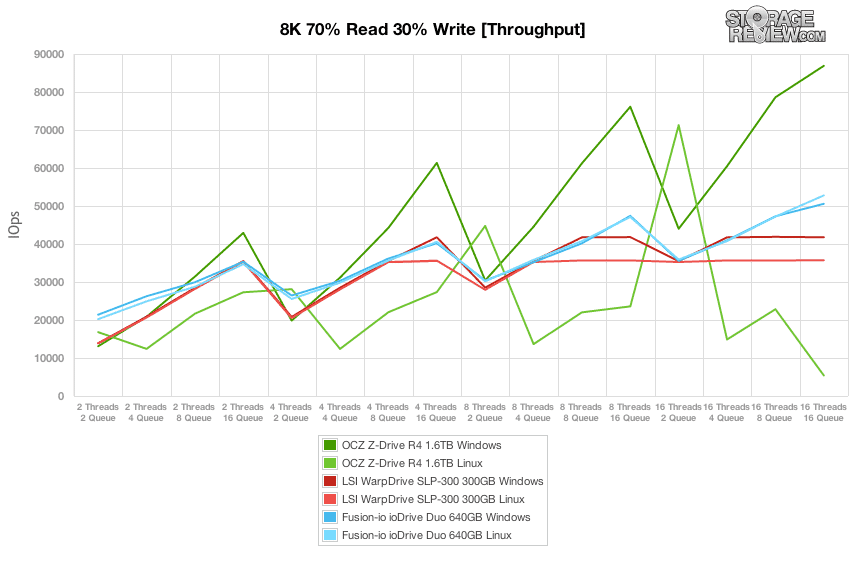
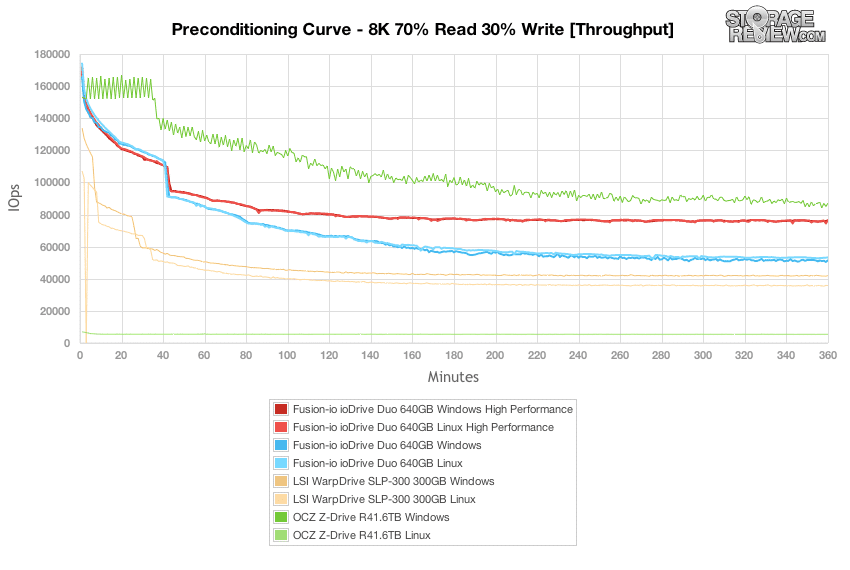
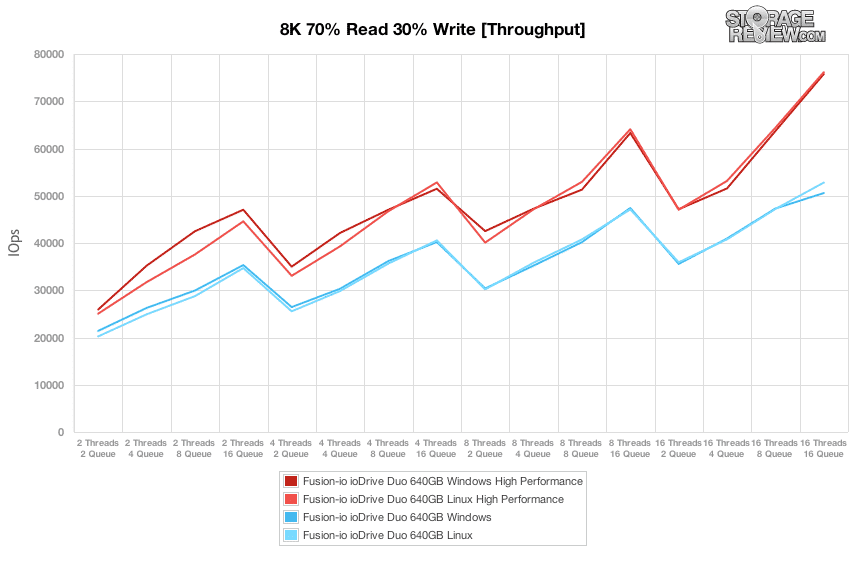
The next preconditioning test works with a more realistic read/write workload spread, versus the 100% write activity in our 4K test. Here, we have a 70% read and 30% write mix of 8K transfers. Looking at our 8K 70/30 mixed workload under a heavy load of 16 threads and 16 queue over a 6 hour period, we found that the Fusion ioDrive Duo still offered the highest peak transfer speeds in our Lenovo ThinkServer. This held true for both Windows Server 2008 R2 64-bit as well as CentOS 6.2 environment, which happened to have a slight lead over the Windows performance. Next in line was the 1.6TB OCZ Z-Drive R4, although only in Windows. Next in line was the LSI WarpDrive SLP-300, which offered higher performance in a Windows environment.
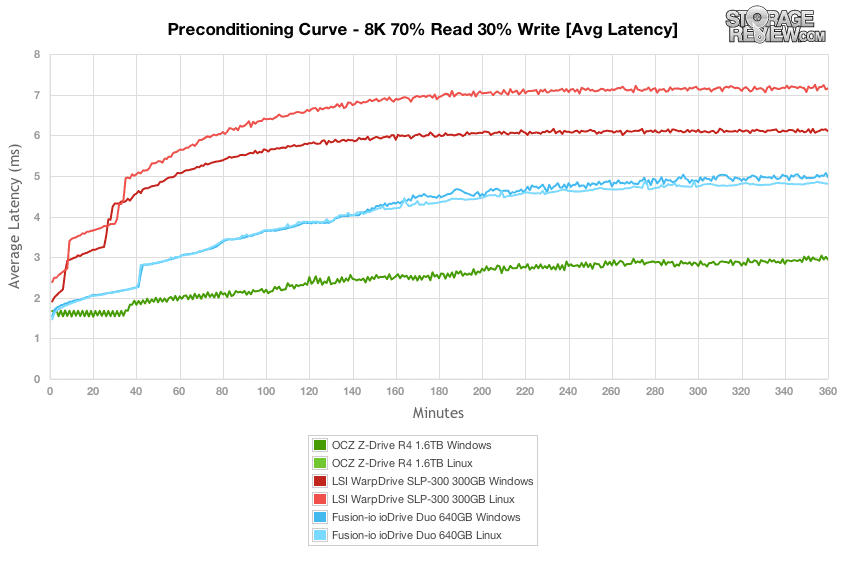
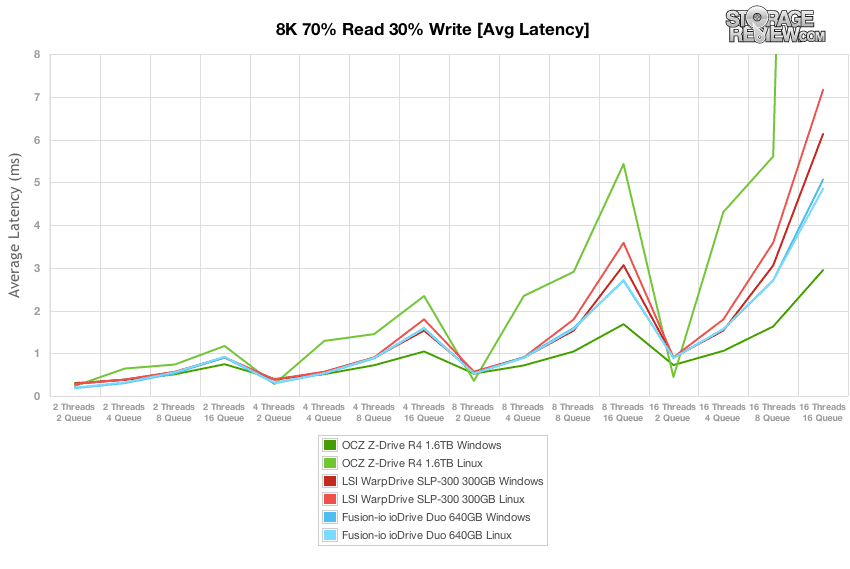
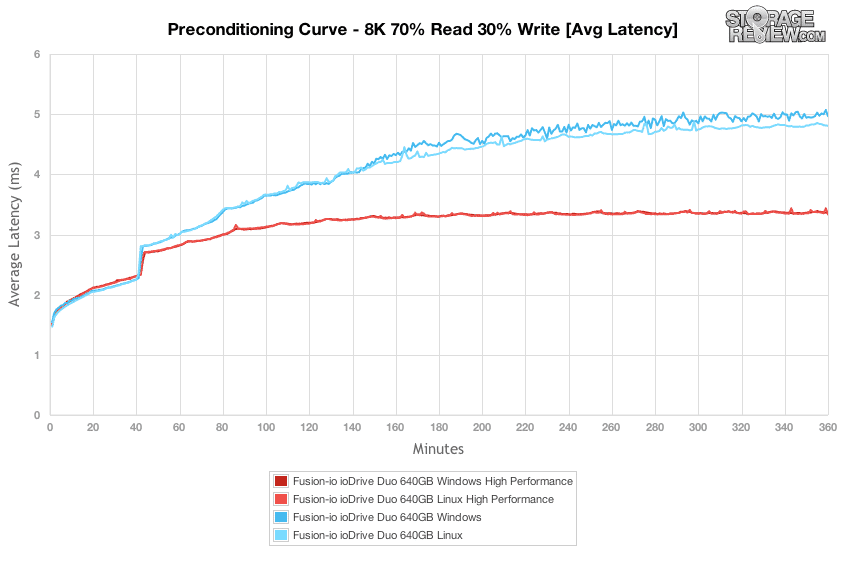
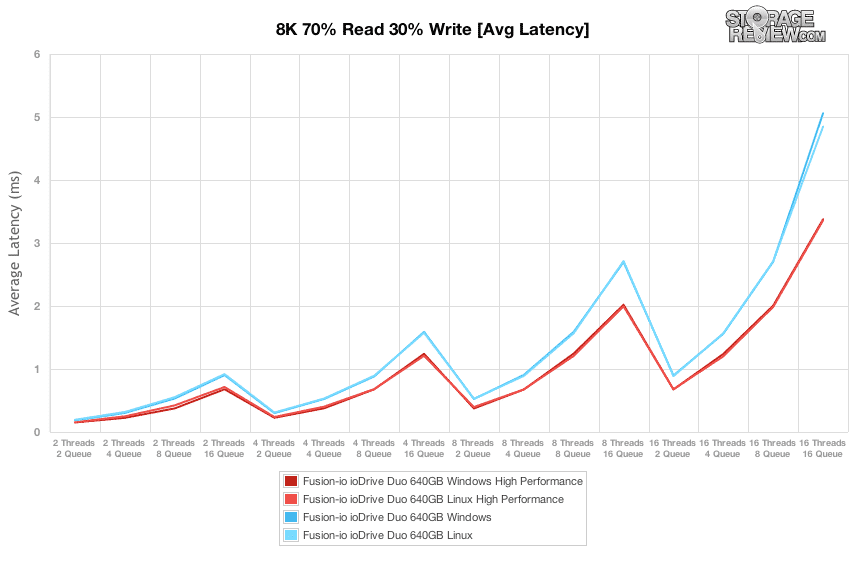
Switching to a look at average latency in our 8K 70/30 test, the difference between the driver sets becomes more pronounced. The Fusion ioDrive Duo had the most similar performance between both Linux and Windows, although the edge of the Linux driverset became more apparent as the drive hit steady-state. The LSI WarpDrive showed a significant spread in average latency between driversets, with the Windows driver offering the highest performance. The OCZ Z-Drive R4 in Windows had the lowest average latency out of the group, which went hand-in-hand with the fastest throughput. The Linux performance though was again off the charts averaging about 46ms in Linux versus 6ms or so in Windows.
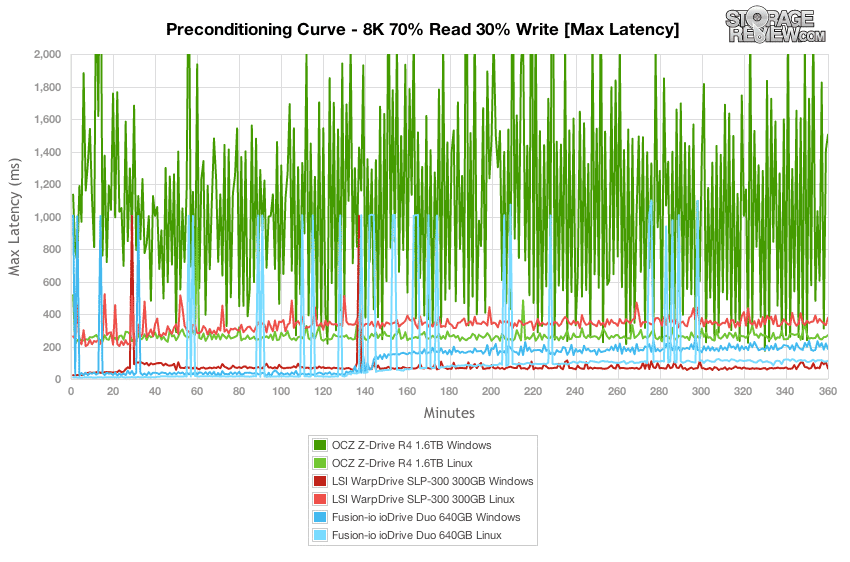
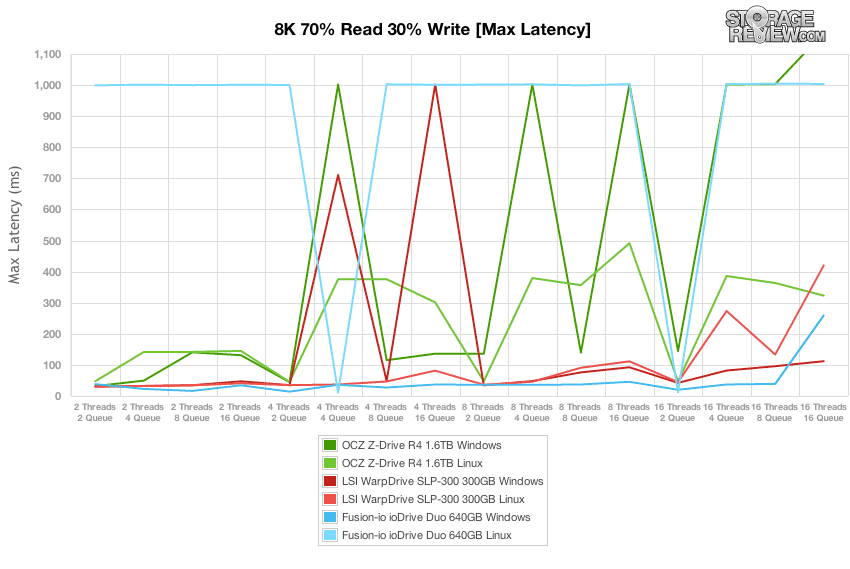
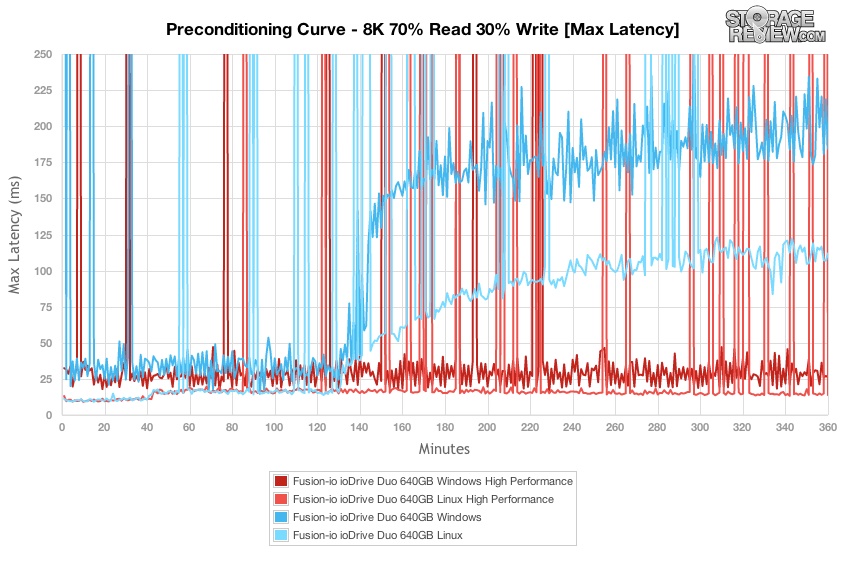
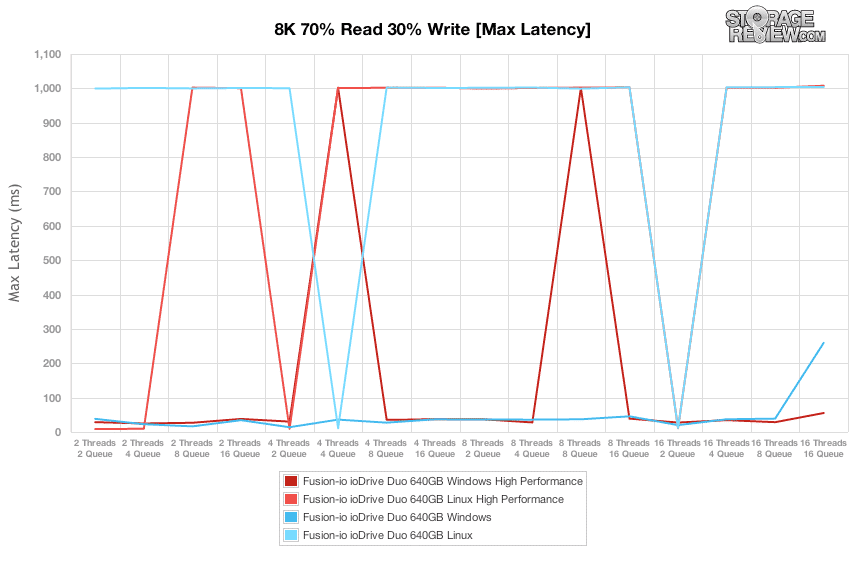
Looking at the peak response times of the ioDrive Duo, WarpDrive, and Z-Drive R4, many of the same traits we saw in our 4K test played out in our 8K 70/30 workload with a included read activity. In this test the Fusion-io ioDrive Duo started off with the lowest peak latency curve, and then started to pick up a bit after two hours in as the drive started to transition to steady state. At that time, it came in above the WarpDrive in Windows, which had the lowest curve out of the drives in this group. Looking at the driver differences between the ioDrive Duo in Windows and Linux, the Linux driver had higher peaks, although toward the latter half of the test it maintained a lower (faster) curve. The Z-Drive R4 on the other hand in Windows had higher peaks, although as a whole calmed down compared to its behavior in a 100% write workload.
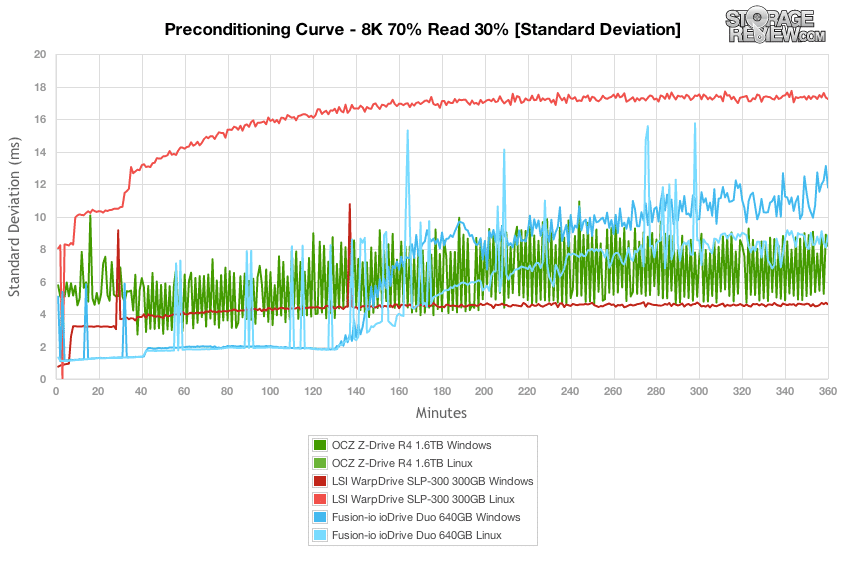
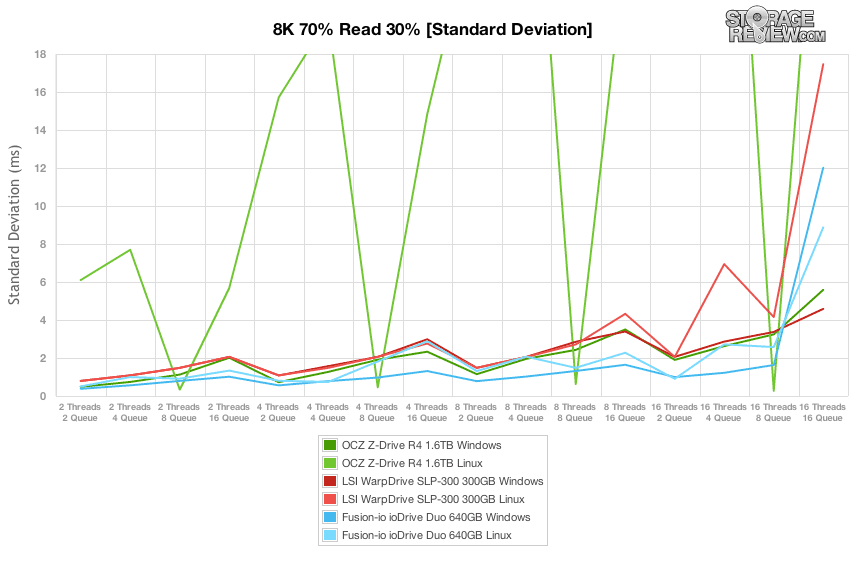
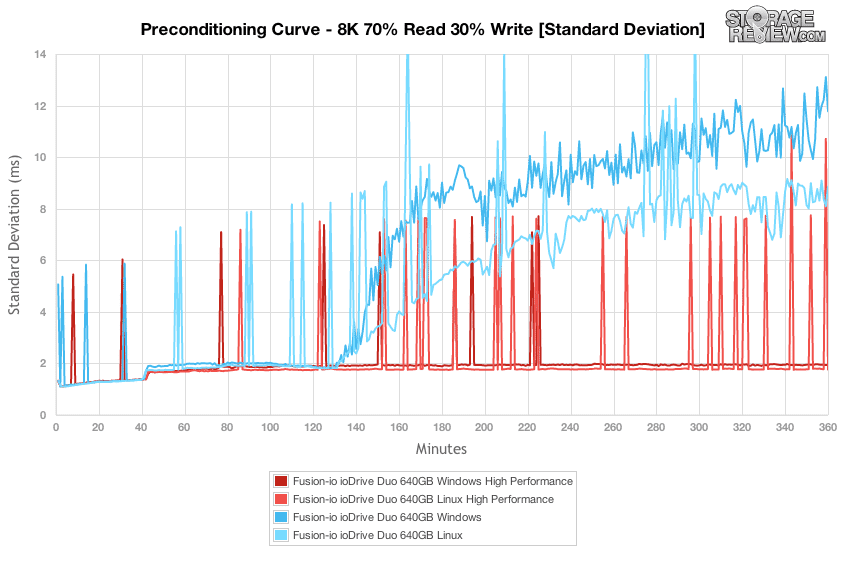
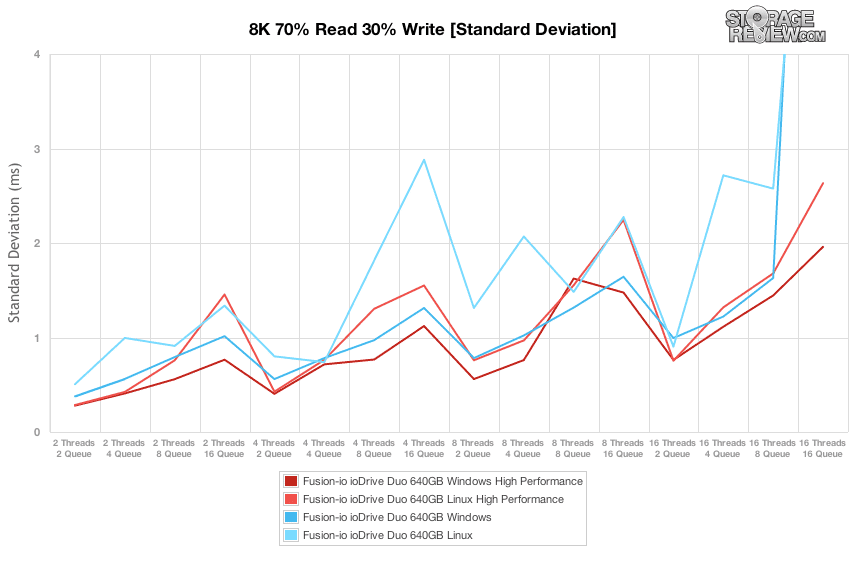
The standard deviation profile in our preconditioning phase of the 8K 70/30 workload showed interesting differences between the cards in how they performed over the duration of tests. While the WarpDrive consistently had the fastest response times in Windows, its latency performance in Linux left a bit to be desired. The ioDrive Duo showed it best face in Linux, while the OCZ Z-Drive R4 produced a much improved latency standard deviation profile in this test versus the 100% write 4K test.
Compared to the fixed 16 thread, 16 queue max workload we performed in the 100% 4K write test, our mixed workload profiles scale the performance across a wide range of thread/queue combinations. In these tests we span our workload intensity from 2 threads and 2 queue up to 16 threads and 16 queue. Off the bat the most bizarre profile is the OCZ Z-Drive R4 comparing its Windows performance to its Linux performance. At the times where it is fastest in Windows it is at its slowest in Linux with a queue depth scaling problem in the driver we tested. At a low thread and queue depth, the ioDrive Duo had a strong lead in performance versus the LSI SandForce-powered WarpDrive and Z-Drive R4. As the queue depth increased though, the other cards were able to match or surpass its performance. Comparing the Windows and Linux driver environments, the ioDrive Duo offered a near parity in performance throughout the entire workload.
Comparing average completion latency across the wide span of varying level of thread and queue activity, the WarpDrive maintained the lowest response times in most cases, until the Z-Drive R4 in Windows surpassed it at higher queue depth loads. The ioDrive Duo offered near identical performance in both Windows and Linux, with only a small gap at its highest output level, giving the lead to the Linux driverset.
Looking at max latency across our 8K 70/30 workload was interesting, since it showed that even with a lower thread and queue count, the drives still saw high peak response times. The ioDrive Duo in Linux saw consistent peaks to 1,000ms in most workloads, while the Windows driver was much calmer. In this particular test the ioDrive Duo in Windows came in with the lowest peak response times until the 16T/16Q load, with the WarpDrive right behind it.
While the occasional high spikes might look discouraging, looking at the standard deviation latency plot we saw a much tamer latency profile of all of the devices except the Z-Drive R4 in Linux. Up until the highest loads, the ioDrive Duo in Windows maintained the lowest standard deviation, with the Linux driver following slightly behind, followed by the WarpDrive and then the Z-Drive R4 in Windows.
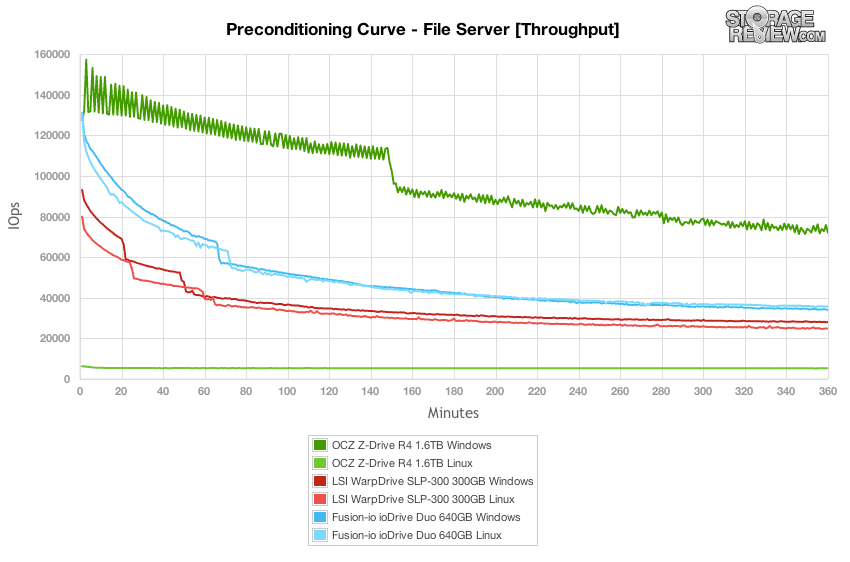
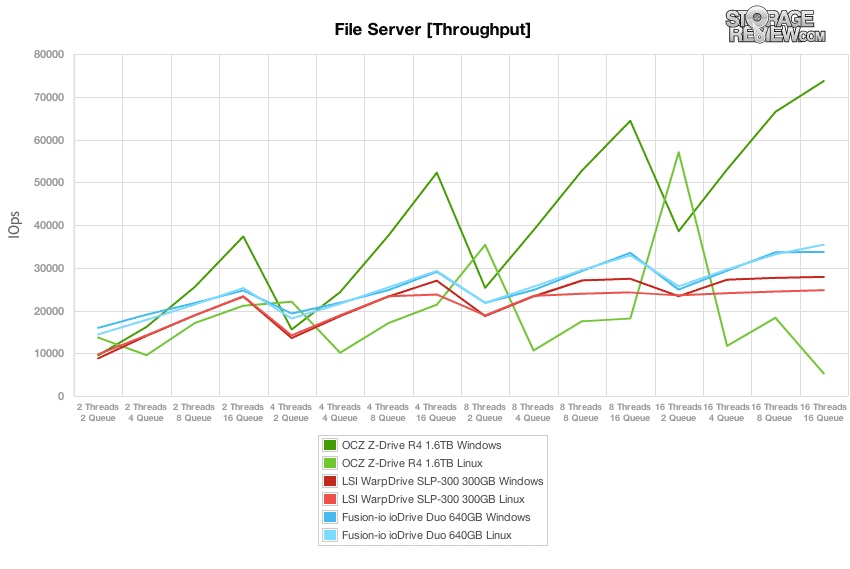
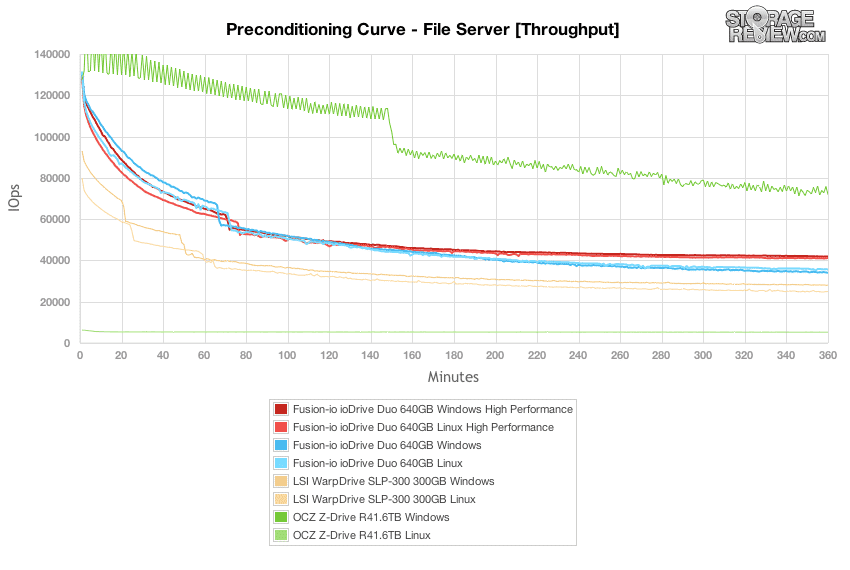
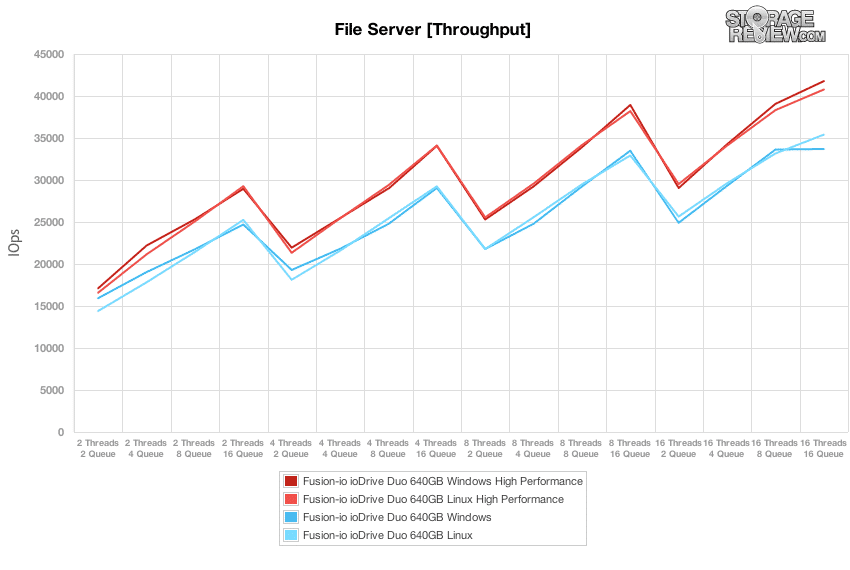
The File Server workload represents a larger transfer-size spectrum hitting each particular device, so instead of settling in for a static 4k or 8k workload, the drive must cope with requests ranging from 512b to 64K. In this section, the Z-Drive R4 in Windows stood out with the highest burst and steady-state performance, followed by the ioDrive Duo. In burst mode the ioDrive Duo in Windows offered higher speeds, then flipped with the Linux performance when the drive entered steady-state. The WarpDrive came in next, with its Windows performance being higher in both burst and steady-state modes.
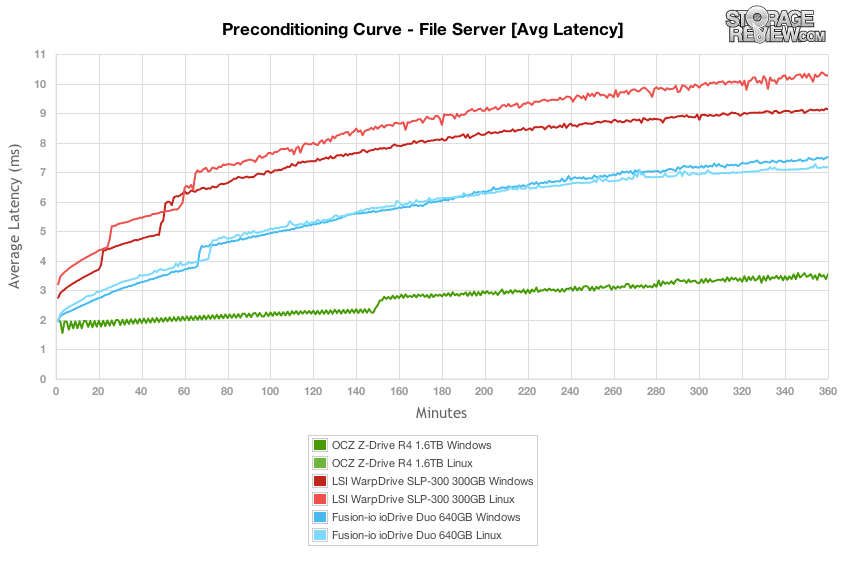
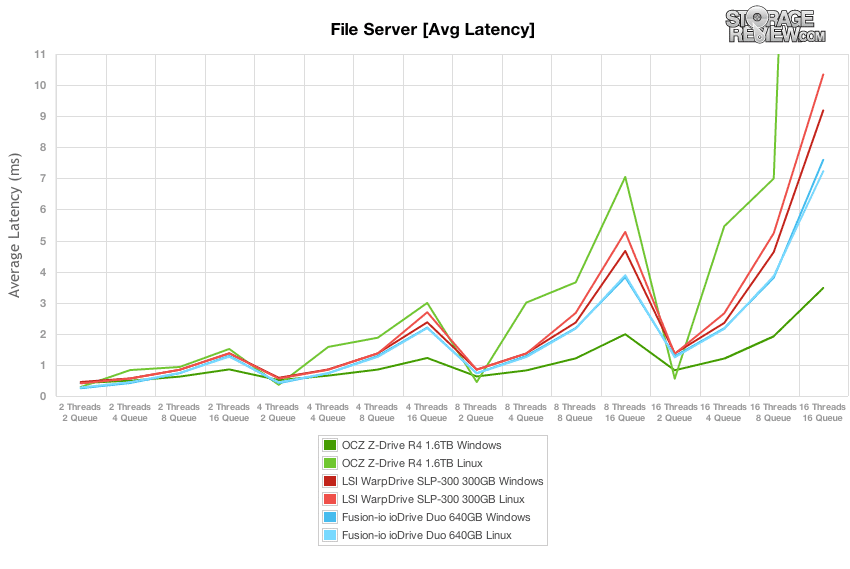
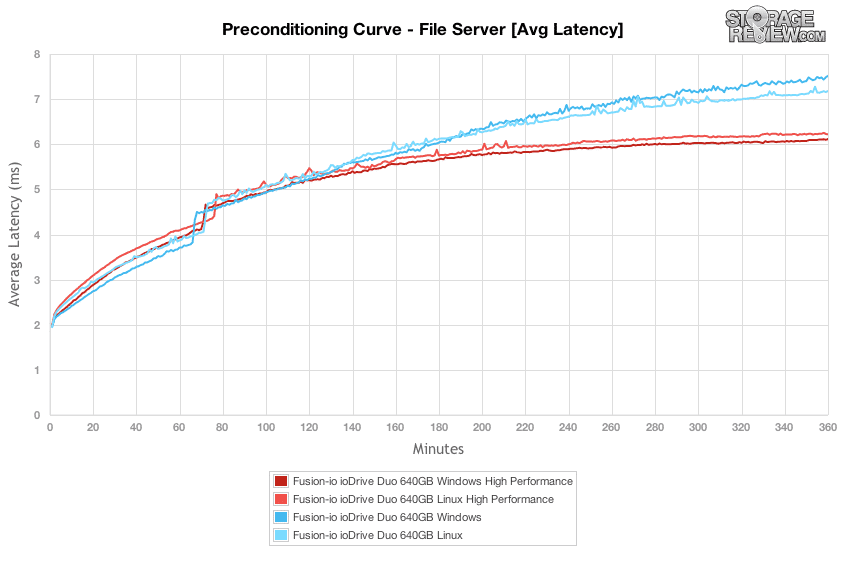
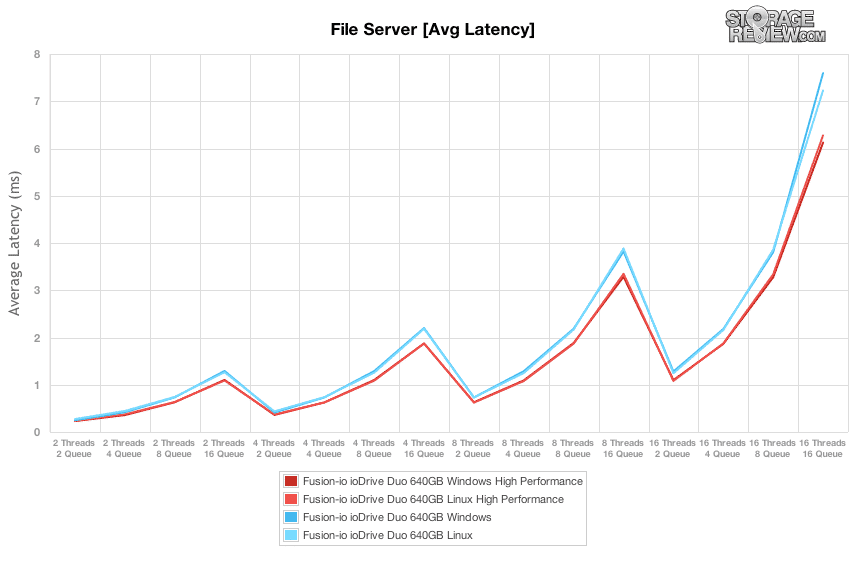
Looking at average latency over the File Server Preconditioning test, the Z-Drive R4 held a strong lead over the ioDrive Duo and WarpDrive in Windows. The ioDrive had very little difference between Linux and Windows performance, while the WarpDrive showed a bigger gap between OSes.
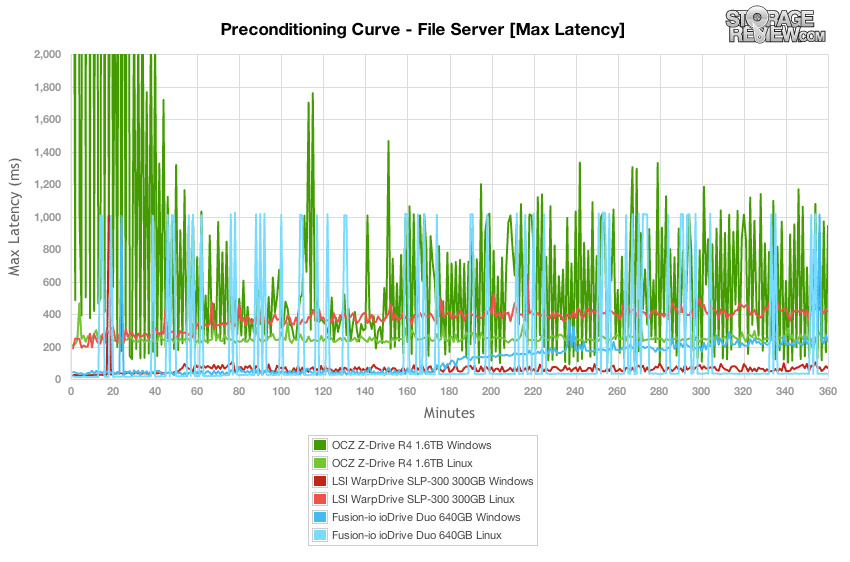
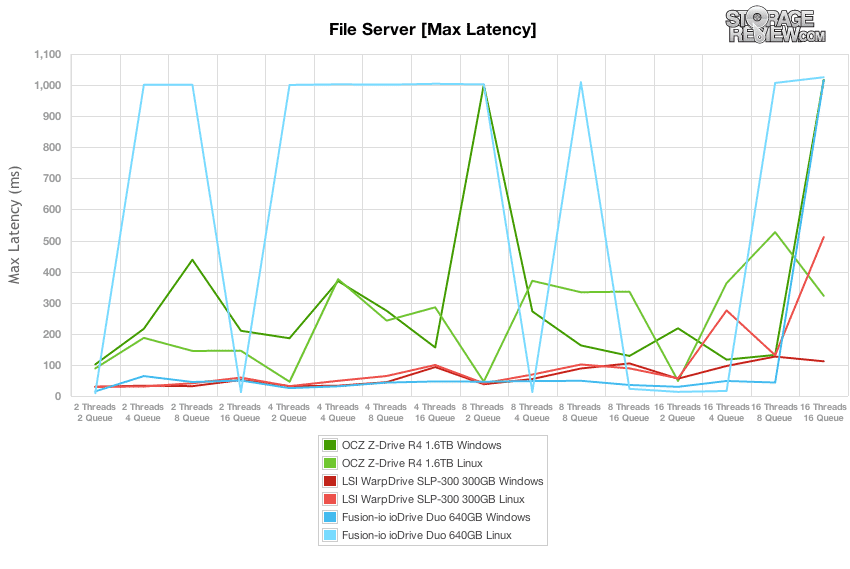
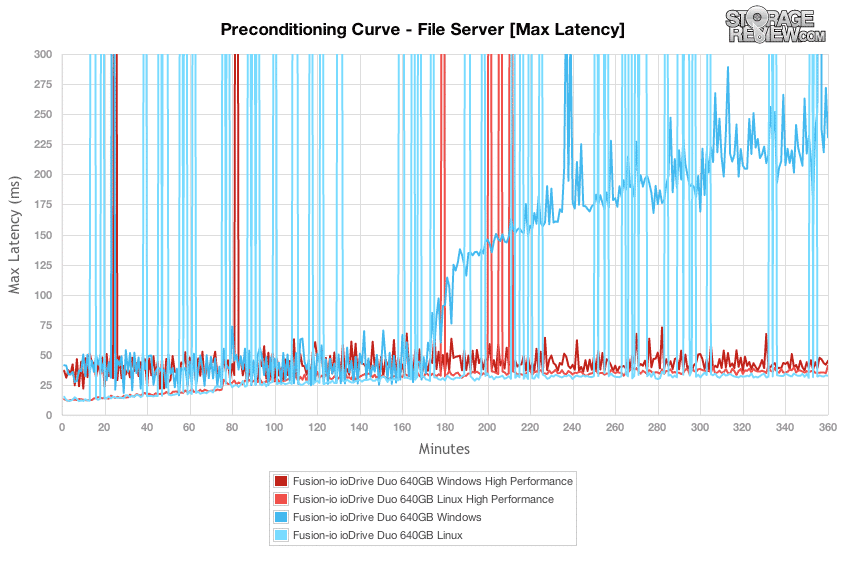
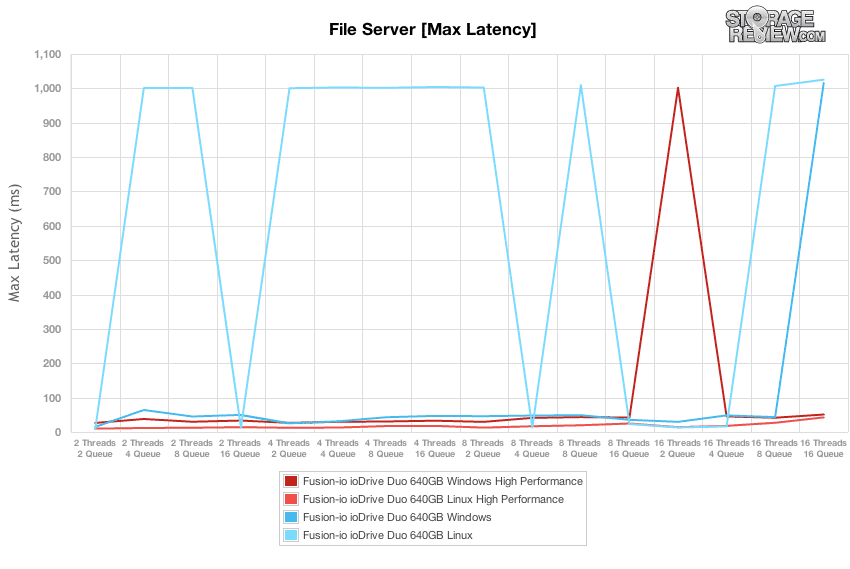
Looking at max latency over the preconditioning phase of each drive, the LSI WarpDrive showed some weakness with its Linux max response times having nearly a 400ms jump over its Windows times. The ioDrive Duo in Linux response peaks were higher than Windows, although over the duration of the test most of them where the lowest in the test, whereas the Windows side had almost no high-latency spikes, although floated higher on average. The MLC-based OCZ Z-Drive R4 fluttered throughout most of the File Server preconditioning process, with some spikes in excess of 10,000-40,000ms during the first hour of the test.
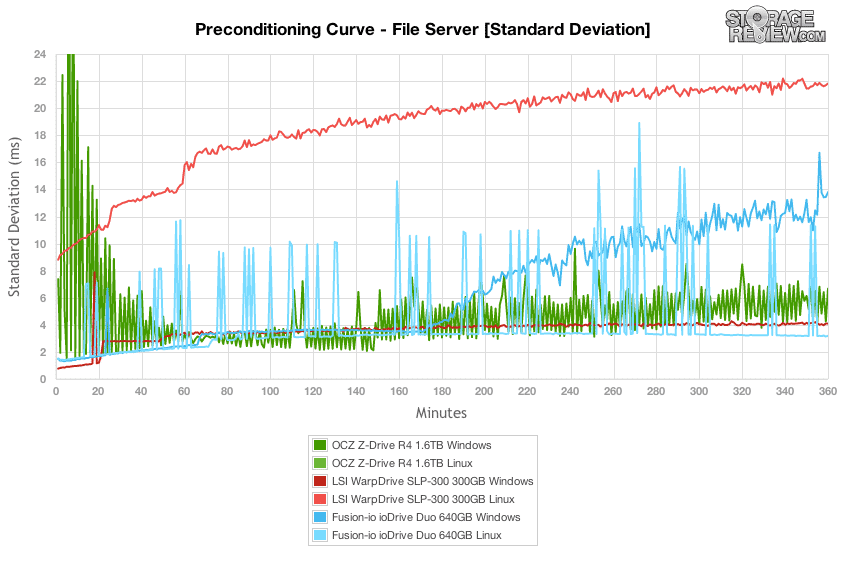
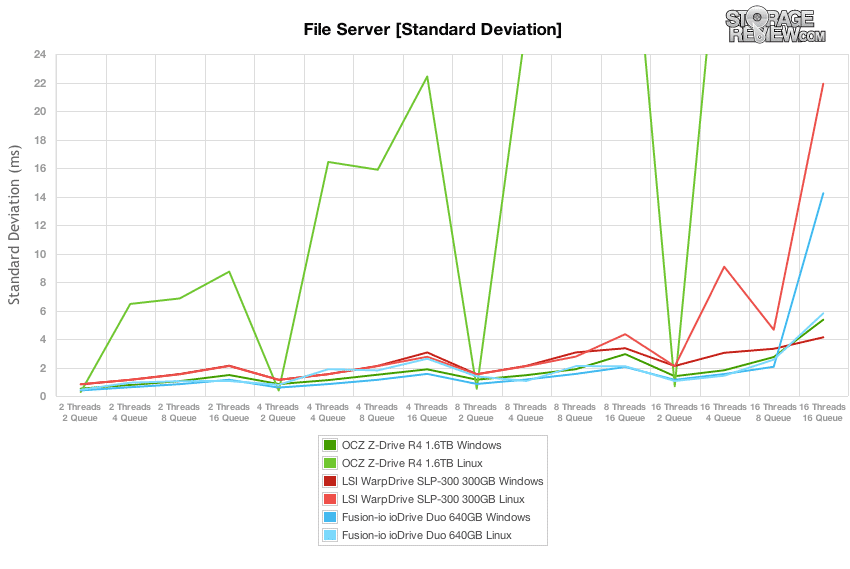
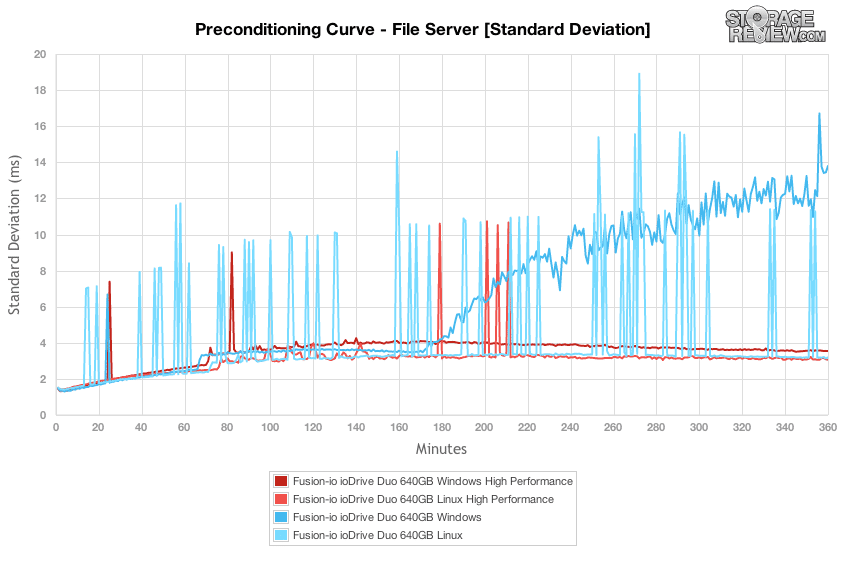
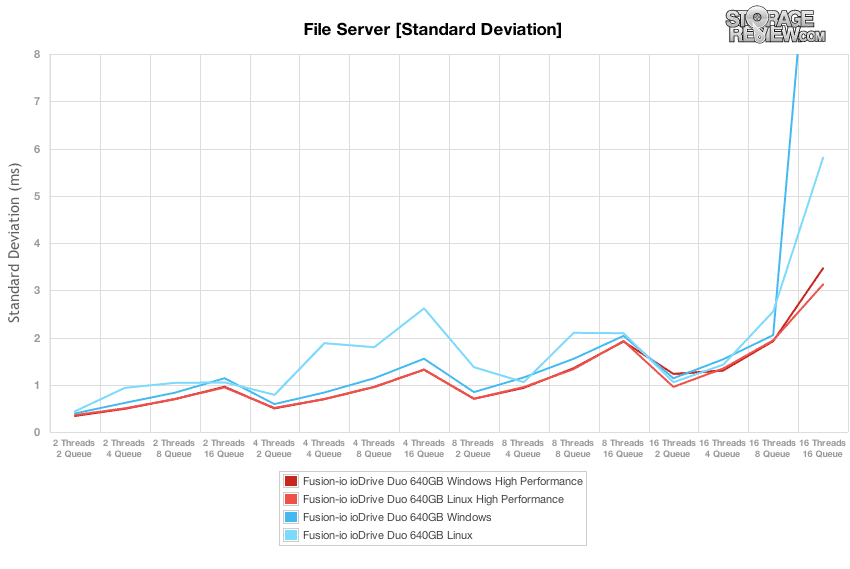
Examining the standard deviation of the devices run through our file Server preconditioning test, the most surprising difference was actually found with the LSI WarpDrive, where its Linux I/O response time increased significantly over the duration of the test compared to its Windows performance. The ioDrive Duo saw a similar change as the drive reached steady-state, where both paths diverged and the Windows responsiveness became less grouped. Overall the drive with the best performance in this section was the LSI WarpDrive under Windows, where it maintained the flattest standard deviation curve throughout the entire test.
Once our preconditioning process finished under a high 16T/16Q load, we looked at File Server performance across a wide range of activity levels. The Fusion-io ioDrive Duo maintained the highest performance at low thread and queue counts, only being surpassed by the OCZ Z-Drive R4 in throughput at higher outstanding I/O levels.
Analyzing the average latency over our varying load test, the Z-Drive R4 came out on top with the quickest response times on average as the activity picked up in our test. As the outstanding queue level increased per thread-count, the latency of the ioDrive Duo picked up on its Linux side, even though the Windows driver had slightly lower throughput.
Looking at max latency over the duration of our primary File Server test, the ioDrive in Linux still showed its higher 1,000ms spikes at low and high thread/queue count levels. Its Windows counterpart though offered the lowest consistent max response times, up until the 16T/16Q workload.
The File Server standard deviation profile of both the ioDrive Duo and WarpDrive stayed fairly tight together in both Windows and Linux up until the higher effective queue depths. In the case of the ioDrive Duo, the Linux driver maintained better composure at the 16T/16Q level, where the Windows performance scattered.
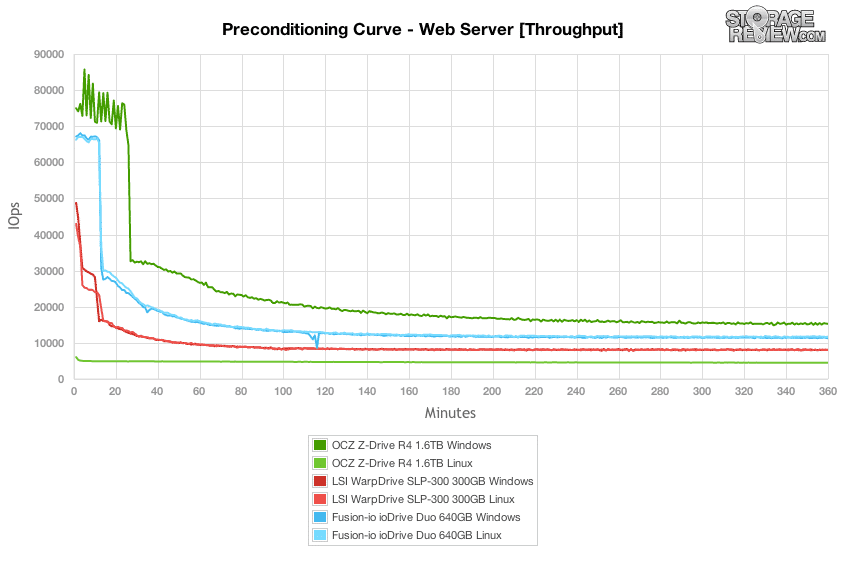
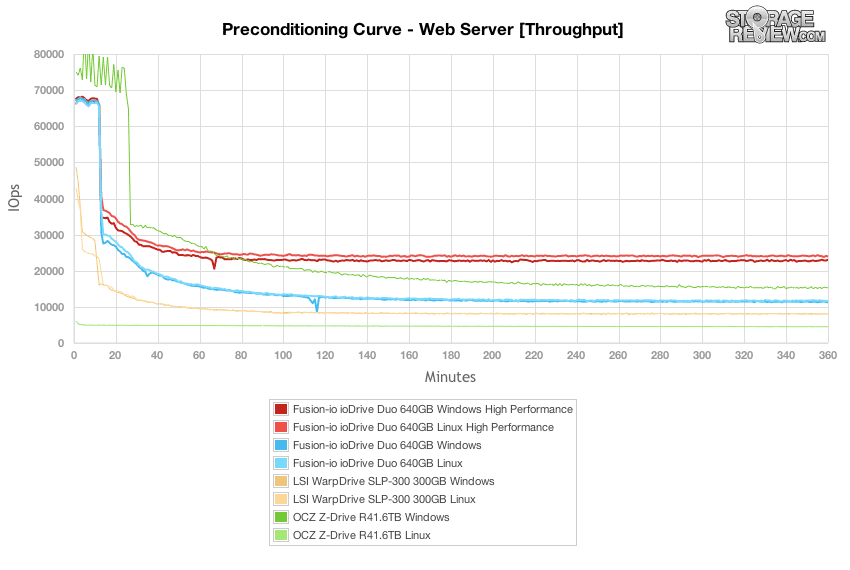
Our last workload is rather unique in the way we analyze the preconditioning phase of the test version the main output. As a workload designed with 100% read activity, it’s difficult to show each device’s true read performance without a proper preconditioning step. To keep the conditioning workload the same as the testing workload, we inverted the pattern to be 100% write. For this reason the preconditioning charts are much more dramatic than the final workload numbers. Under these harsh conditions the OCZ Z-Drive R4 maintained the highest throughput from burst to steady state, with the ioDrive Duo coming in next and the WarpDrive trailing in third.
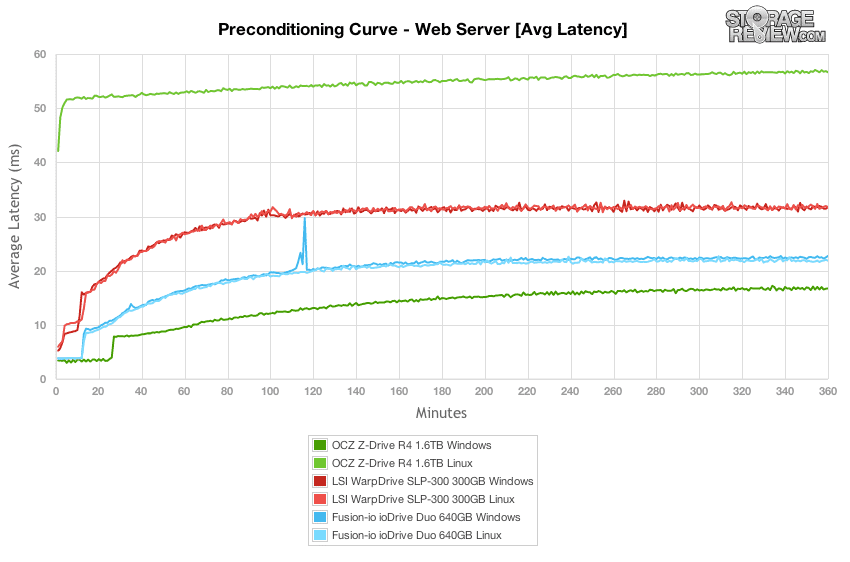
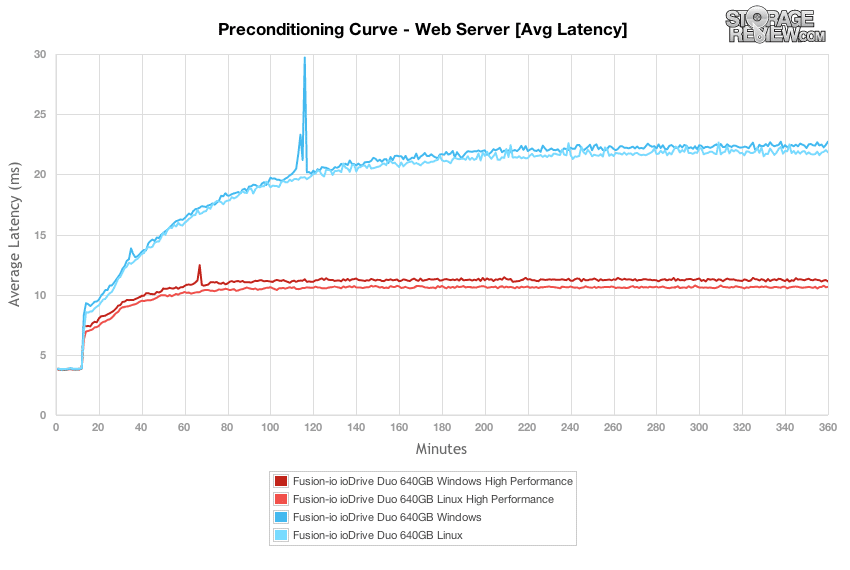
Average latency over the 100% write Web Server preconditioning process showed the ioDrive Duo in Linux having the edge with slightly lower response times than the Windows driverset. The LSI WarpDrive showed pretty much the same average response time, while the Z-Drive R4 had a huge spread between Windows and Linux performance.
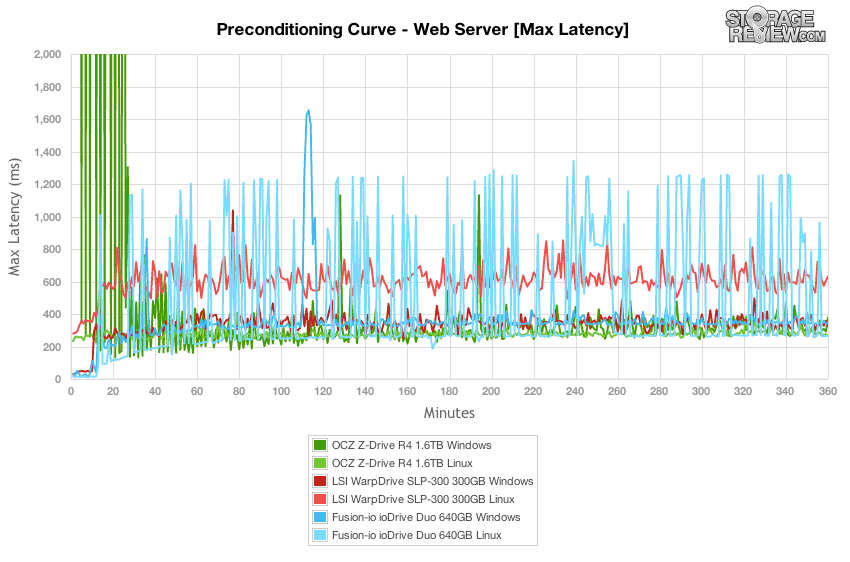
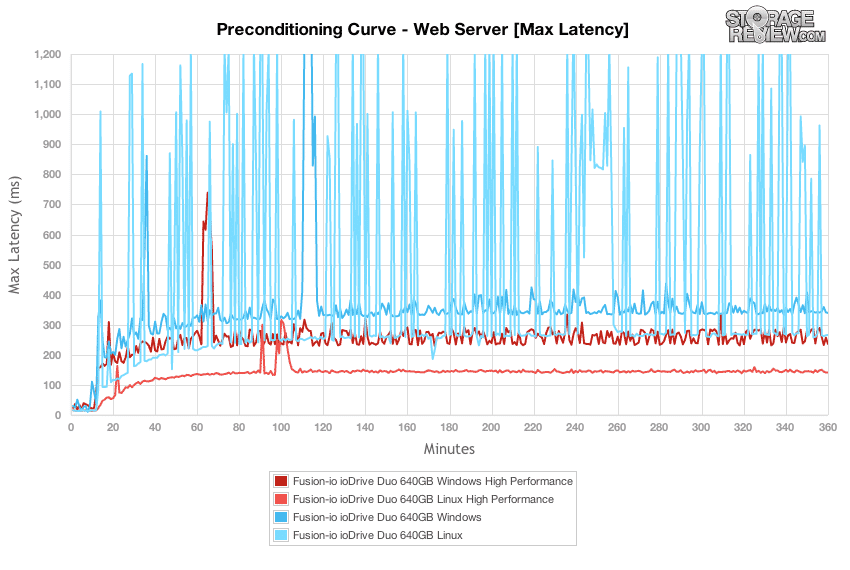
Looking at max latency in the Web Server preconditioning curve, the Z-Drive R4 had the highest peaks, but once it leveled off it maintained a fewer amount of high-latency spikes. Looking at the ioDrive Duo, while its Linux performance had the edge in throughput and average response times, it had some of the highest spikes in this test, pushing upwards of 1,200ms, whereas the Windows driver was much calmer with its spikes generally in the 300-400ms range (except for one large spike to over 1,600ms).
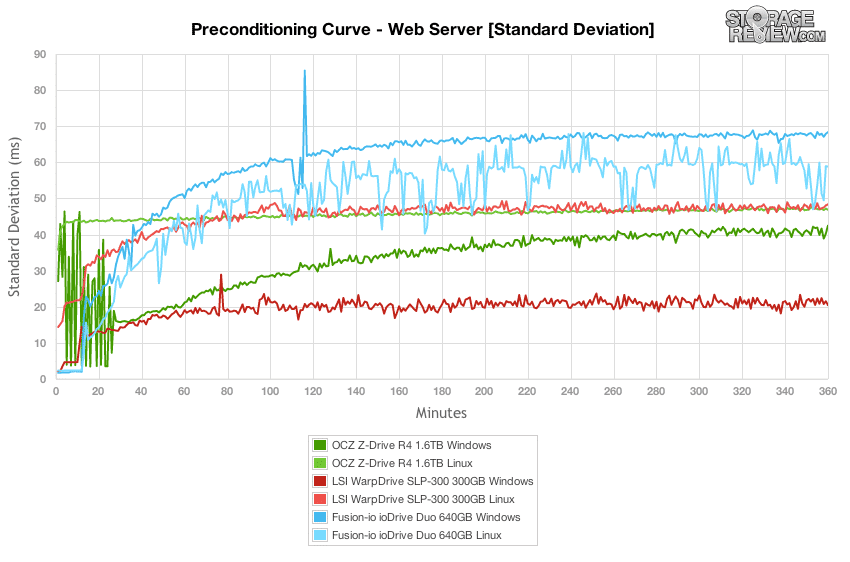
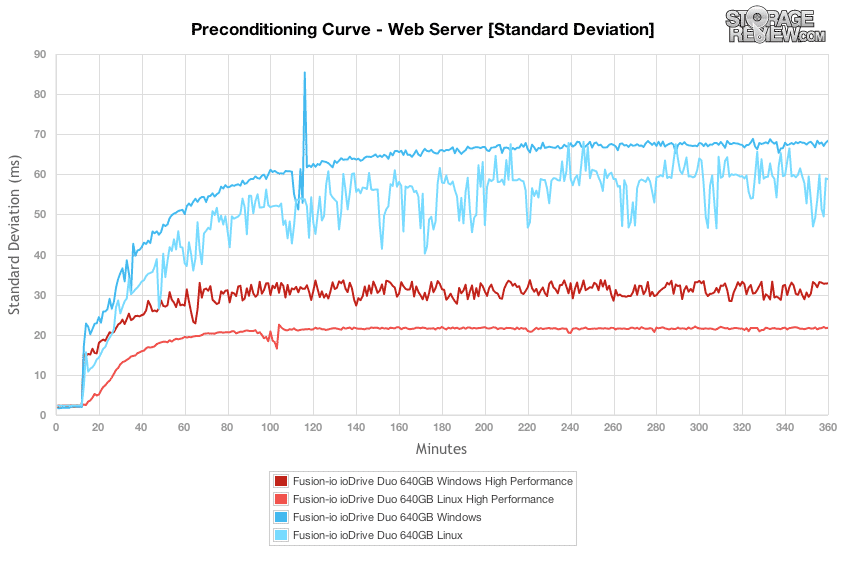
The SLC-based LSI WarpDrive maintained the lowest standard deviation profile over the duration of the Web Server preconditioning process in Windows, trailed by the Z-Drive R4 once it calmed down, followed again by the WarpDrive with its Linux driver, and then by the ioDrive Duo in Linux and then Windows.
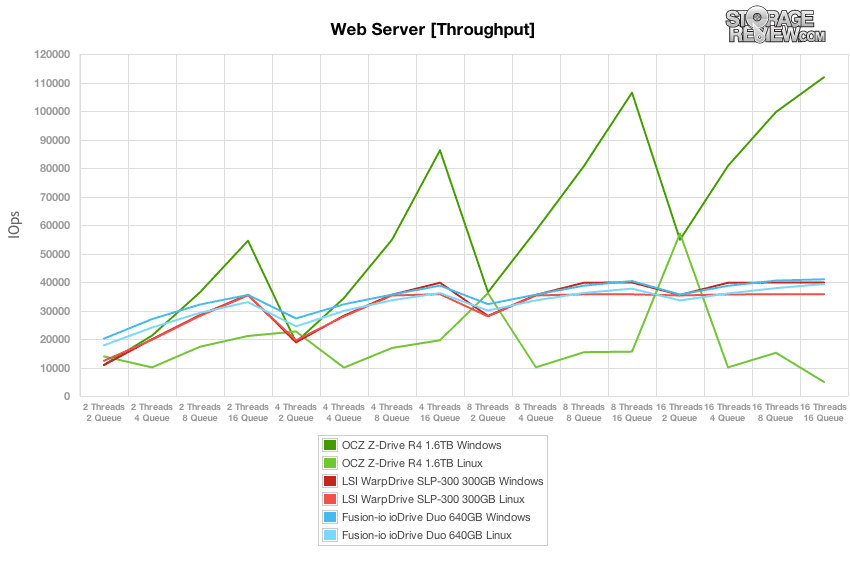
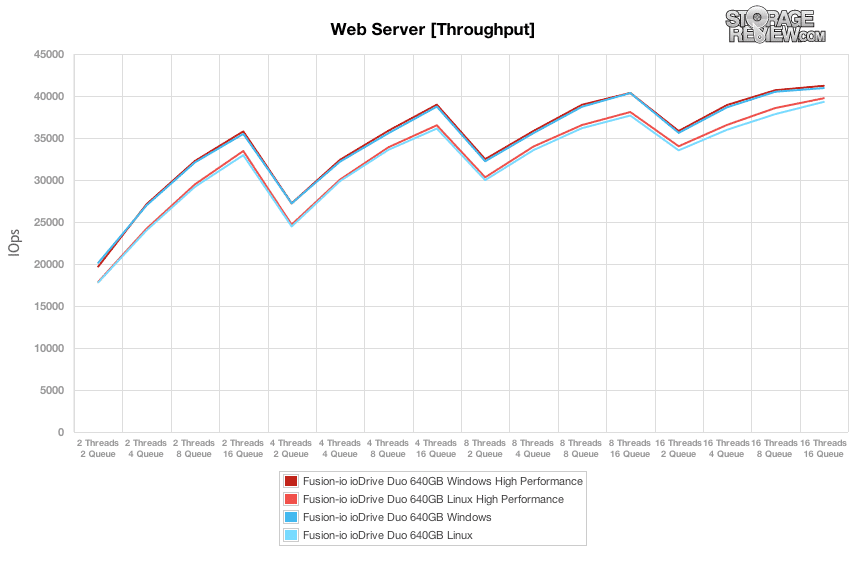
Switching back to a 100% read Web Server workload after the preconditioning process, the OCZ Z-Drive R4 definitely offered the highest performance inside a Windows performance, with more than double the throughput speed at its highest. At the same time, it was contrasted with its Linux performance, which was slowest at the same points that it offered the highest performance in Windows. With the smallest workloads, the ioDrive Duo came in again with the fastest speeds, although it was quickly surpassed by the Z-Drive R4 once the effective queue depth increased.
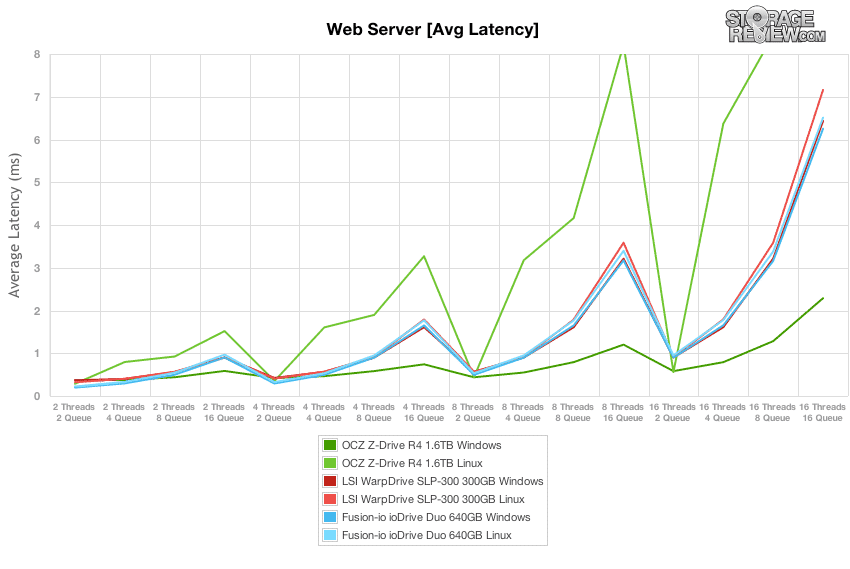
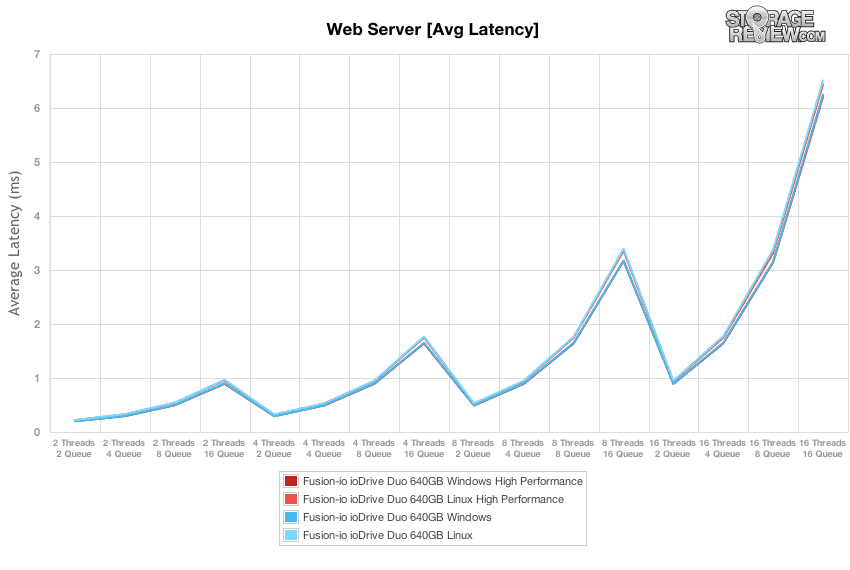
Both the ioDrive Duo and WarpDrive remained close together in the Web Server average latency test, although both were easily beaten by the R4 in Windows.
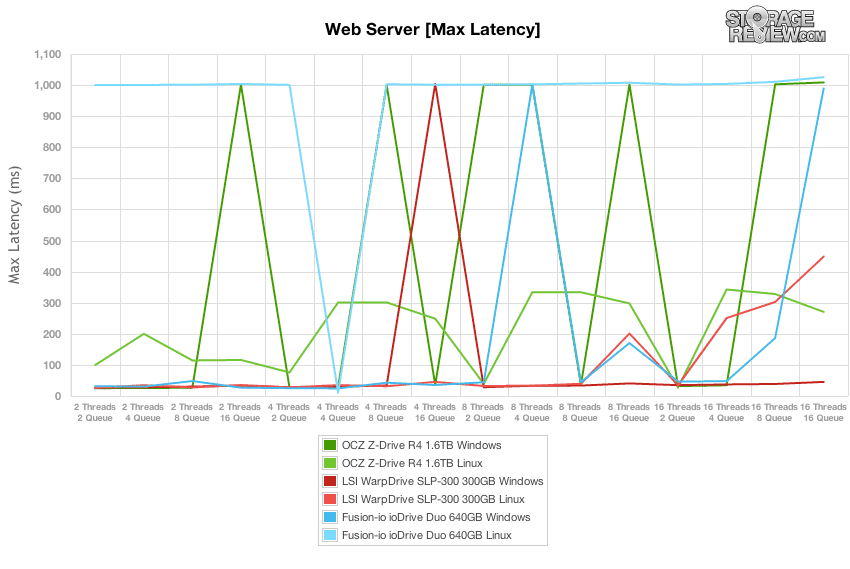
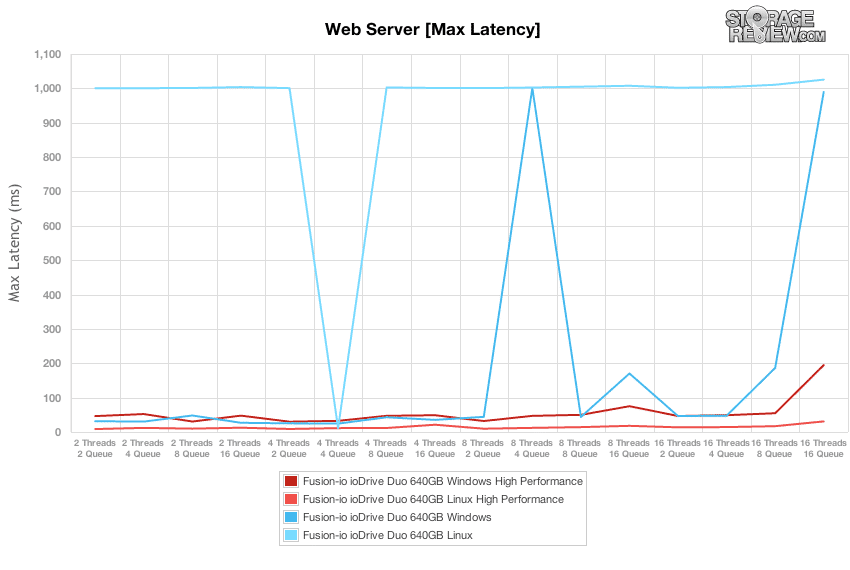
It was somewhat surprising to see some of the higher latency spikes in the 1,000ms range remained in the read-intensive Web Server test, although while the behavior is seen the most on the ioDrive Duo in Linux, it was noted on all three devices at different points in the test.
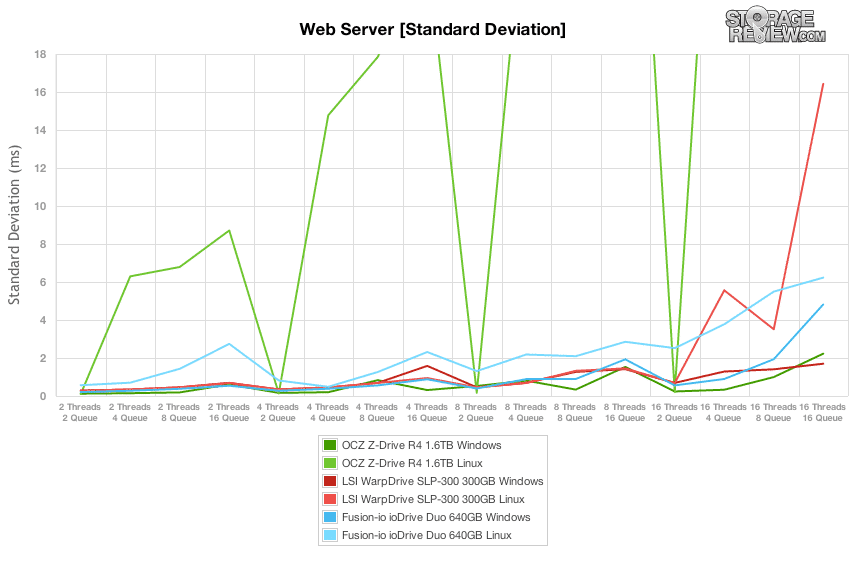
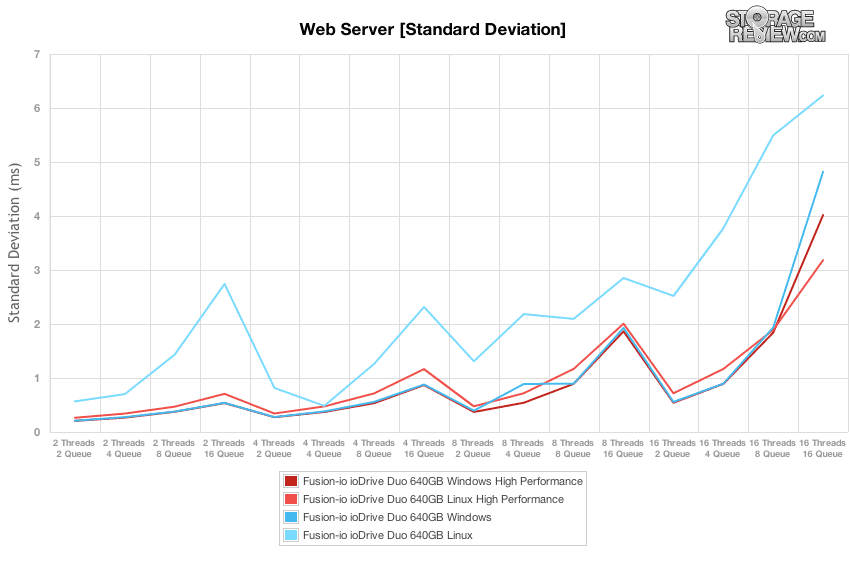
The standard deviation plot of the Web Server activity showed the ioDrive Duo having consistently higher response times at higher queue depth rates, with it peaking at 16T/16Q. This was while the Windows performance remained tight until the highest workloads. The LSI WarpDrive maintained a fairly flat profile, up until the end on the Linux side where latency started the flutter.
Enterprise Synthetic Workload Analysis (High-Performance Mode)
Out of the three PCIe Application Accelerators in this review, only the Fusion-io ioDrive Duo offers a method to change the sector size or user-visible formatted space for increased performance. While it’s possible to partition off part of the drive and not use it with the other products, that process isn’t as intuitive. Some aren’t even aware of the implications when trading capacity for performance gain.
While the majority of this review centered on the stock capabilities of the ioDrive Duo, this remaining portion revisits our new Synthetic Workload Analysis to see how performance differs between high-performance mode and the stock configuration. At the stock size of 320GB per device, the ioDrive Duo has a level of 20% over-provisioning between RAW NAND and user-visible. Formatting the ioDrive Duo to high-performance mode drops that capacity down to 256GB, or 36% over-provisioning, bringing the total capacity down from 640GB to 512GB. While you trade a good amount of available capacity, we were surprised by just how much it would affect steady-state performance. In some cases we saw performance more than double.
With the ioDrive Duo put into high-performance mode, 4K 100% write burst speeds stayed roughly the same at ~257k IOPS, but the difference in steady-state performance is dramatic. While the ioDrive Duo in stock configuration maintained throughput speeds of 41-42k IOPS towards the end of the preconditioning phase, the high-performance mode brought levels up to about 90,000 IOPS. That is more than a 2x jump by sacrificing some user-capacity.
Going hand-in-hand with faster throughput, the latency also decreased by half in the 4K write preconditioning stage.
When looking at the max latency profile of the 4K write preconditioning test, many of the same traits remained, although this time around much lower. The Windows 4K latency was slightly higher originally, although had fewer high-latency spikes that were seen in the Linux environment. When the drive was formatted into high-performance mode, the Windows profile still had more jitter, but the Linux profile had better composure and lacked the high-latency spikes seen previously.
The most telling chart showing the dramatic improvement of the ioDrive Duo in high performance mode through is the latency standard deviation profile. With the increase in space for background GC activity, under a full 4K 100% write load, the standard deviation decreased from 25-30ms previous to 2-5ms.
Comparing our steady-state 4K 100% read and write scores between stock and high-performance modes, we saw no increase in read performance. This isn’t that uncommon, since over-provisioning generally only improves steady-state write speeds, without an impact on read or write burst speeds. In this case 100% 4K read performance stayed at just over 140,000 IOPS, with steady-state write performance jumping up from 40.9-42.6K up to 90.4-91K IOPS.
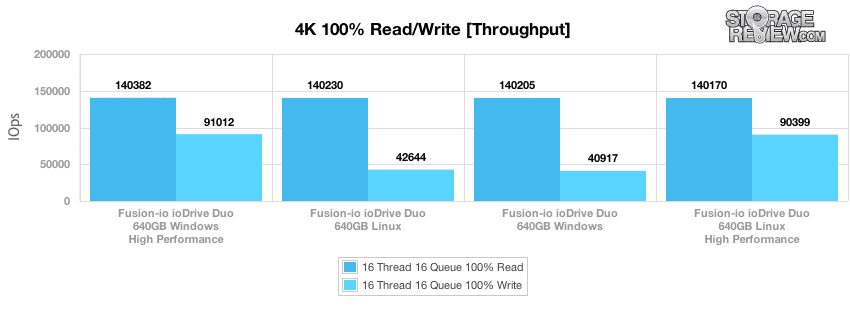
The improvement of 4K write latency that we originally observed in the preconditioning phase averaged out to 2.80-2.82ms on the high-performance mode ioDrive Duo, compared to 6-6.25ms in stock mode.
Even though we didn’t measure a noticeable decrease in 4K read average response time or an increase in throughput, the high-performance configured ioDrive Duo offered much lower peak read responses. Peak 4K write response times also decreased dramatically.
The difference in standard deviation between the two over-provisioning modes was night and day, with the high-performance ioDrive Duo measuring 1.70-1.76ms versus 25.6-31.6ms prior.
While the performance uptick in random 4K write performance was impressive, we were more interested in seeing how the ioDrive Duo would change in a mixed workload with read activity thrown into the mix. In our 8K 70/30 preconditioning test, throughput increased signficantlly, from the 51-53k IOPS range prior to roughly 76K IOPS in high performance mode. Burst speeds were quite similar between formatting configurations, although the over-provisioned ioDrive Duo started to drop into steady-state quicker.
Looking at the latency in our 8K 70/30 workload, gone where the moderate differences between the Linux and Windows driver on the ioDrive Duo in high-performance mode. Average latency dropped a significant amount and remained very consistent over the preconditioning process.
While throughput and average latency improvements are important, peak latency is another factor to pay attention to when changing the configuration of the ioDrive Duo. In this case, the extra over-provisioned space gave the drive enough room in the background suppress most of the max latency jumps that we saw in the spike configuration. With that said, they weren’t entirely gone, but the bulk of the activity dropped to much lower levels.
Looking at latency standard deviation, you can see the full picture on just how big of an impact giving the ioDrive Duo some additional over-provisioning space can have. Standard deviation dropped by a factor of 5, staying right around 2ms throughout the preconditioning process, versus 8-12ms previous.
The ioDrive Duo continued to show performance benefits across the board in our main throughput tests where we vary the load between 2T/2Q and 16T/16Q.
Looking at average latency differences in our 8K 70/30 workload comparing the ioDrive Duo stock to high-performance modes, the difference was most notable at the higher queue depths at each thread count.
As we saw in the max latency stage of the 8K 70/30 preconditioning test, many of the same high peaks remained over the duration of the test, although there were fewer of them.
Comparing the latency standard deviation across the board, over-provisioning made a largest impact at some increased queue-depth loads, while areas such as 8T/16Q didn’t see any change at all.
The Fusion ioDrive Duo didn’t see as much of an improvement in total throughput by increasing the amount of over-provisioning. Performance still increased, although the increase was modest, versus the dramatic jump found in the 100% 4K write or the 8K 70/30% workload.
Average latency over the duration of the File Server preconditioning test improved from roughly 7-7.5ms to just over 6ms as the ioDrive Duo neared steady-state performance.
Even though the Fusion ioDrive Duo didn’t see a dramatic improvement in throughput or average latency, it was able to suppress many of the high-latency spikes found in the stock over-provisioning configuration. The largest improvement happened with the Windows driver, which maintained a peak latency ceiling of around 50-75ms in steady state versus the 225-250ms range prior.
Analyzing the latency standard deviation in the File Server preconditioning test, increased over-provisioning kept flutter to a minimum once the drive neared steady-state. Linux latency standard deviation didn’t improve that much, but the Windows standard deviation dropped from 12-14ms to just under 3ms.
Increasing the over-provisioning of the Fusion ioDrive Duo allowed the card to increase in performance roughly 5,000 IOPS over most thread and queue depth combinations, with the largest increase at higher queue depth loads.
Latency was improved in both areas, with the Fusin ioDrive Duo in Windows getting the biggest improvement at the 16T/16Q load, going from slowest to fastest.
Comparing the peak latency in the File Server workload, the ioDrive Duo calmed down greatly in Linux, losing many of its 1,000ms peaks from before. This time around it had only a single 1,000ms peak in the Windows test.
Standard deviation across the board dropped a good amount, showing how much the ioDrive Duo calmed down with the increased amount of over-provisioning.
While our Web Server preconditioning curve isn’t the best representation of Web Server activity, in fact its the opposite at 100% write, it still goes to show how much of an impact that increased over-provisioning can have. Total throughput increased a good amount, even surpassing the OCZ Z-Drive R4.
Average latency over the duration of our Web Server preconditioning test was cut in half, from over 20ms previously, to just over 10ms in high-performance mode.
Almost all of the high-latency spikes were suppressed with increased over-provisioning, with the Linux performance improving the most.
Latency standard deviation improved dramatically over the duration of the Web Server preconditioning section, with the biggest change on the Linux side with the curve almost flat compared to stock performance.
Switching the Web Server profile back to 100% read, we saw little or no improvement in the throughput speed between stock and increased over-provisioning in this particular workload. This isn’t surprising though, as over-provisioning really only benefits write-related performance.
Average latency was near identical across the board, showing little signs of improving with additional over-provisioning.
While throughput and average latency didn’t improve, the high-latency response times completely disappeared in this 100% read Web Server profile when over-provisioning levels were increased.
Similar to the decreased in peak latency in our Web Server profile with the ioDrive Duo in High-Performance mode, latency standard deviation also dropped a large amount in our Linux test, whereas the Windows test saw minimal improvements.
Conclusion
When taking a renewed look at the ioDrive Duo there are several things that stand out. Given Fusion-io was an early pioneer of this particular iteration of storage technology and they own several pieces of key intellectual property around storage, it shouldn’t be that surprising that the overall package is so tight, but the level of precision is worthy of credit. That’s not just precision in terms of performance, which even as prior generation technology, it does well. But precision in terms of the polished feeling everywhere from packaging, to software interface to consistent performance across many of their supported platforms including the versions of Windows and Linux that we tested. While the current ioDrive Duo has been software updated several times since its initial release, considering the drive came out in early 2009, it shows very little age.
For an MLC-based drive, the ioDrive Duo holds its own very well against the SLC-based LSI WarpDrive that could be considered its closest competitor. As products designed squarely for the Enterprise Application Acceleration segment, both models excel with heavy workloads across multiple OS platforms. In nearly every test, the ioDrive Duo offered consistent performance, although in terms of max latency the WarpDrive with its SLC-NAND fared better than our MLC-equipped 640GB ioDrive Duo. When comparing it to the MLC-based OCZ Z-Drive R4, it was easy to see how both of these products are designed for distinctly different markets. The Z-Drive offered high speed and high-capacity thanks to lower-cost consumer grade NAND and newer-generation controllers, but its peak latency and standard deviation where more inconsistent than the ioDrive Duo or WarpDrive. The Z-Drives strengths were more on the read-heavy side, whereas the ioDrive Duo and WarpDrive found their place in a write-heavy environment. For deployments outside of Windows, where the ioDrive Duo and WarpDrive both offered similar performance in Linux, the Z-Drive R4’s performance starkly contrasted its Windows scores, posting exponentially slower performance throughout.
Of course the stock-capacity ioDrive Duo isn’t without its weaknesses, as seen by its frequent 1,000ms blips in low and high queue depth tests when in steady-state. Given the consistent standard deviation though, many of those blips were few time events, instead of consistently hitting higher response rates. Another minor area of concern might be found depending on platform, as Linux tended to be this product’s strong suit, even if it only slightly edged out its Windows performance. At the end of the day though, these latency concerns probably wouldn’t show up in the SLC-based ioDrive Duo, which could be seen as a closer competitor to the LSI WarpDrive, which is only available in a 300GB SLC configuration.
When we tested the ioDrive Duo in its high-performance mode, which dropped the formatted capacity to 256GB from 320GB per ioDimm, performance more than doubled in some cases. 4K random write performance spiked from 40,000 IOPS to 90,000 IOPS and at the same time peak latency dropped like a rock. For enterprise users willing to trade capacity in the name of speed and low-latency, Fusion-io offers an easy way for the end-user to make those changes. None of the competing PCIe solutions offer that type of performance configuration unless you are willing to manually partition off user-space and leave a section unused, which might not be feasible in all applications.
Pros
- Tightest integration of software and hardware from any PCIe Application Accelerator vendor
- Closest performance parity between Windows and Linux drivers
- Great throughput and latency in stock mode that gets even better in high-performance mode
- Strong low-queue/low-thread count performance
Cons
- Installation and initial setup might be more difficult than other solutions (external power required, no built-in OS driver support)
- Needs more system resources with VSL footprint used to present the ioDrive as a memory tier
Bottom Line
From an ease of use perspective, the ioDrive Duo sets the standard for how a PCIe Application Accelerator should be presented to the end user. Regardless of the operating system used, the experience is nearly identical, down to the supplied GUI and console management tools. From day one the user can sit down, regardless of OS, and get the ioDrive Duo’s hardware status, format or over-provision it to their liking, and put into production. The ioDrive Duo is a complete offering that is more refined than anything else on the enterprise storage market.
Update 8/17/12 – Our LSI Nytro WarpDrive Review has been posted and appended to the charts used in this Fusion-io review.


 Amazon