

The Huawei ES3000 v3 is a series of NVMe SSDs (Non-Volatile Memory Express Solid State Drives) that marks the sixth generation of Huawei’s enterprise-level SSDs. The ES3000 v3 series is Huawei first NVMe drive however. The series comes in two form factors: 2.5” (15mm z-height) and Half-Height, Half-Length add-in card (HHHL AIC). The drive comes in a variety of capacities from 1.2TB to 3.2TB.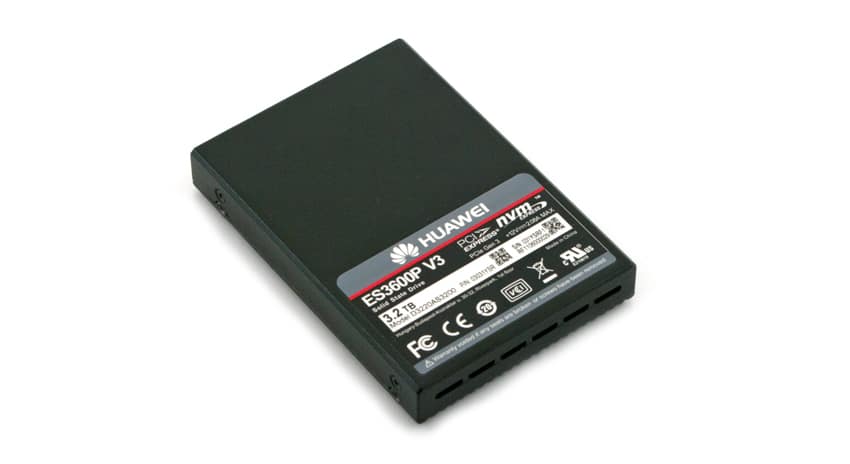
Like most NVMe drives, the ES3000 v3 series is designed to bring higher performance to several applications. The applications that Huawei is targeting with this drive are the usual suspects of Oracle/MySQL/SQL Server Databases, VMware/FusionSphere VM systems, High Performance Computing (HPC), and Big Data analytics. The ES3000 v3 drives can also be used for hot data caching and ServerSAN distributed storage systems. While Huawei isn’t marketing the drive as either write-intensive or read-intensive it does come in two versions: ones with lower endurance, the ES3500P v3, and one with higher endurance, the ES3600P v3 and the ES3600C v3.
For our review we will be looking at the 3.2TB ES3600P v3, 2.5” drive.
Huawei ES3600 v3 NVMe SSD specifications:
- Form factor: 2.5” | HHHL AIC
- Interface: PCIe 3.0 x 4
- NAND type: MLC
- Capacities: 1.2TB, 1.6TB, 3.2TB | 1.6TB, 3.2TB
- Performance:
- 512B LBA Format
- Max. Read Bandwidth: 3,100MB/s
- Stable Read 4K: 770K IOPS
- Average Read Latency: 76µs
- Max. Write Bandwidth: 1,850MB/s (1.2TB), 2,050MB/s
- Stable Write 4K:
- 2.5”
- 1.2TB: 160K IOPS
- 1.6TB: 175K IOPS
- 3.2TB: 170K IOPS
- HHHL
- 1.6TB: 175K IOPS
- 3.2TB: 170K IOPS
- 2.5”
- Average Write Latency: 12µs
- Read/Write 7/3 4K:
- 2.5”
- 1.2TB: 390K IOPS
- 1.6TB: 455K IOPS
- 3.2TB: 440K IOPS
- HHHL
- 1.6TB: 455K IOPS
- 3.2TB: 440K IOPS
- 4,096B LBA Format
- Max. Read Bandwidth:
- 2.5”
- 1.2TB: 3,300MB/s
- 1.6TB: 3,400MB/s
- 3.2TB: 3,100MB/s
- HHHL
- 1.6TB: 3,400MB/s
- 3.2TB: 3,100MB/s
- Stable Read 4K:
- 2.5”
- 1.2TB: 810K IOPS
- 1.6TB: 815K IOPS
- 3.2TB: 800K IOPS
- HHHL
- 1.6TB: 815K IOPS
- 3.2TB: 800K IOPS
- 2.5”
- Average Read Latency: 76µs
- Max. Write Bandwidth:
- 2.5”
- 1.2TB: 1,850MB/s
- 1.6TB: 2,050MB/s
- 3.2TB: 2,050MB/s
- HHHL
- 1.6TB: 2,050MB/s
- 3.2TB: 2,050MB/s
- 2.5”
- Stable Write 4K:
- 2.5”
- 1.2TB: 160K IOPS
- 1.6TB: 175K IOPS
- 3.2TB: 170K IOPS
- HHHL
- 1.6TB: 175K IOPS
- 3.2TB: 170K IOPS
- 2.5”
- Average Write Latency: 12µs
- Read/Write 7/3 4K:
- 2.5”
- 1.2TB: 410K IOPS
- 1.6TB: 480K IOPS
- 3.2TB: 470K IOPS
- HHHL
- 1.6TB: 480K IOPS
- 3.2TB: 470K IOPS
- 2.5”
- Max. Read Bandwidth:
- 512B LBA Format
- Max. Power Consumption
- 2.5”
- 1.2TB: 17.5W
- 1.6TB: 18.5W
- 3.2TB: 22W
- HHHL
- 1.6TB: 18.5W
- 3.2TB: 22W
- 2.5”
- Reliability
- DWPD: 3
- Warranty: 5-year
- MTBF: 2M hours
- Operational Temperature: 0~70°C
- Trim Supported
- Supported OS
- Microsoft Windows: Windows Server 2012R2
- Linux: RHEL 6/7, SLES 11/12, CentOS 6/7, Ubuntu 13/14
- Hypervisors: VMware vSphere 5.5/6, Microsoft Hyper-V, Huawei FusionSphere
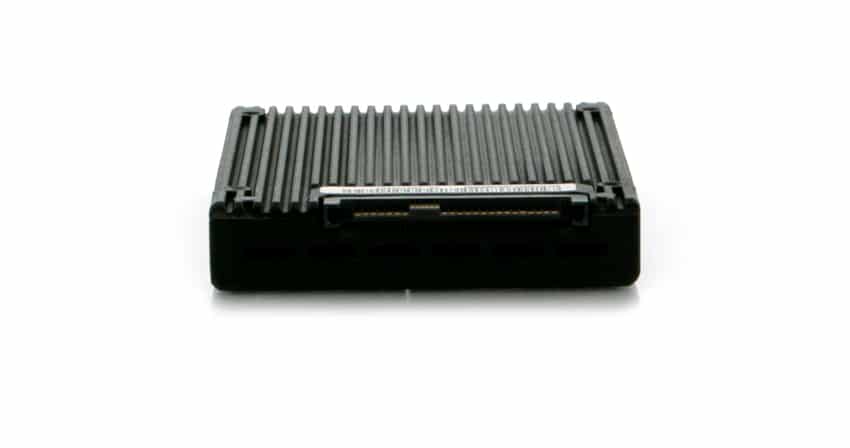
Design and build
The Huawei ES3600 v3 is a 2.5”, 15mm z-height NVMe SSD. The drive is predominately flat black with a sticker on top with information such as model type, capacity, and interface.
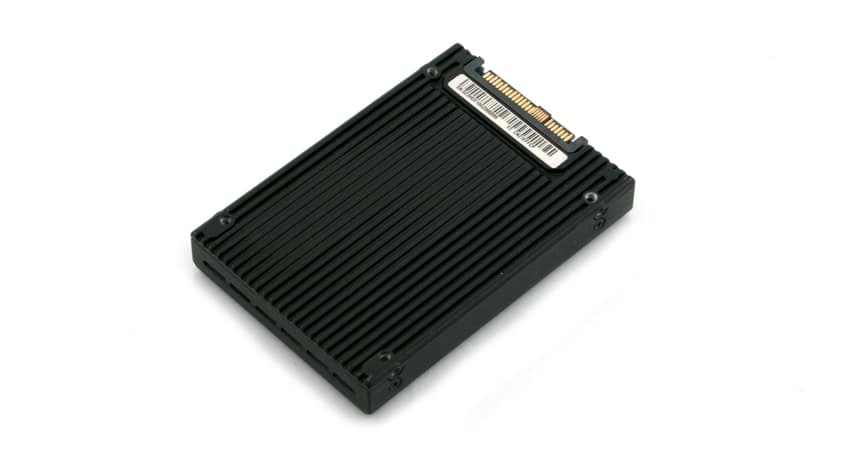
The underside of the drive is covered by a heat sink giving the drive a ridged appearance.
Testing Background and Comparables
The StorageReview Enterprise Test Lab provides a flexible architecture for conducting benchmarks of enterprise storage devices in an environment comparable to what administrators encounter in real deployments. The Enterprise Test Lab incorporates a variety of servers, networking, power conditioning, and other network infrastructure that allows our staff to establish real-world conditions to accurately gauge performance during our reviews.
We incorporate these details about the lab environment and protocols into reviews so that IT professionals and those responsible for storage acquisition can understand the conditions under which we have achieved the following results. None of our reviews are paid for or overseen by the manufacturer of equipment we are testing. Additional details about the StorageReview Enterprise Test Lab and an overview of its networking capabilities are available on those respective pages.
Comparable drives for this review:
Application Workload Analysis
In order to understand the performance characteristics of enterprise storage devices, it is essential to model the infrastructure and the application workloads found in live production environments. Our first benchmarks for the Huawei ES3600v3 2.5” are therefore the MySQL OLTP performance via SysBench and Microsoft SQL Server OLTP performance with a simulated TCP-C workload. For our application workloads, each drive will be running 2-4 identically configured VMs.
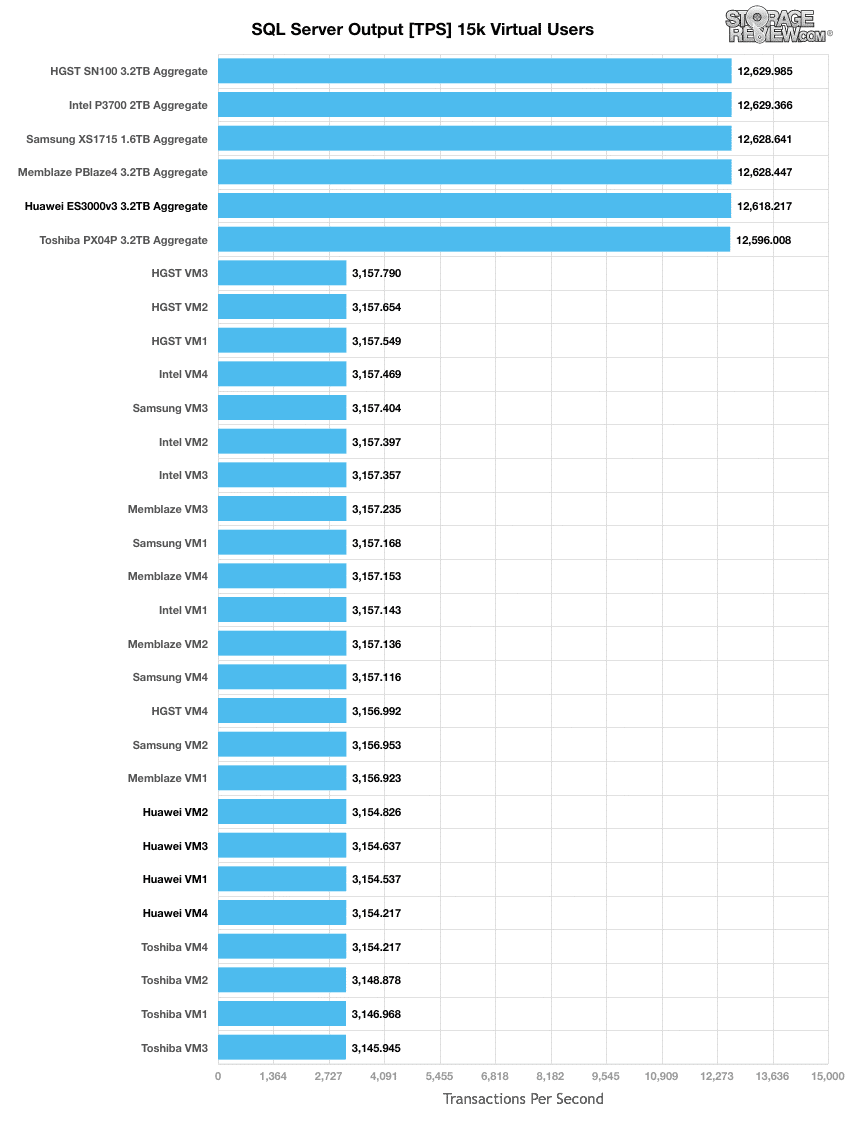
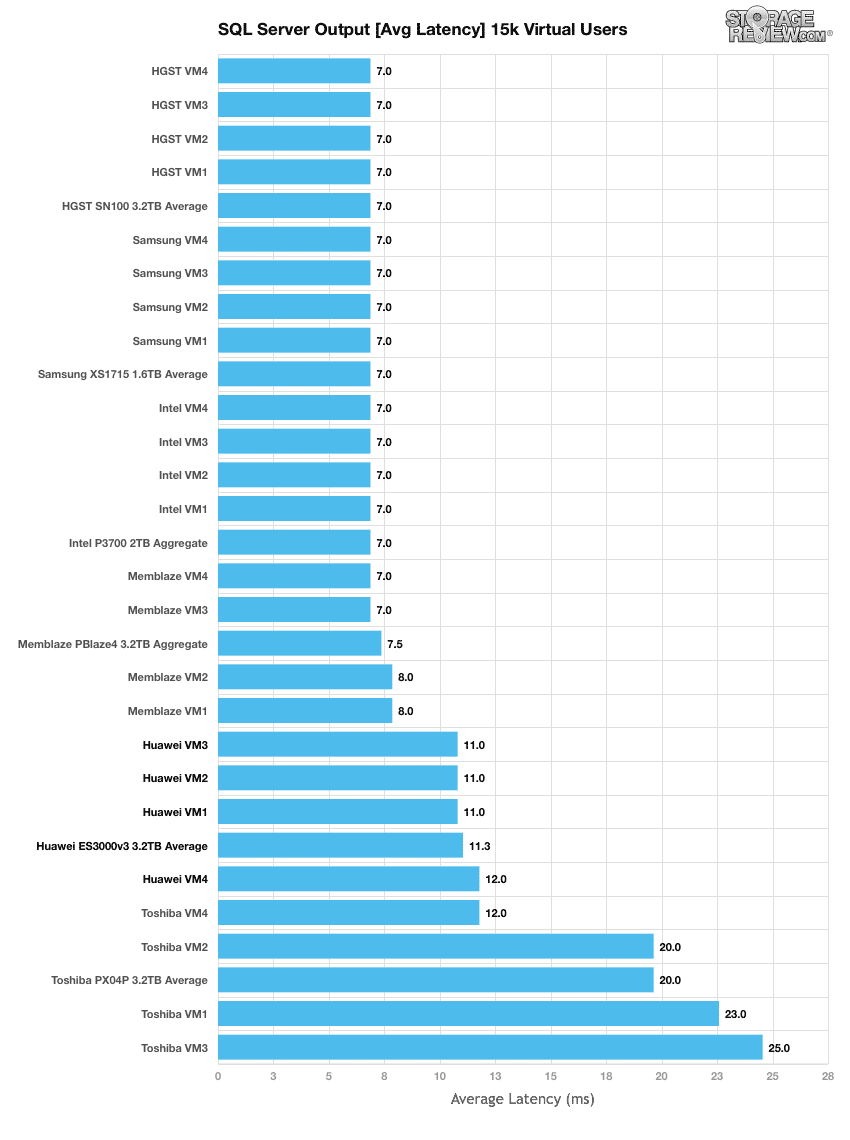
StorageReview’s Microsoft SQL Server OLTP testing protocol employs the current draft of the Transaction Processing Performance Council’s Benchmark C (TPC-C), an online transaction processing benchmark that simulates the activities found in complex application environments. The TPC-C benchmark comes closer than synthetic performance benchmarks to gauging the performance strengths and bottlenecks of storage infrastructure in database environments. Each instance of our SQL Server VM for this review uses a 333GB (1,500 scale) SQL Server database and measures the transactional performance and latency under a load of 15,000 virtual users.
When looking at SQL Server Output, all the drives tested pulled similar performance but the Huawei landed near the bottom of the pack only beating out the Toshiba PX04P. The individual VMs of the Huawei drive range between 3,154.22 TPS to 3,154.83 TPS with an aggregate score of 12,618.22 TPS.
Average latency results during the 15k user SQL Server benchmark once again showed the Huawei drive near the bottom of the pack only beating out the Toshiba. It should be noted that the Huawei drive had individual VM latencies of 11 to 12ms with an average of 11.25ms it was significantly lower than the Toshiba drive.
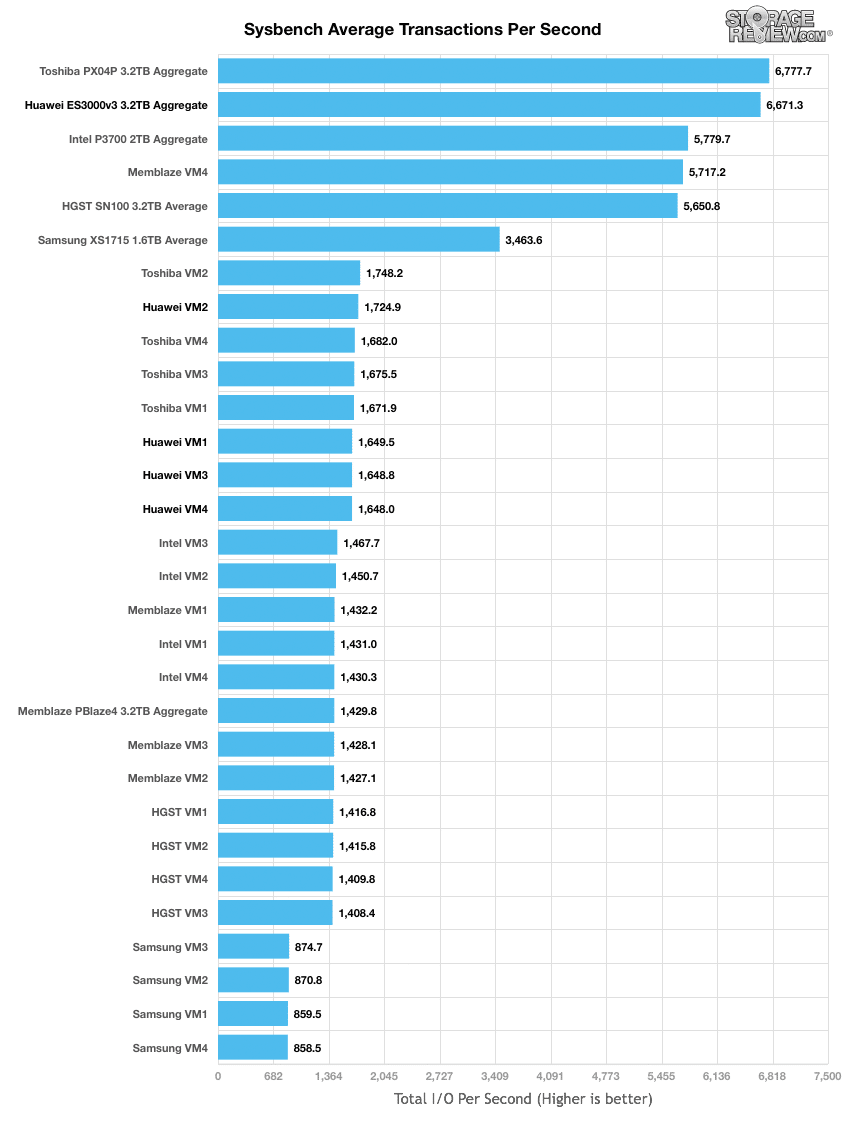
The next application benchmark consists of a Percona MySQL OLTP database measured via SysBench. This test measures average TPS (Transactions Per Second), average latency, as well as average 99th percentile latency. Percona and MariaDB are using the Fusion-io flash-aware application APIs in the most recent releases of their databases; however for the purposes of this comparison we test each device in their "legacy" block-storage modes.
In the average transactions per second benchmark, the Huawei drive flipped the script and instead of being second to last it was second overall. Individual VMs ranged from 1,648.04 TPS to 1,724.87 TPS with an aggregate score of 6,671.29 TPS.
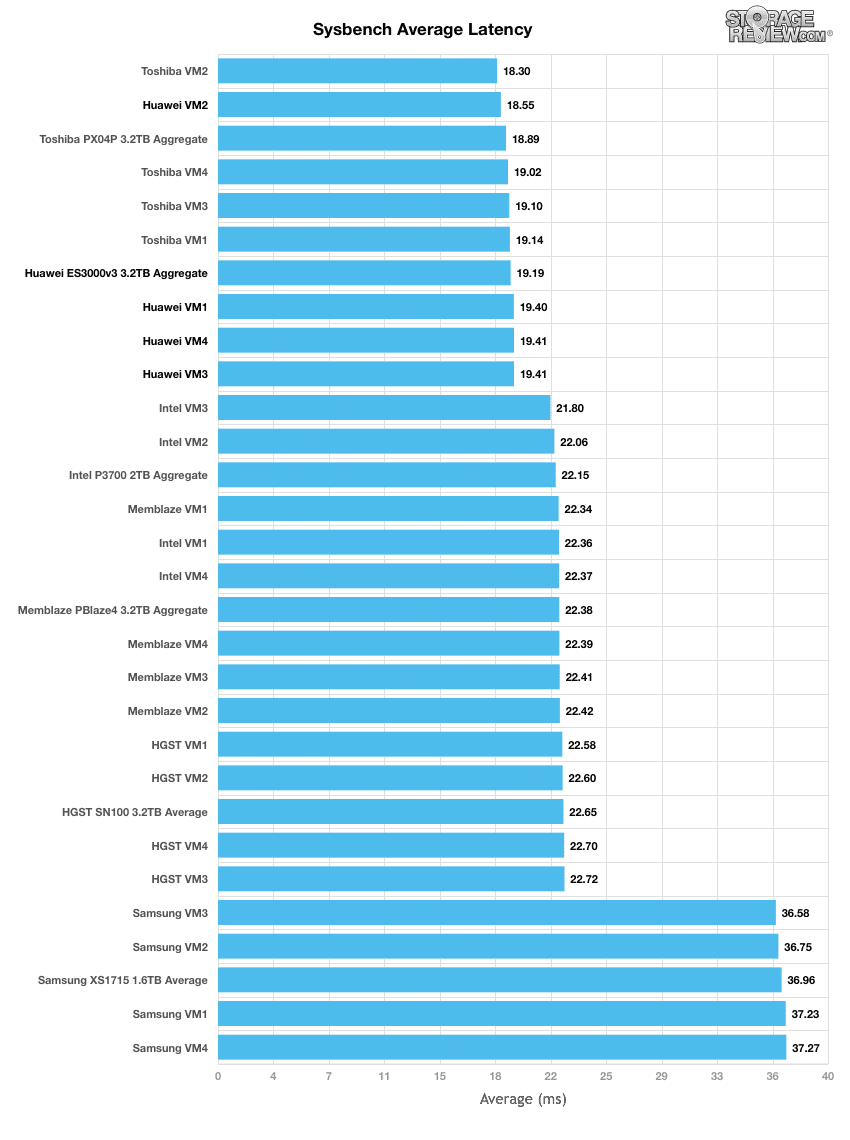
In average latency the Huawei comes in send here giving the top performer a run for its money with individual VMs showing a latency ranging from 18.55ms to 19.41ms with an average score of 19.19ms.
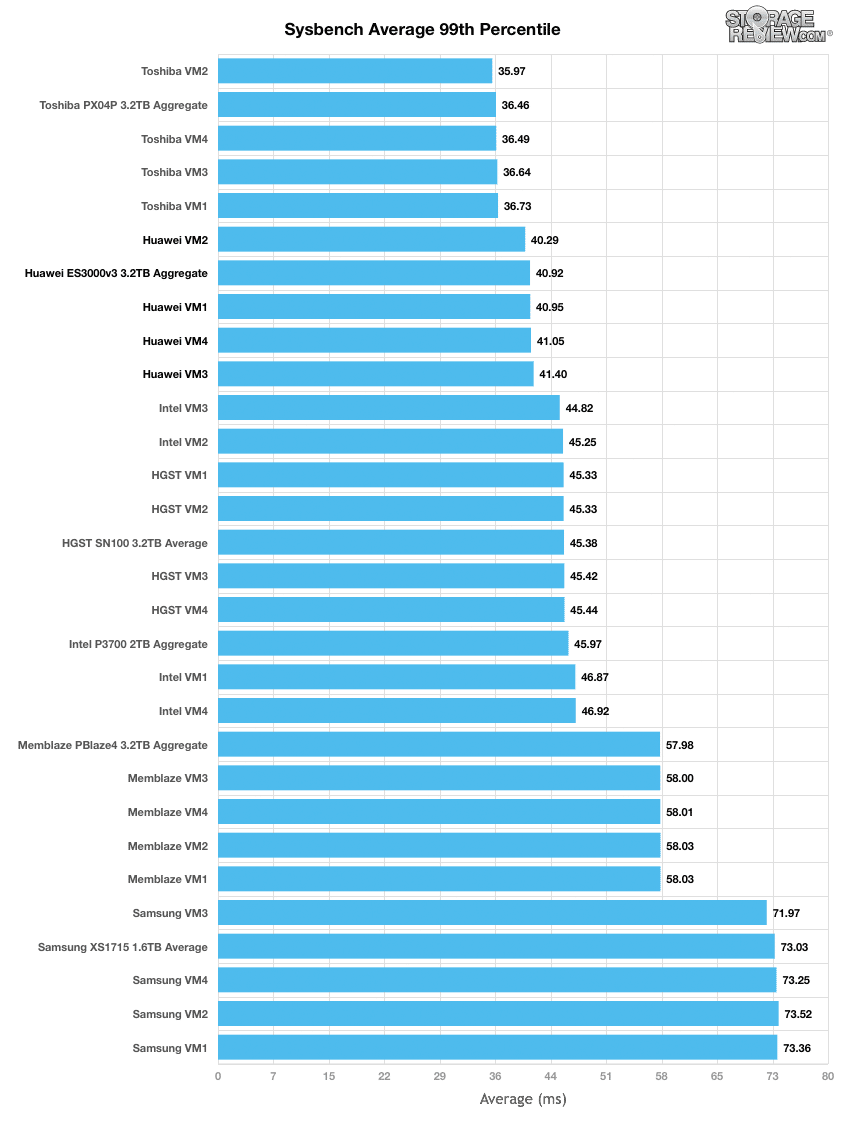
In terms of our worst-case MySQL latency scenario (99th percentile latency), the Huawei once again offers a strong performance placing it in second overall. The Huawei had individual VMs with latency between 40.3ms to 41.4ms and an average score of 40.92ms.
Enterprise Synthetic Workload Analysis
Flash performance varies as the drive becomes conditioned to its workload, meaning that flash storage must be preconditioned before each of the fio synthetic benchmarks in order to ensure that the benchmarks are accurate. Each of the comparable drives are preconditioned into steady-state with a heavy load of 16 threads and an outstanding queue of 16 per thread.
Preconditioning and Primary Steady-State Tests:
- Throughput (Read+Write IOPS Aggregate)
- Average Latency (Read+Write Latency Averaged Together)
- Max Latency (Peak Read or Write Latency)
- Latency Standard Deviation (Read+Write Standard Deviation Averaged Together)
Once preconditioning is complete, each device is then tested in intervals across multiple thread/queue depth profiles to show performance under light and heavy usage. Our synthetic workload analysis for the Huawei ES3600v3 uses two profiles, which are widely used in manufacturer specifications and benchmarks. It is important to take into consideration that synthetic workloads will never 100% represent the activity seen in production workloads, and in some ways inaccurately portray a drive in scenarios that wouldn't occur in the real world.
- 4k
- 100% Read and 100% Write
- 8k
- 70% Read/30% Write
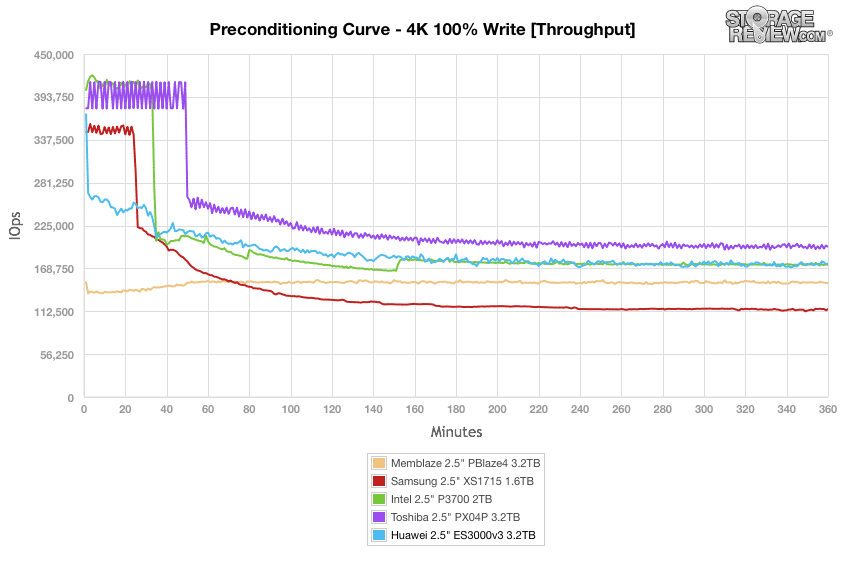
In our throughput 4k write preconditioning test, the Huawei drive started off strong and battle with the Intel drive for second finishing in a steady state around 175K IOPS.
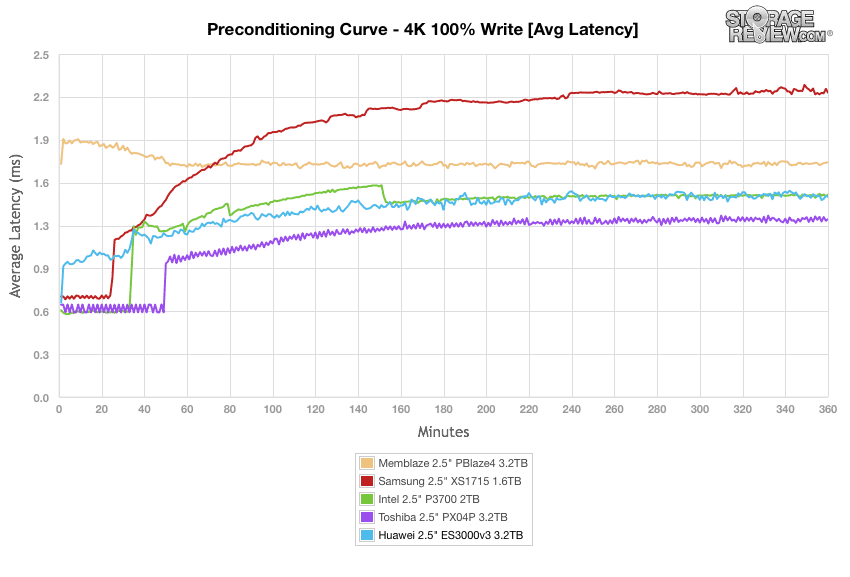
Average latency 4k reconditioning saw the Huawei once again run neck and neck with the Intel drive. Huawei started under 1ms and by the time it finished in a steady state it was hovering around 1.44ms, slightly better than the Intel.
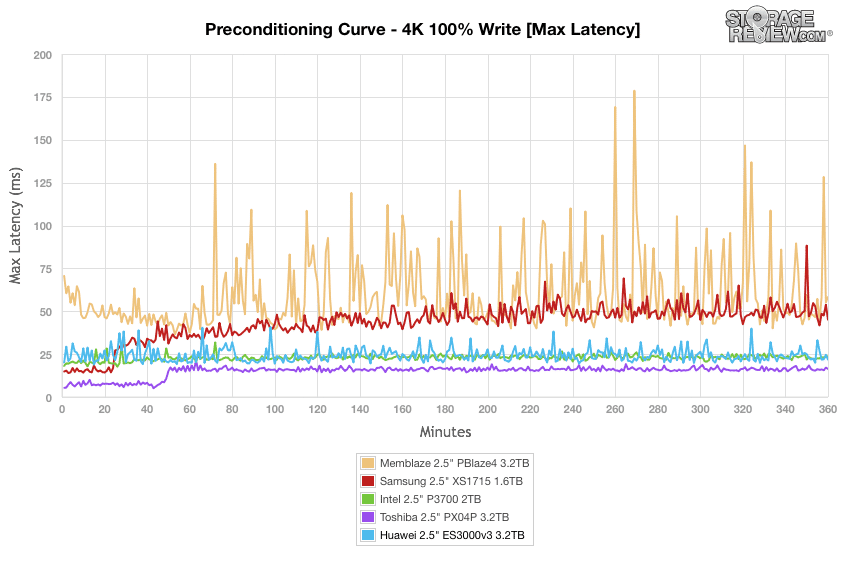
Preconditioning max latency was similar in terms of placement to the above. While the Intel and Huawei competed once more for second place the Huawei was less consistent throughout the benchmark. The Huawei drive finished in second just under 22ms.
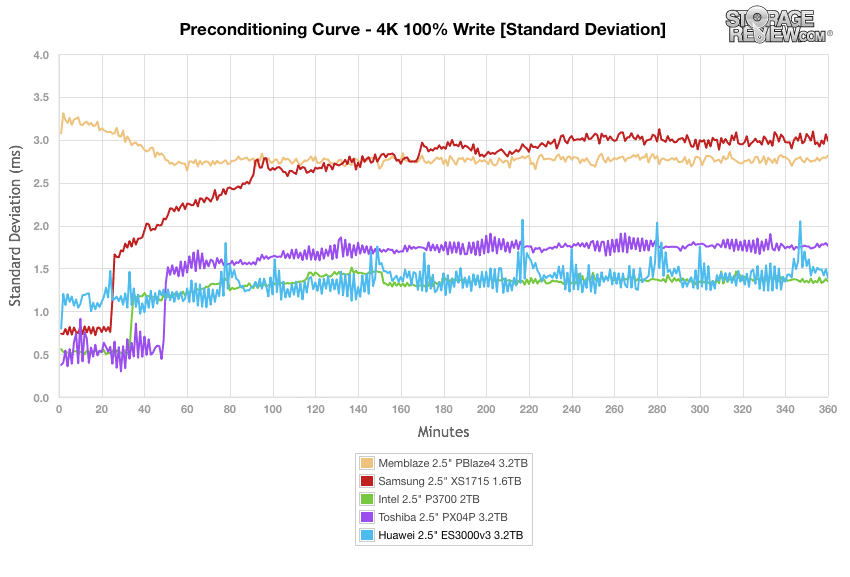
Standard deviation saw the Intel and Huawei drives take the competition from battling for second to battling for first.
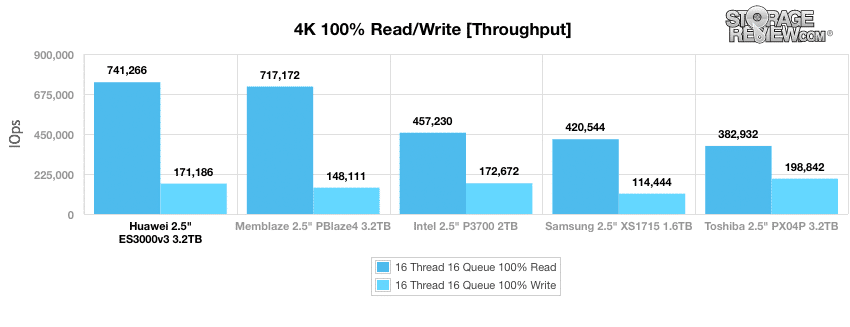
Once the drives are preconditioned into a steady state, we switch over to our main 4k synthetic benchmarks. In 4k throughput, the Huawei drive had the best read performance with 741,266 IOPS. With write performance the Huawei drive came in second with 171,186 IOPS.
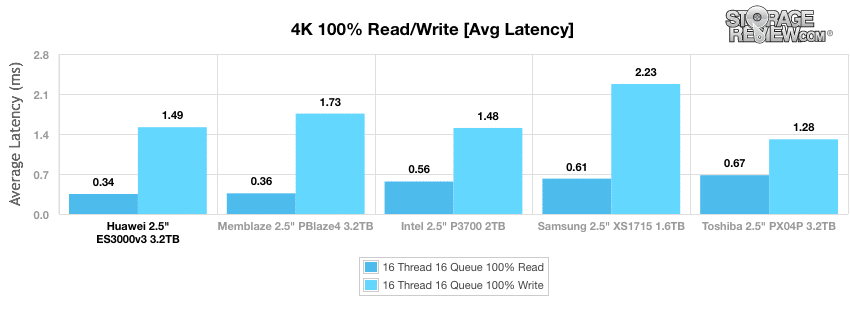
Looking at average latency, the Huawei was able to edge out the Memblaze to take the top spot on reads with 0.344ms. With writes Intel was able to barely nudge the Huawei out of the top spot with the drive finishing second with 1.492ms.
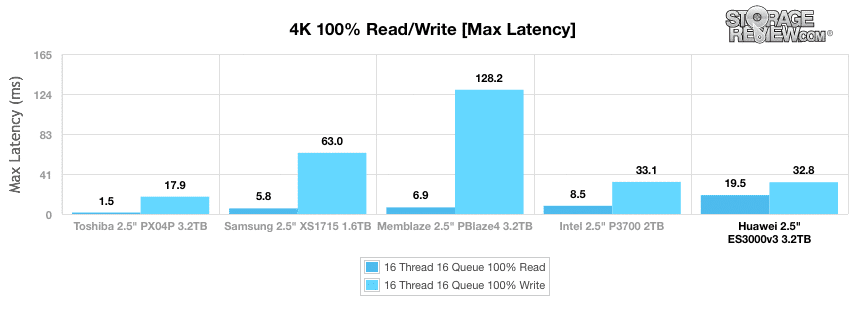
Max latency showed the Huawei drive falter a bit. With read latency the Huawei had the highest overall at 19.46ms, twice that of the next closest drive. With write latency the Huawei came in second place with a latency of 32.81ms.
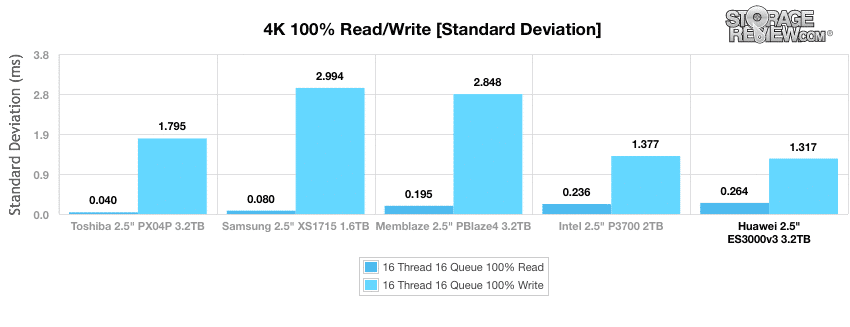
Standard deviation gave us similar results to the above. The Huawei once again had the highest read latency at 0.264ms but had the best write latency at 1.32ms.
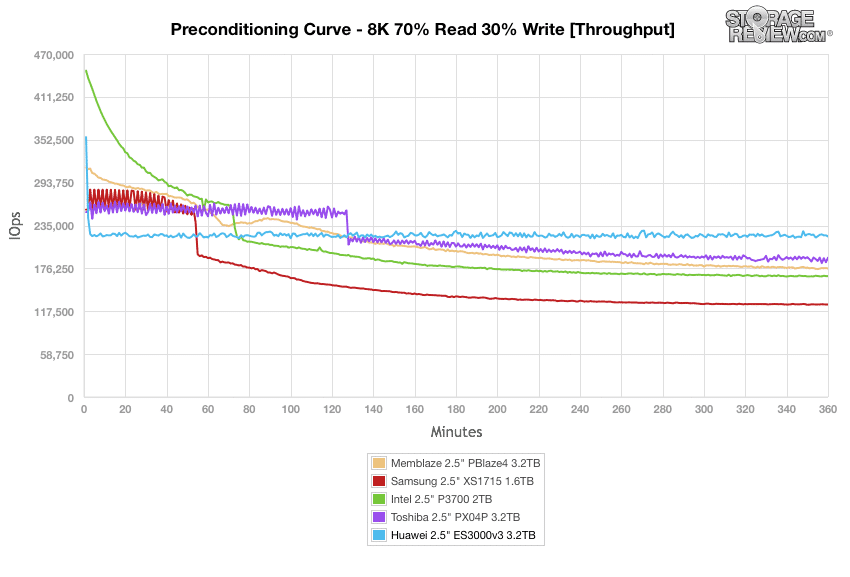
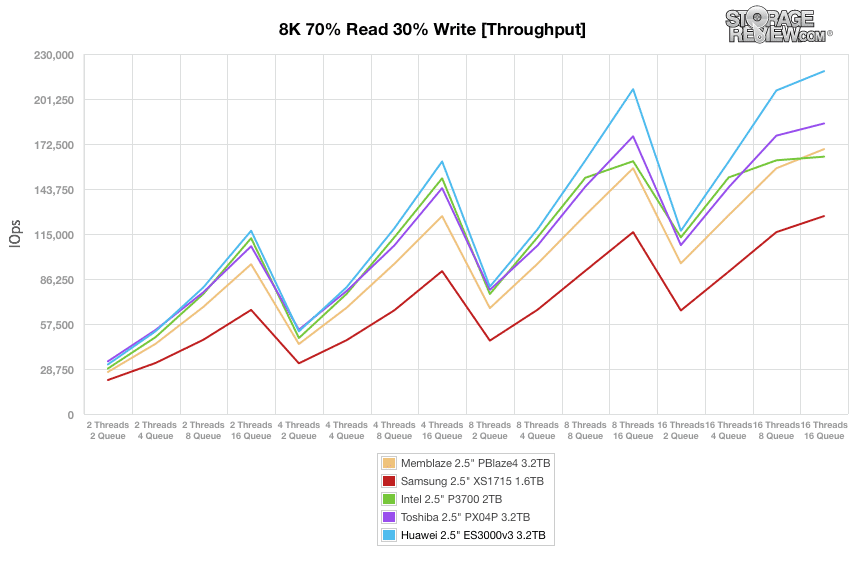
Our next workload uses 8k transfers with a ratio of 70% read operations and 30% write operations. Again, we will start off with the preconditioning results before switching to the main tests. In throughput, the Huawei drive started off strong and surpassed all of the other drives finishing out around 220K IOPS.
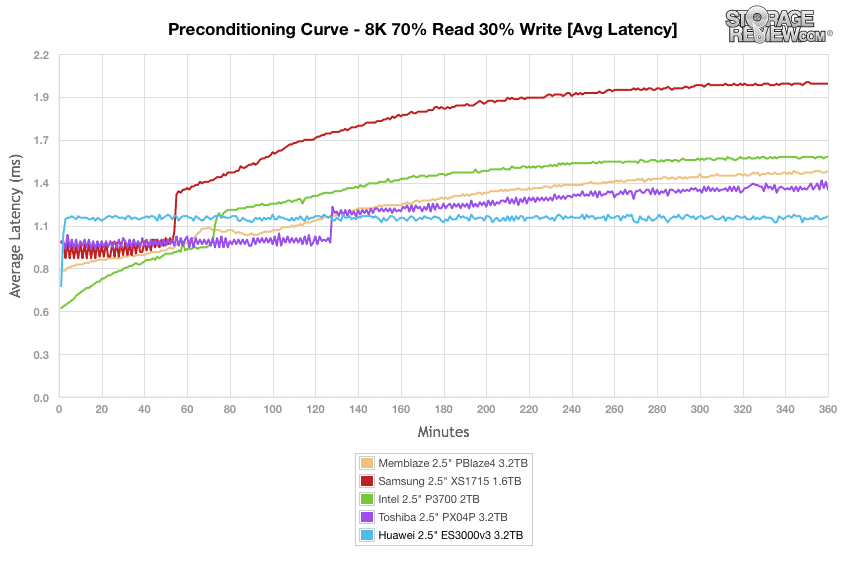
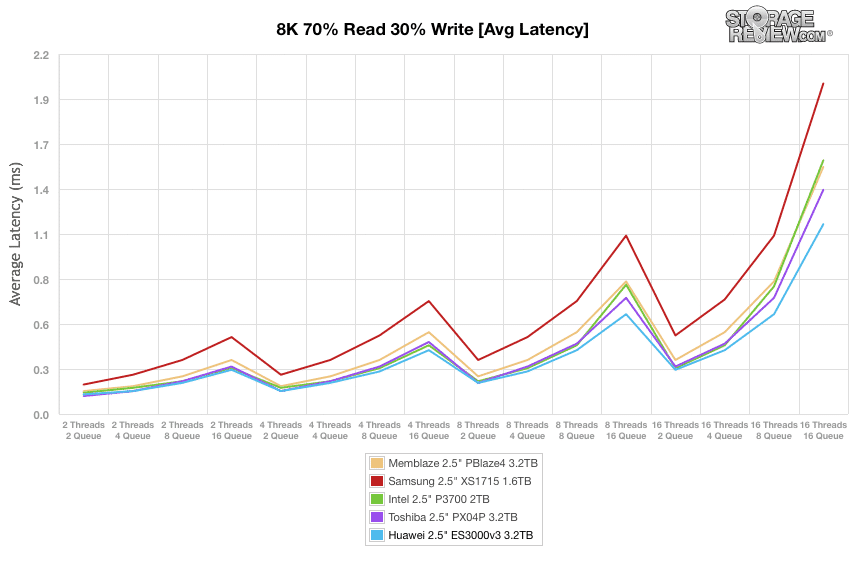
Average latency showed a similar performance from the Huawei. The drive started off strong and easily pulled away from the other drives giving a consistent performance that came to a steady state around 1.15ms.
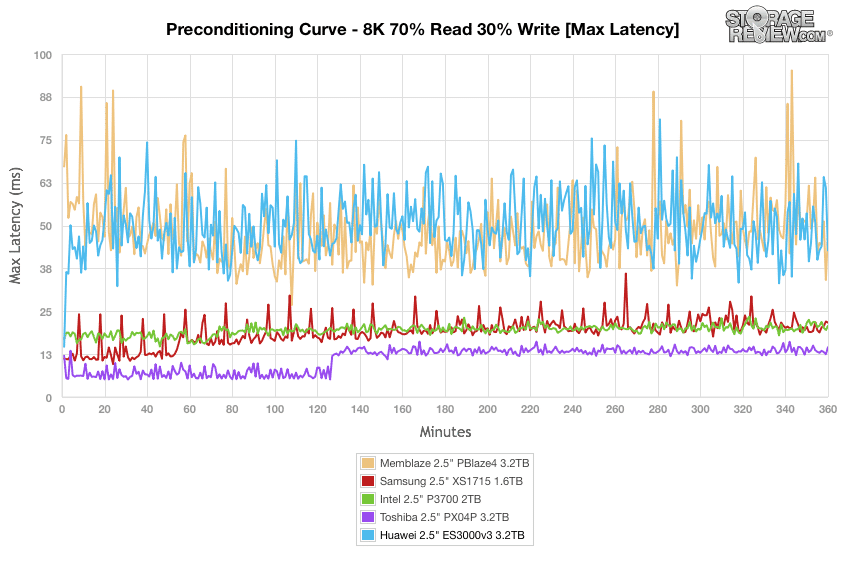
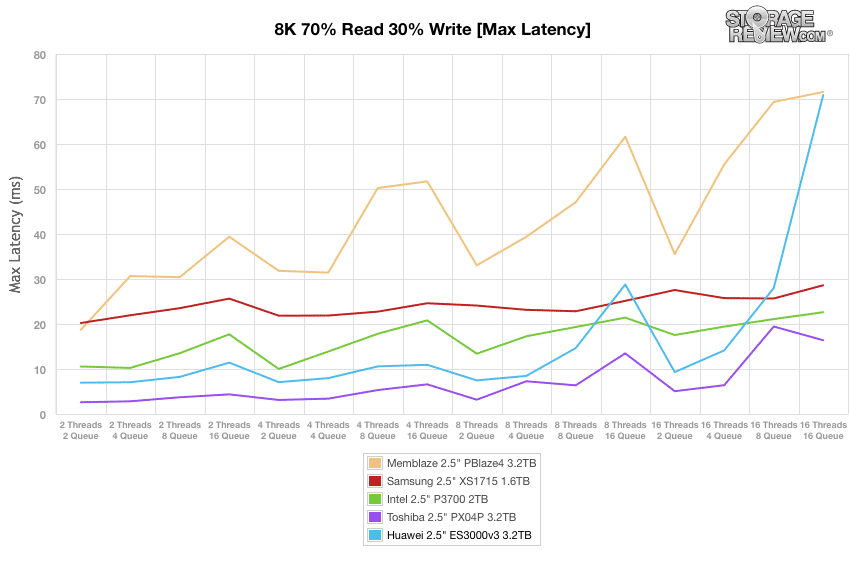
With max latency the Huawei lost its winning streak and shot up to a higher latency near the beginning of the benchmark. The Huawei drive gave an inconsistent performance along with the Memblaze drive before coming in second around 40ms.
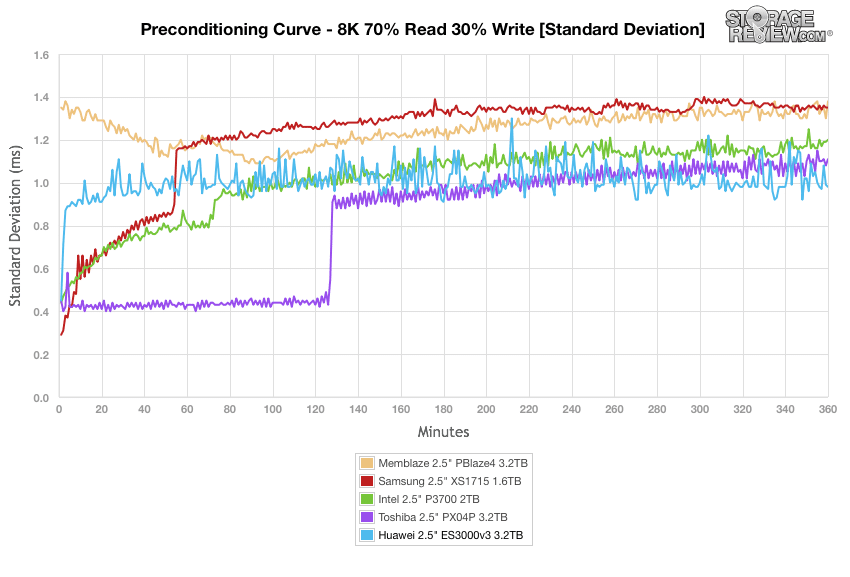
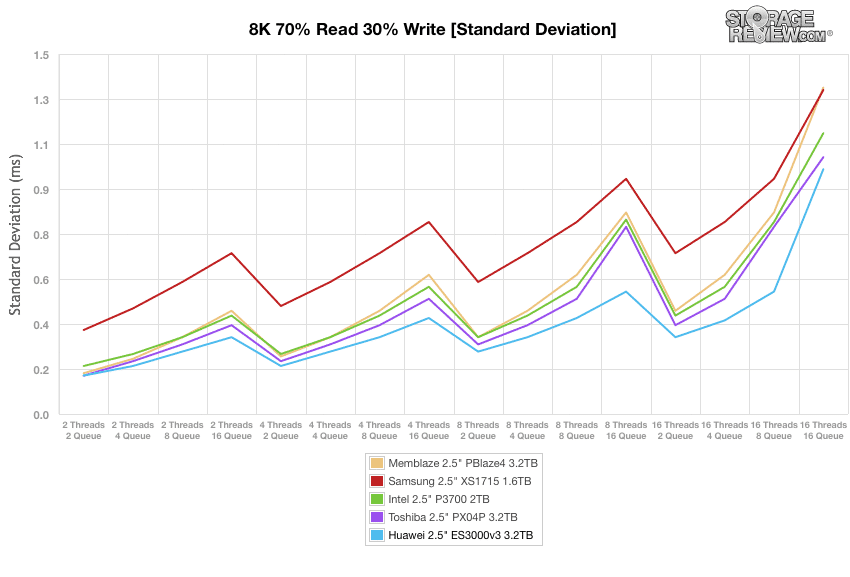
Standard deviation showed another inconsistent performance, however, much better placement. In fact, the Huawei drive finished first at just under 1ms.
After we fully preconditioned the drives, we put them through our main 8k 70/30 test. In throughput, the Huawei drive gave a strong performance from beginning to end. The drive finished in first with 219,039 IOPS.
Average latency gave us similar placement with the Huawei once again giving a strong performance throughout. The drive finished in first place once more with a latency of 1.16ms.
With max latency the Huawei drive started out with one of the lower latencies of he bunch. It stayed in second until near the very end of the test when it shot up to second to last place, finishing with a latency of 70.9ms.
With standard deviation, the Huawei drive had the overall best performance from beginning to end.
Conclusion
The ES3000 v3 series marks Huawei’s first entry into the NVMe field. They offer the drive in both a 2.5” hot-swappable form factor as well as a HHHL AIC. The drive is also offered in a variety of capacities ranging from 1.2TB up to 3.2TB and in two endurance versions, 1DWPD and 3DWPD. While the drive can be used to accelerate the performance of several applications it can also used for caching hot data.
Looking at performance, the Huawei drive ran a bit on the low end of our SQL Server benchmark with an average latency of 11.3ms. However, looking at the bigger picture of SQL Server, 11.3ms aggregate average latency is still a good number, much stronger than Toshiba’s 20ms and only 4.3ms slower than the top performer. With Sysbench the drive performed much better, beating out all other drives expect for the Toshiba, and it ran right behind the top performer in each test with an aggregate average TPS of 6,671.3, an average latency of 19.19ms, and a worst-case scenario latency of 40.92ms (compared to the top worst-case scenario of 36.46ms). The Huawei drive showed much stronger performance in our synthetic test with scores as high as 741,266 IOPS in 4k read, an average 4k read latency as low as 0.34ms, and top performance in our 8k 70R/30W benchmarks expect for max latency.
Overall the ES3000 v3 SSD is a very good first NVMe showing for Huawei in this class. It would be nice to see a drive with more capacity and the SQL Server performance is being worked on, but in total, the drive does a good job and keeps performance consistent. The transition from their first and second-generation ES3000 to the third marks a progression towards higher levels of compatibility, as well as the 2.5" form-factor as an option. While the first two generations required supplied drivers for different OS environments, the new NVMe-based model works in any system with native NVMe support. That opens up the door to more servers, not to mention 2.5" slot-support for the latest-generation of servers.
Pros
- Variety of form factors, capacities, and endurance
- Good Sysbench scores
- Strong synthetic performance
Cons
- Lower SQL Server latency scores
- Capacity tops out at 3.2TB
The Bottom Line
Huawei’s first enterprise NVMe SSD, the ES3000 v3 Series, offers broad compatibility and solid performance to suit latency sensitive application needs.


 Amazon