

The Huawei Tecal ES3000 is a family of full-height half-length enterprise application accelerators that leverage MLC NAND in capacities up to 2.4TB and PCIe interface (2.0 x8). On the surface the Huawei cards sound similar to many other products on the market, but a deeper look reveals a unique triple controller design that joins two PCBs together to form an impressive offering. On the top end of the performance scale this means 3.2GB/s max read bandwidth and 2.8GB/s write. From a latency angle, all thee capacities can drive 49µs and write latency of 8µs. The cards have a number of additional features as well including enhanced error checking, power fail protection and mechanisms to drive enhanced endurance over the course of their life.
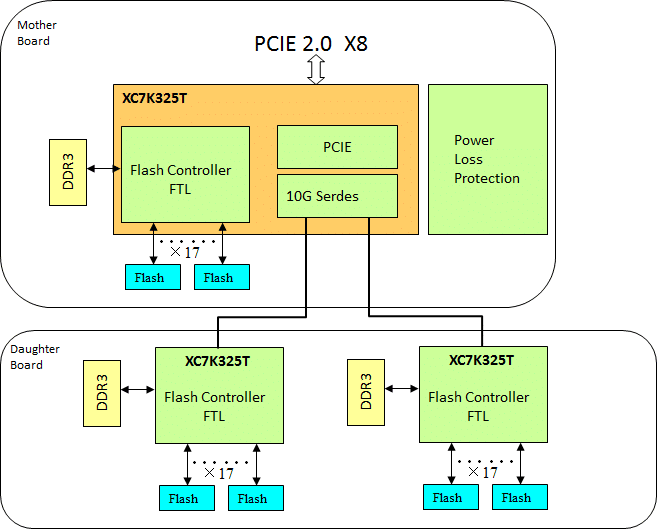
Huawei's solution is truly unique in the market. While most enterprise PCIe application accelerators have a single ASIC or FPGA, and some larger capacity drives have two, the Tecal ES3000 combines three FPGAs across two boards. The main board contains the PCIe interface and a single controller with its pool of NAND, while a daughter board adds the second and third controllers and associated NAND. The drive itself presents to the host as single pool, similar to the Virident solutions, so the user doesn't need to leverage software RAID if they want to utilize the entire available capacity.
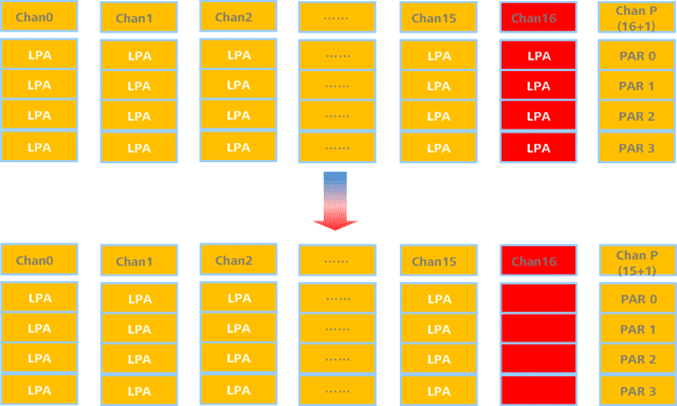
Beyond the innovative hardware design Huawei also has several embedded software features to offer reliable operation over time. In addition to the ECC, Huawei uses their RAID5 engine to correct errors based on channels. Further the dynamic RAID algorithm adjusts on the fly in the event of channel failure because of multiple bad blocks. In normal operation each controller runs in a 16+1 channel configuration, but when one fails it can adjust to 15+1 or 14+1 to maintain operation as the SSD ages and wears. To help drive endurance, the cards use read retry; when data can't be checked and corrected, the controllers check and adjust the flash level on the fly to protect data and is claimed to increase the service life of flash by up to 300%. Lastly, the ES3000 offers an onboard supercap that can provide a discharge time just shy of 1 second, which is roughly 10X greater than the 80ms needed to flush data from buffers in the event of power loss.
The Huawei Tecal ES3000 cards come in 800GB, 1.2TB and 2.4TB capcities. Huawei rates the three capacities with endurance figures of 6.4PB, 9.5PB and 19.1PB written respectively. Our review samples include the 1.2TB and 2.4TB capacity cards.
Huawei Tecal ES3000 Specifications
- Capacities
- 800GB, 1.2TB, 2.4TB
- Performance
- 800GB
- Max read bandwidth: 2.2GB/s
- Read IOPS 4K max: 600,000
- Read IOPS 4K steady: 570,000
- Read latency: 49µs
- Max write bandwidth: 1.2GB/s
- Read IOPS 4K max: 330,000
- Read IOPS 4K steady: 120,000
- Write latency: 8µs
- Mixed IOPS 70/30 R/W 4K: 260,000
- Endurance: 6.4PB
- 1.2TB
- Max read bandwidth: 3.2GB/s
- Read IOPS 4K max: 770,000
- Read IOPS 4K steady: 760,000
- Read latency: 49µs
- Max write bandwidth: 1.8GB/s
- Read IOPS 4K max: 480,000
- Read IOPS 4K steady: 180,000
- Write latency: 8µs
- Mixed IOPS 70/30 R/W 4K: 400,000
- Endurance: 9.5PB
- 2.4TB
- Max read bandwidth: 3.2GB/s
- Read IOPS 4K max: 770,000
- Read IOPS 4K steady: 760,000
- Read latency: 49µs
- Max write bandwidth: 2.8GB/s
- Read IOPS 4K max: 630,000
- Read IOPS 4K steady: 240,000
- Write latency: 8µs
- Mixed IOPS 70/30 R/W 4K: 430,000
- Endurance: 19.1PB
- 800GB
- Form Factor: FHHL
- Bus: PCIe 2.0 x8
- Power Consumption
- 800GB: 20-35W
- 1.2TB: 25-50W
- 2.4TB: 25-60W
- Operating Temp: 0-55°C
- Airflow: 1.5m/s (300LFM)
- Power Consumption: 20-35W (800GB), 25-50W (1.2TB), 25-60W (2.4TB)
- Supported Operating Systems
- MS Windows Server 2003 SP2/2008 R2 64-bit
- RHEL 5.0/5.1/5.2/5.3/5.4/5.5/5.6/5.7/5.8 64-bit
- RHEL 6.0/6.1/6.2/6.3 64-bit
- SLES 11 SP1/SP2 64-bit
- CentOS 5/6
- Ubuntu 10/11
- VMware ESX 4.1/ ESXi 5.0
Video Overview
Design and Build
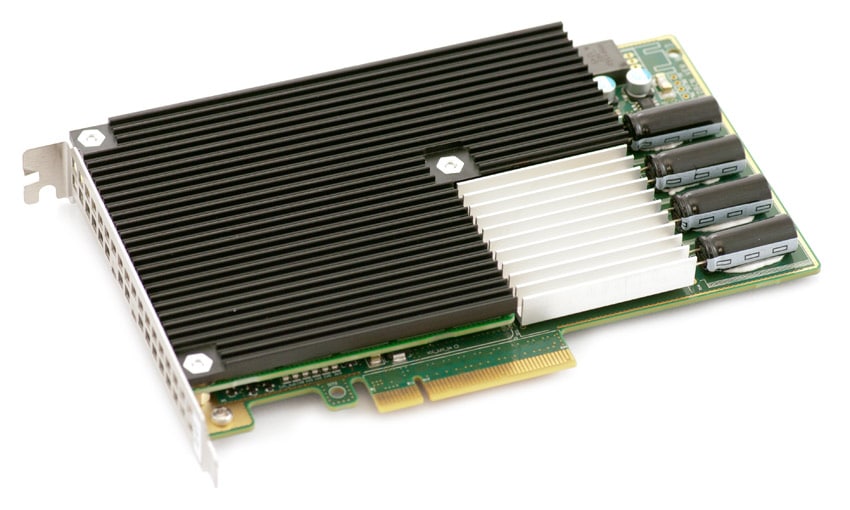
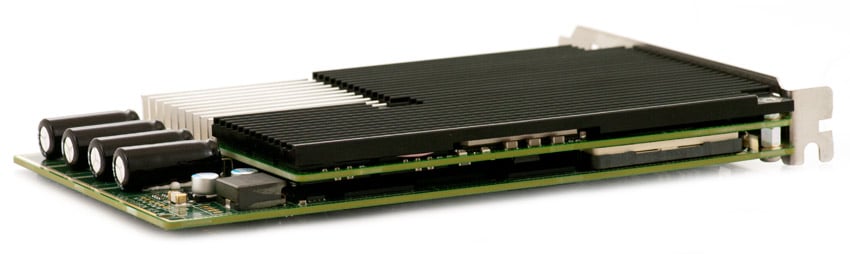
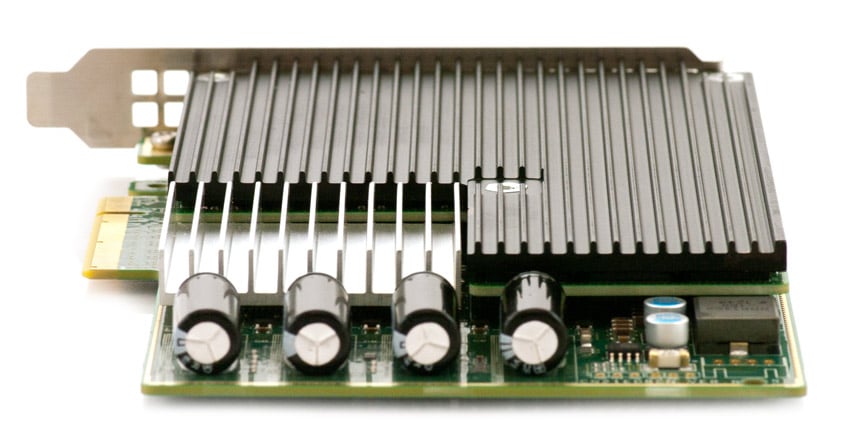
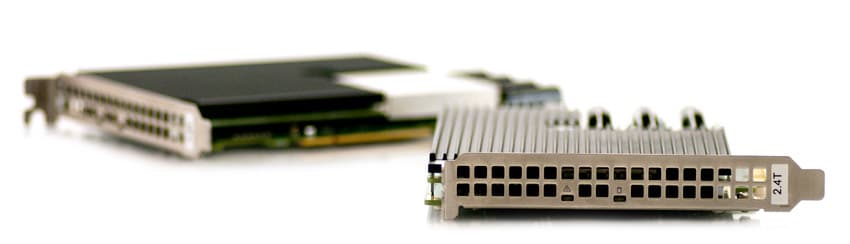
The Huawei Tecal ES3000 ships in both 1.2TB and 2.4TB offerings as a Full-Height Half-Length (FHHL) x8 PCI-Express 2.0 card. Uniquely, Huawei has implemented a three FPGA controller configuration in which one controller is attached directly to the main board and two controllers are attached to a daughter board. The top of the device has very prominent features. On the right side are four large power-fail capacitors to protect in-flight data in case of power loss. The rest of the board is predominantly covered by two heatsinks. The larger of the two, the black heatsink, covers the daughter board, passively cooling the components to protect them from overheating.
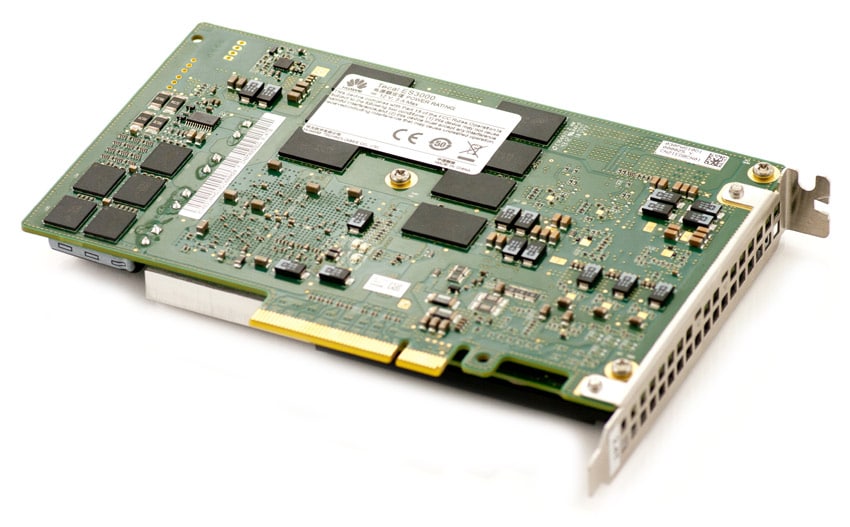
As noted above, there are three controllers on the Huawei Tecal ES3000, each with its own DRAM and NAND pool. Our test ES3000 features Micron MLC NAND, though Huawei is NAND manufacturer agnostic. As far as the build quality goes, the Huawei Tecal ES3000 feels fortified and able to withstand most any environment in which it'll be installed.
While the Tecal ES3000 PCIe SSDs draw upwards of 60W depending on the capacity, all power is pulled in through the PCIe slot, with no external power attachment required.
One final note centers on the form factor. The Huawei Tecal ES3000 is a FHHL form factor application accelerator. Two of the comparables that we are testing it against are Half-Height Half-Length (HHHL) cards, enabling them to "fit" even more applications due to their smaller size. Those cards are the Micron P320h 700GB SLC and the Virident FlashMAX II 2.2TB.
Testing Background and Comparables
The Huawei Tecal ES3000 uses three proprietary FPGA controllers and MLC NAND with a PCIe 2.0 x8 interface. Throughout this review, we show "stock" performance at advertised capacity, as well as "high-performance" data with the PCIe SSD over-provisioned to 80% of its advertised capacity. Synthetic benchmarks show stock and HP data, while all application benchmarks are gathered with the drive over-provisioned.
Comparables for this review:
- Fusion-io ioDrive2 Duo (1.2TB, 2 x Xilinx Virtex-6 FPGA controllers, SLC NAND, PCIe 2.0 x4)
- LSI Nytro WarpDrive BLP4-400 (400GB, SandForce SF-2500 controller, Toshiba eMLC NAND, PCIe 2.0 x8)
- Micron P320h (700GB, IDT Controller, SLC NAND, PCIe 2.0 x8)
- Virident FlashMAX II (2.2TB, 2 x Proprietary FPGA controllers, eMLC NAND, PCIe 2.0 x8)
All PCIe Application Accelerators are benchmarked on our second-generation enterprise testing platform based on a Lenovo ThinkServer RD630. For synthetic benchmarks, we utilize FIO version 2.0.10 for Linux and version 2.0.12.2 for Windows. Since the Huawei Tecal ES3000 leverages host-side resources, faster server clock speeds allow it to yield higher performance. In our synthetic testing environment, we use a mainstream server configuration with a clock speed of 2.0GHz, although server configurations with more powerful processors could yield even greater performance.
- 2 x Intel Xeon E5-2620 (2.0GHz, 15MB Cache, 6-cores)
- Intel C602 Chipset
- Memory – 16GB (2 x 8GB) 1333Mhz DDR3 Registered RDIMMs
- Windows Server 2008 R2 SP1 64-bit, Windows Server 2012 Standard, CentOS 6.3 64-Bit
- 100GB Micron RealSSD P400e Boot SSD
- LSI 9211-4i SAS/SATA 6.0Gb/s HBA (For boot SSDs)
- LSI 9207-8i SAS/SATA 6.0Gb/s HBA (For benchmarking SSDs or HDDs)
Application Performance Analysis
In the enterprise market there is a huge difference between how products claim to perform on paper and how they perform in a production environment. We understand the importance of evaluating storage as a component of larger systems, most importantly how responsive storage is when interacting with key enterprise applications. To this end, we've rolled out our first application tests including our proprietary MarkLogic NoSQL Database Storage Benchmark and MySQL performance via SysBench.
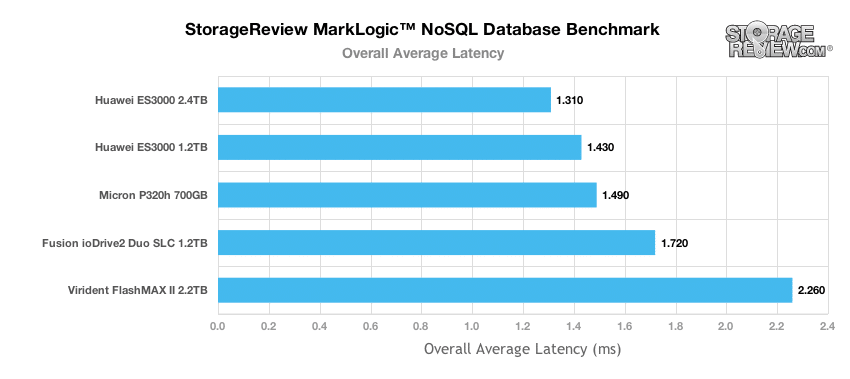
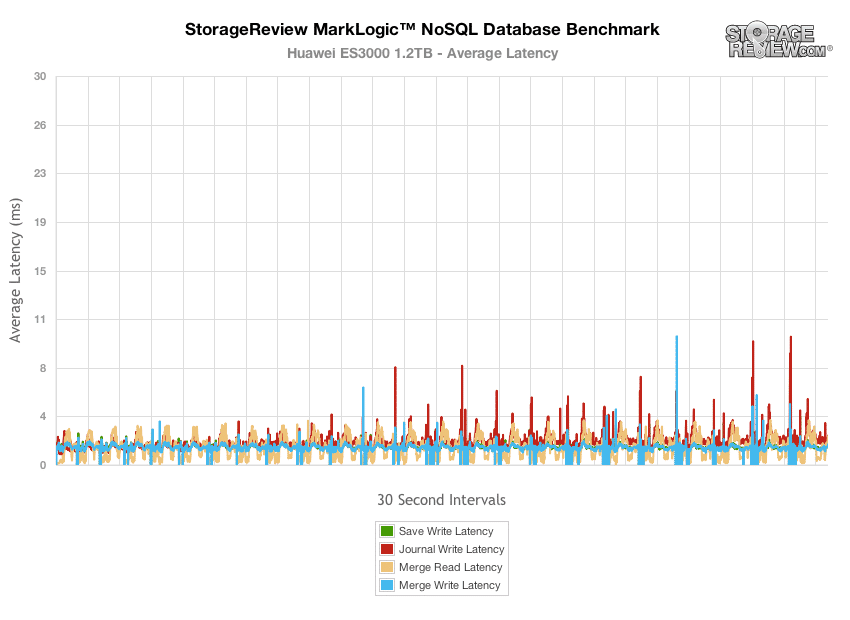
In our MarkLogic NoSQL Database environment, we test groups of four SATA or SAS SSDs against single PCIe Application Accelerators with a usable capacity greater than or equal to 200GB. Our NoSQL database requires roughly 650GB of free space to work with, evenly divided between four database nodes. In our testing environment, we use an SCST host and present each individual SSD in JBOD, with one allocated per database node. The test repeats itself over 24 intervals, requiring between 30-36 hours total for the SSDs in this category. Measuring the internal latencies seen by the MarkLogic software, we record both total average latency, as well as interval latency for each SSD.
For our overall average latency ranking in our MarkLogic NoSQL database benchmark, the Huawei Tecal ES3000 in both the 1.2TB and 2.4TB capacities provided the best response times. The ES3000 1.2TB tested at 1.43ms and the 2.4TB marked 1.31ms. The Micron P320h performed with the next best results, but was edged out. Its response time was 1.49ms.
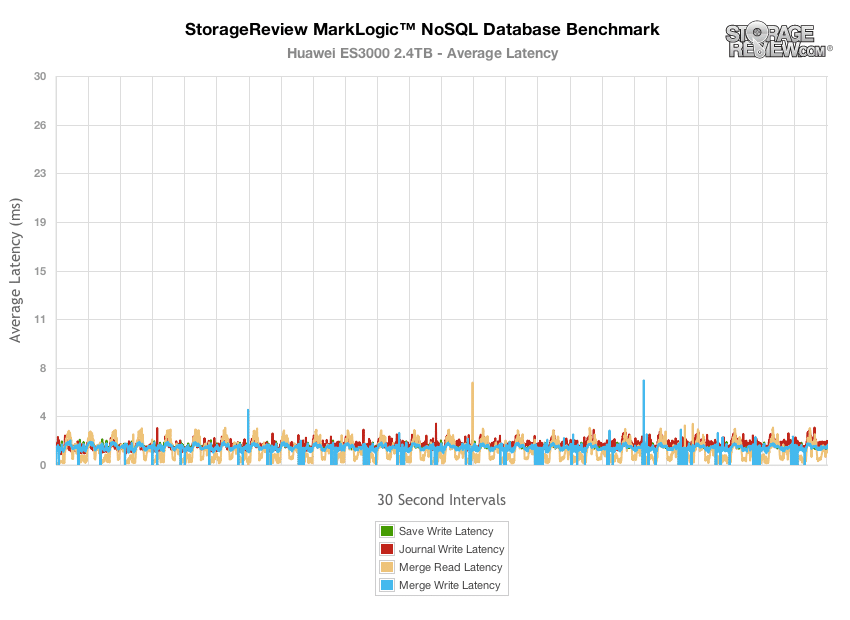
The Huawei ES3000 2.4TB HP offered the best latency in the entire PCIe Application Accelerator group to date, with peaks measuring in the 3-6ms range.
The Huawei ES3000 1.2TB HP offered the next best latency in the group, although peak latency increased slightly to 3.5-9.9ms.
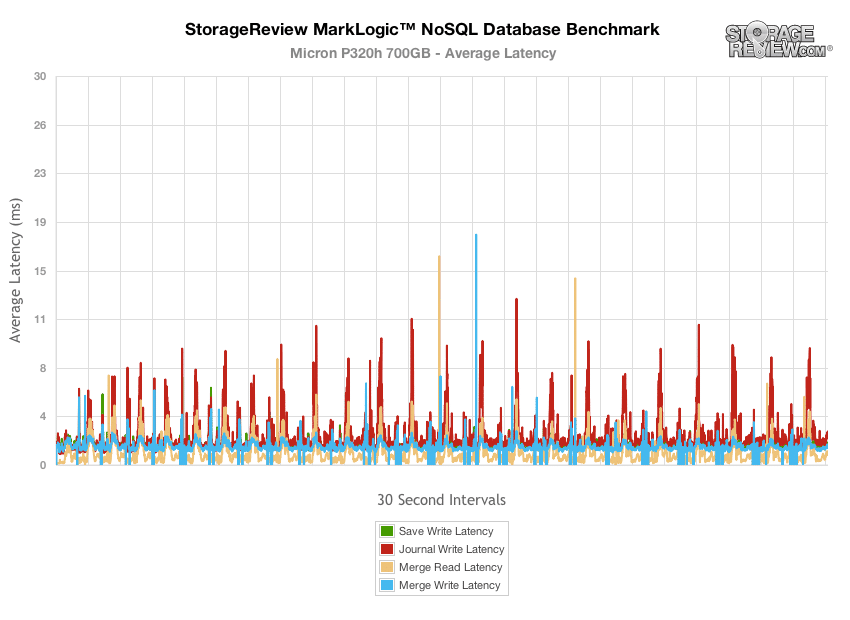
The Micron P320h 700GB HP SLC came in third in the group, with peaks measuring between 12-17.7ms.
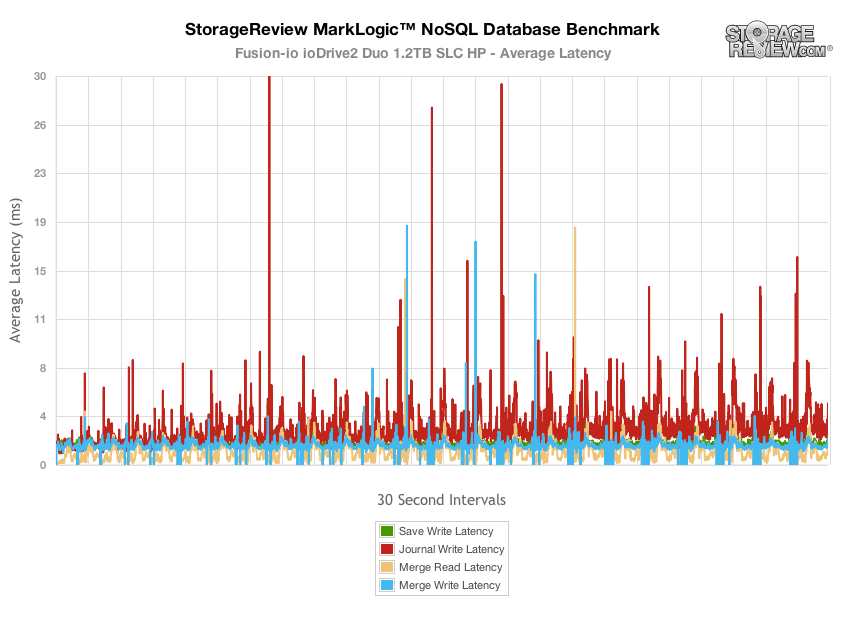
The Fusion-io ioDrive2 Duo 1.2TB SLC HP came in fourth in the group in overall average latency, and drilling into the performance over the course of our test, we noted peaks measuring between 18-31ms.
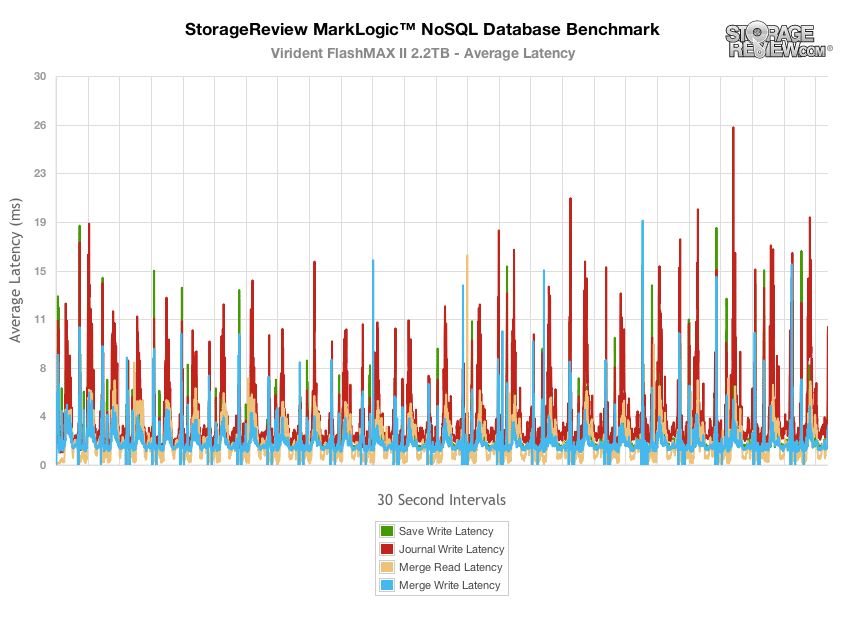
The Virident FlashMAX II 2.2TB HP came in towards the bottom of the pack in our MarkLogic NoSQL test, although it didn't have the highest latency peaks, which measured 16-26ms.
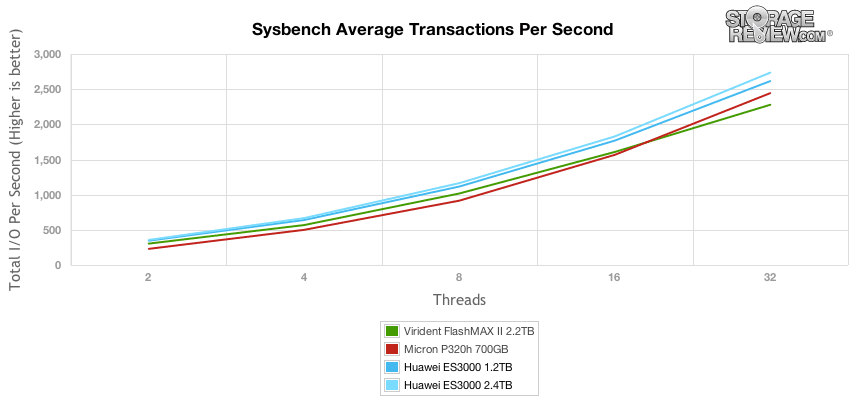
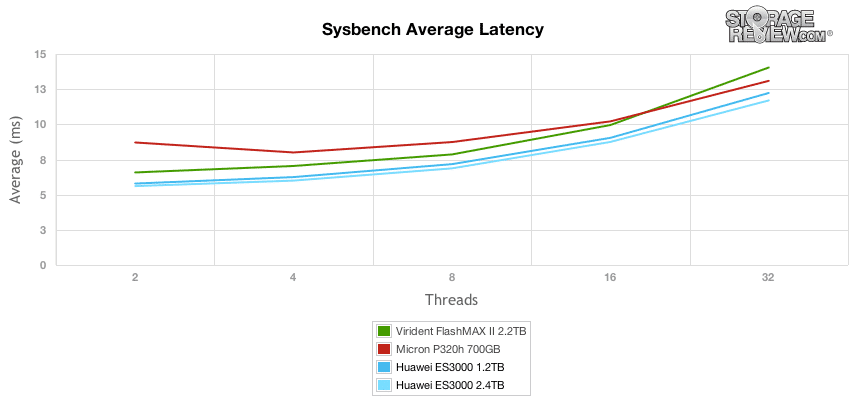
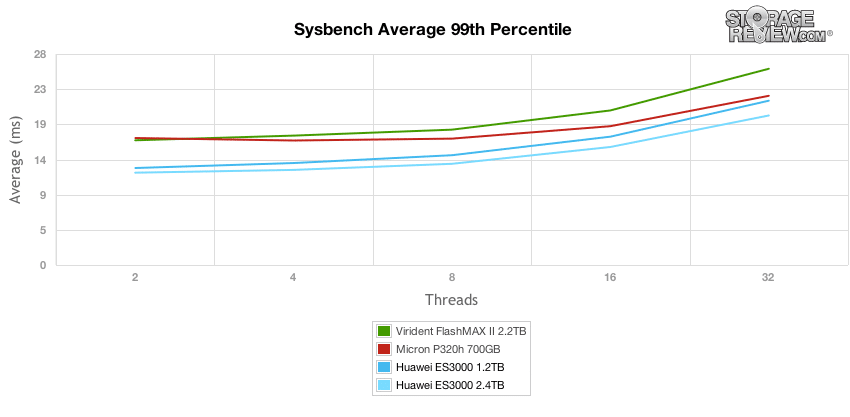
Our next application test consists of Percona MySQL database test via SysBench, which measures the performance of OLTP activity. In this testing configuration, we use a group of Lenovo ThinkServer RD630s and load a database environment onto a single SATA, SAS or PCIe drive. This test measures average TPS (Transactions Per Second), average latency, as well as average 99th percentile latency over a range of 2 to 32 threads. Percona and MariaDB are using the Fusion-io flash-aware application APIs in the most recent releases of their databases, although for the purposes of this comparison we test each device in their "legacy" block-storage modes.
In our SysBench tests, the Huawei Tecal ES3000 1.2TB and 2.4TB provided the greatest level of I/O per second. The ES3000 2.4TB scaled average TPS from around 356 TPS at 2 threads to 2,735 TPS at 32 threads.
Average latency from the Huawei Tecal ES3000 2.4TB in SysBench scaled from 5.61ms at 2 threads to 11.7ms at 32 threads.
Comparing 99th percentile latency in our SysBench test, the Huawei Tecal ES3000 2.4TB again provided the best marks with better latency throughout the test, never eclipsing the 20ms response time threshold. Exact figures scaled from 12.25ms at 2 threads to 19.84ms at 32 threads.
Enterprise Synthetic Workload Analysis
Flash performance varies throughout the preconditioning phase of each storage device. Our synthetic enterprise storage benchmark process begins with an analysis of the way the drive performs during a thorough preconditioning phase. Each of the comparable drives are secure erased using the vendor's tools, preconditioned into steady-state with the same workload the device will be tested with under a heavy load of 16 threads with an outstanding queue of 16 per thread, and then tested in set intervals in multiple thread/queue depth profiles to show performance under light and heavy usage.
Preconditioning and Primary Steady-State Tests:
- Throughput (Read+Write IOPS Aggregate)
- Average Latency (Read+Write Latency Averaged Together)
- Max Latency (Peak Read or Write Latency)
- Latency Standard Deviation (Read+Write Standard Deviation Averaged Together)
Our Enterprise Synthetic Workload Analysis includes two profiles based on real-world tasks. These profiles have been developed to make it easier to compare to our past benchmarks as well as widely-published values such as max 4k read and write speed and 8k 70/30, which is commonly used for enterprise hardware.
- 4k
- 100% Read or 100% Write
- 100% 4k
- fio –filename=/dev/sdx –direct=1 –rw=randrw –refill_buffers –norandommap –randrepeat=0 –ioengine=libaio –bs=4k –rwmixread=100 –iodepth=16 –numjobs=16 –runtime=60 –group_reporting –name=4ktest
- 8k 70/30
- 70% Read, 30% Write
- 100% 8k
- fio –filename=/dev/sdx –direct=1 –rw=randrw –refill_buffers –norandommap –randrepeat=0 –ioengine=libaio –bs=8k –rwmixread=70 –iodepth=16 –numjobs=16 –runtime=60 –group_reporting –name=8k7030test
For the Huawei Tecal ES3000 Application Accelerator, we tested both the 1.2TB and 2.4TB capacities and we tested them each over Linux and Windows. The charts below will show the data from each capacity with each operating system. First, we'll display the 1.2TB and 2.4TB results tested in Linux, and then we'll offer the 1.2TB and 2.4TB Windows results. One additional note is that we utilized the Tecal ES3000's overprovisioning capability for a high performance (HP) testing mode which you'll see in the charts and data, contrasted with the stock results.
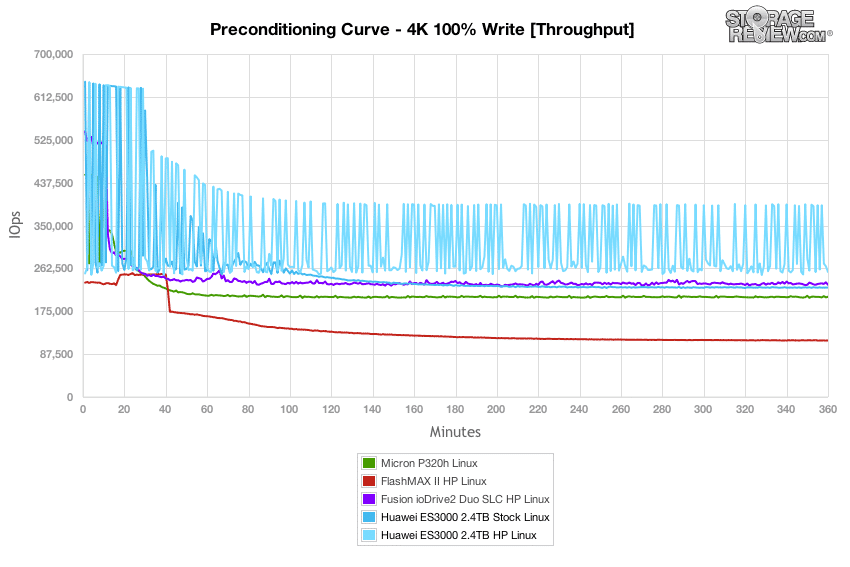
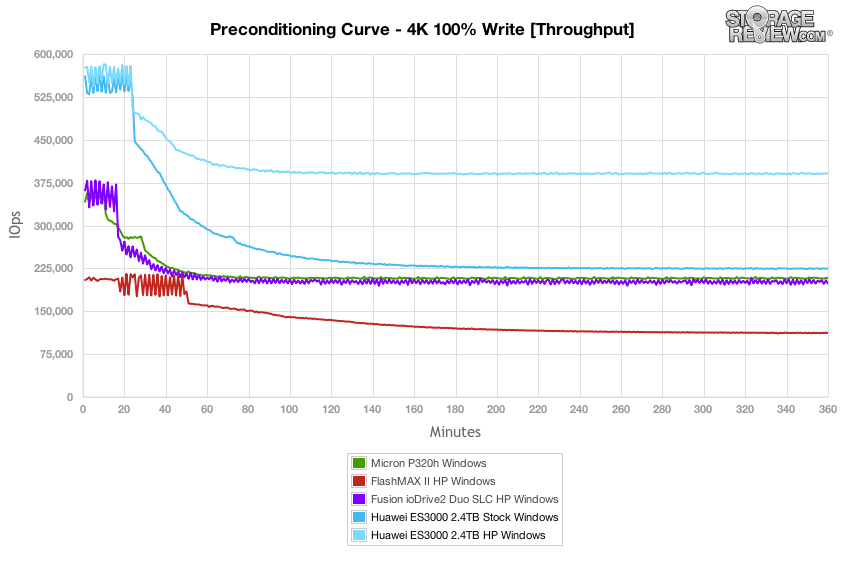
Our first test measures 100% 4k random write performance with a load of 16T/16Q. In this setting, the bursting nature of the Huawei Tecal ES3000 1.2TB Linux tested at 481,000 IOPS which then leveled off near steady-state to a class-best 171,000 IOPS. In the HP mode, the Huawei Tecal ES3000 produced roughly the same burst speeds, but maintained a class-best 260,000-280,000 IOPS in steady-state.
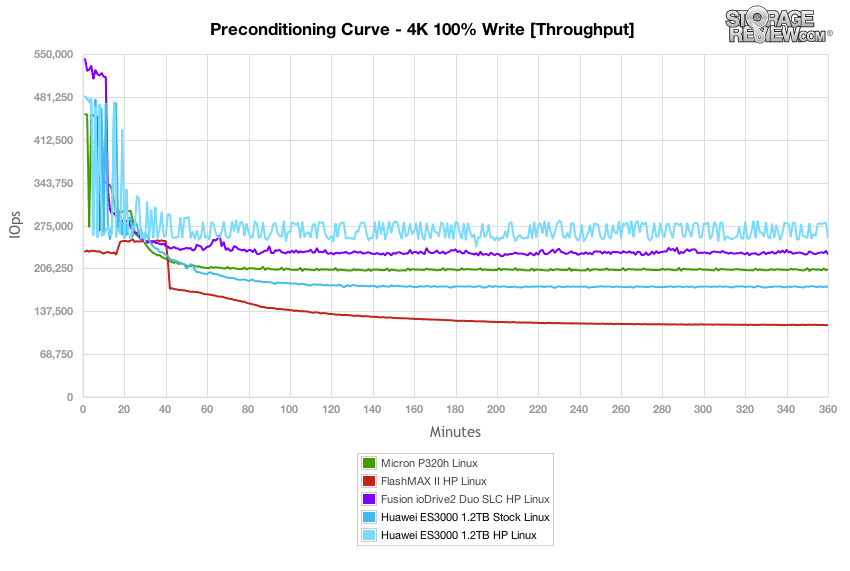
Continuing this testing with the Huawei Tecal ES3000 2.4TB Linux, bursting speeds tested at as high as 640,000 IOPS, though they oscillated around drastically bouncing between the 250,000 and 640,000 IOPS mark. Performance leveled off near steady-state to a class-best 250,000-400,000 IOPS rate for HP mode and 230,000 IOPS in Stock.
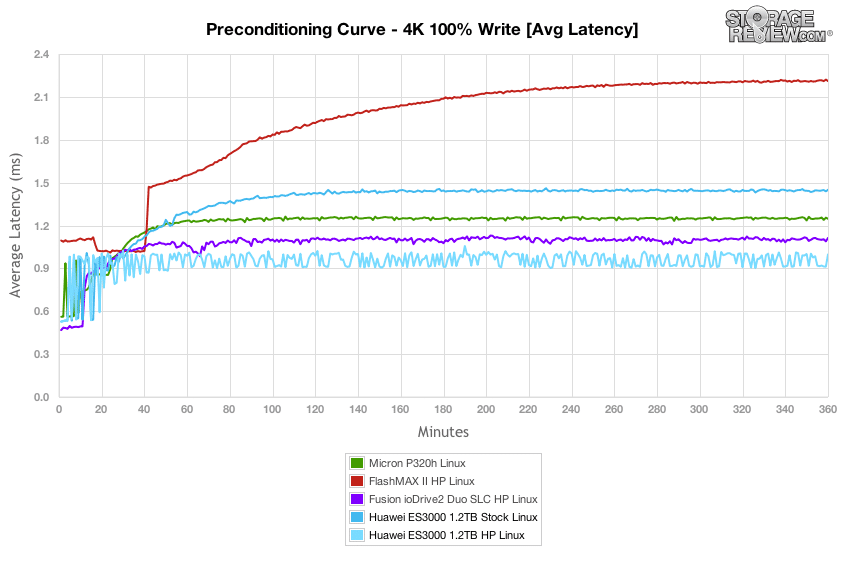
With a heavy 16T/16Q load, the Huawei Tecal ES3000 1.2TB Linux measured 0.53-0.95ms in burst and scaled up to right around 1.4-1.5ms as it neared steady-state. Stock numbers were similar in burst, but in steady-state, the HP mode maintained an average of 1ms. Those HP figures were best in class, while the stock figures only managed to edge the FlashMAX II HP.
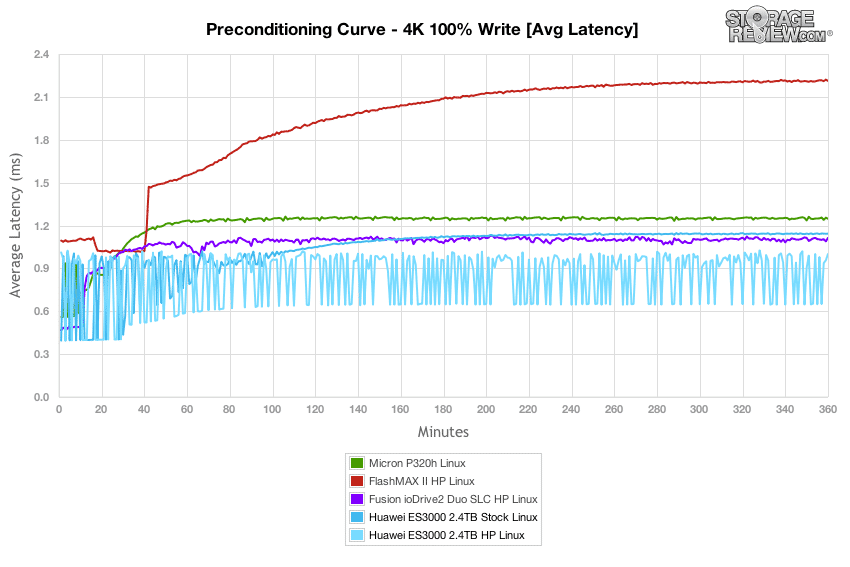
The Huawei Tecal ES3000 2.4TB Linux measured 0.4-1ms in burst and scaled up to right around 1.14ms (Stock) and 1ms (HP) as it neared steady-state. The HP figures were best in class, though the Fusion ioDrive2 Duo SLC HP did just slightly edge out the stock ES3000 2.4TB.
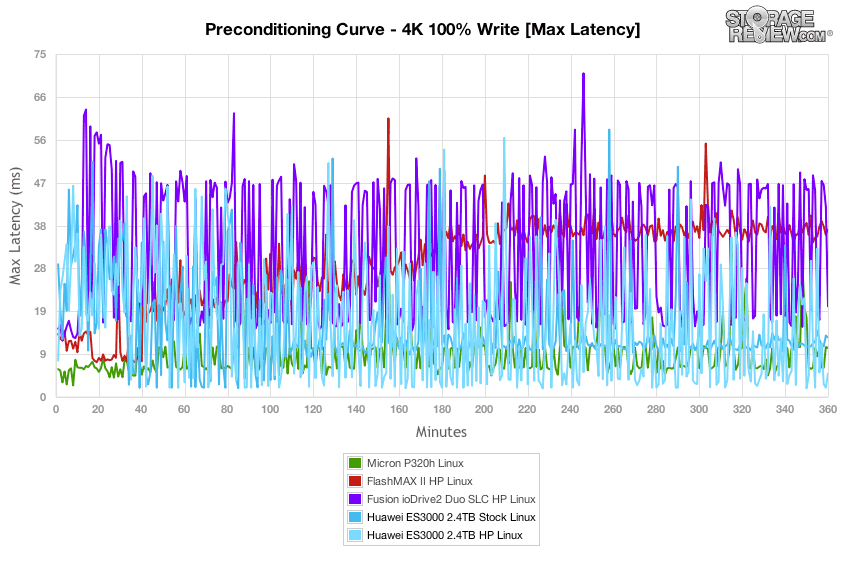
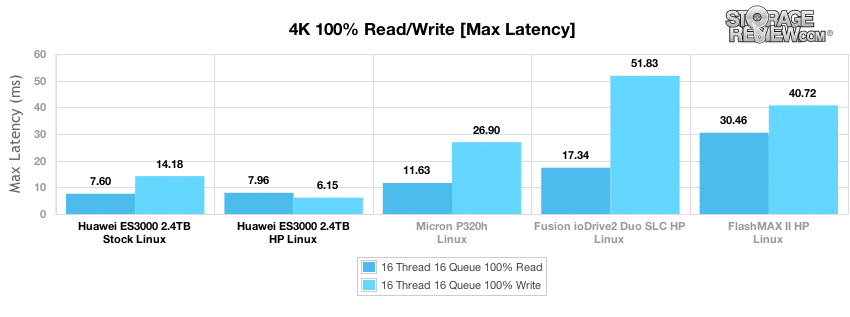
Comparing max latency, the Huawei Tecal ES3000 1.2TB Linux peaked with max response times up in the 30ms range, often performing with 10-25ms peaks. HP mode produced similar results. Neither of these two figures were enough to beat out the Micron P320h.
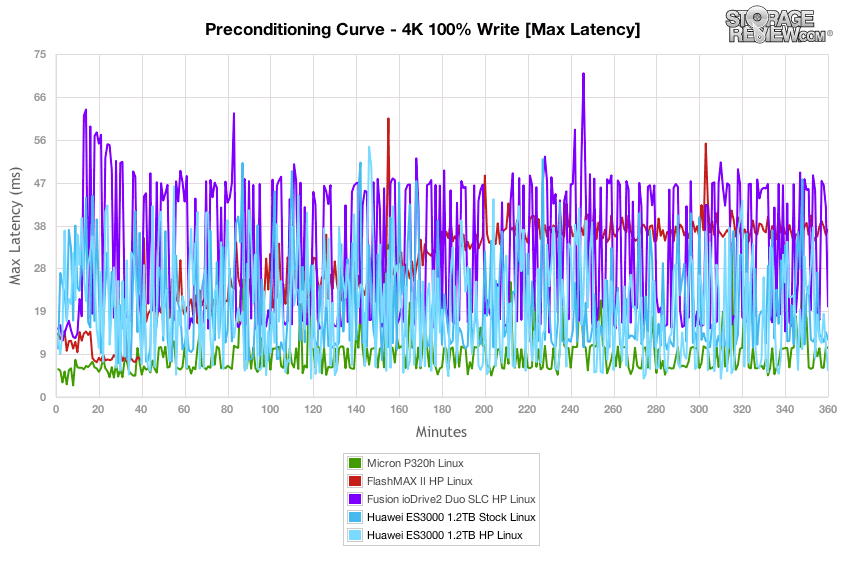
The Huawei Tecal ES3000 2.4TB Linux maintained figures under 45ms in both Stock and HP modes throughout the duration of the test. The best performance came from the Micron P320h which generally stayed in the 6-15ms range throughout.
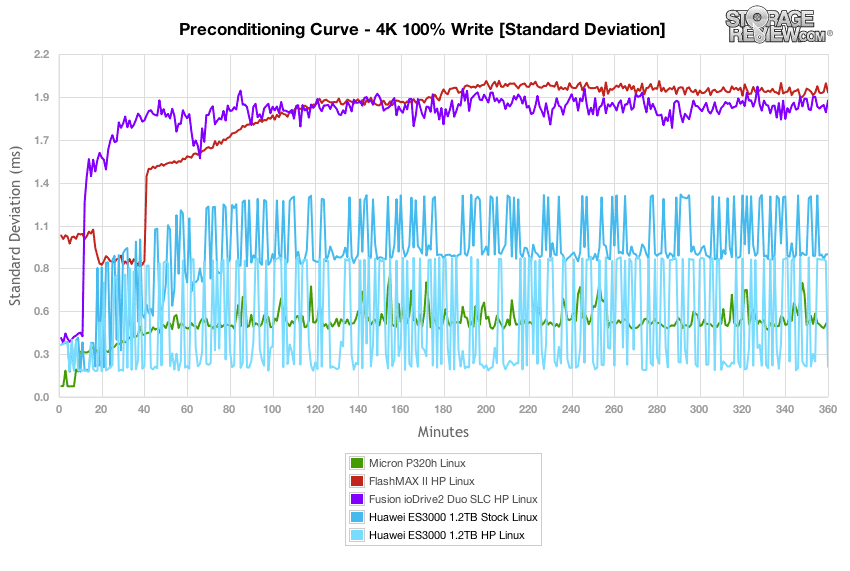
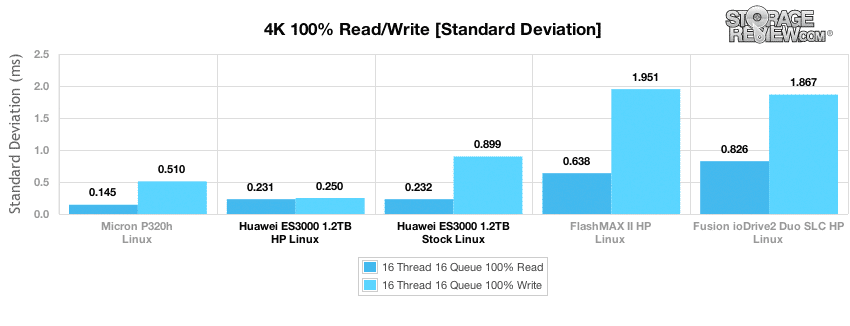
Looking even closer at latency consistency in our 4k random write workload, the Huawei Tecal ES3000 1.2TB Linux registered a peak of 0.95ms, although in HP mode the Tecal ES3000 was superior. It often stayed below 0.4ms. On aggregate, these HP figures were the best in class.
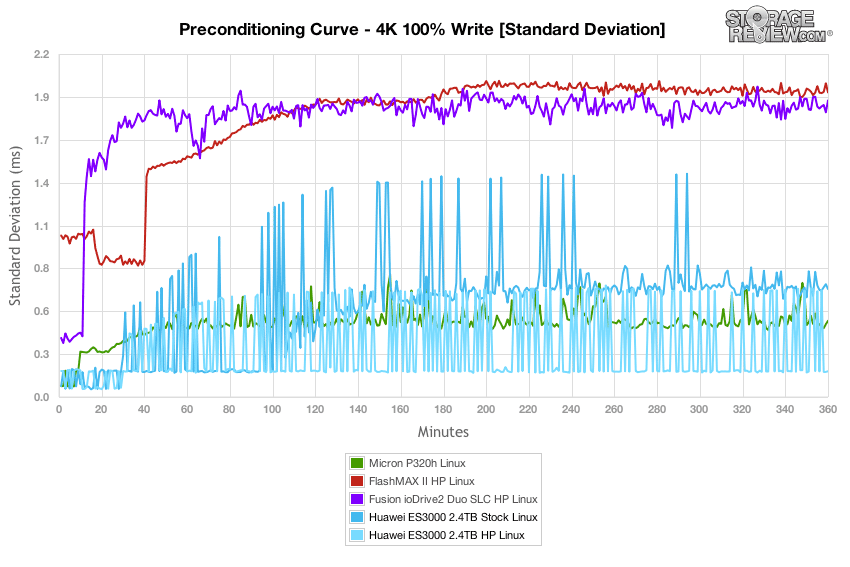
The Huawei Tecal ES3000 2.4TB Linux Stock did quite well, managing to stay under 0.81ms and finishing at 0.692ms. In HP mode, the ES3000 performed at the front of the group along with the Micron P320h.
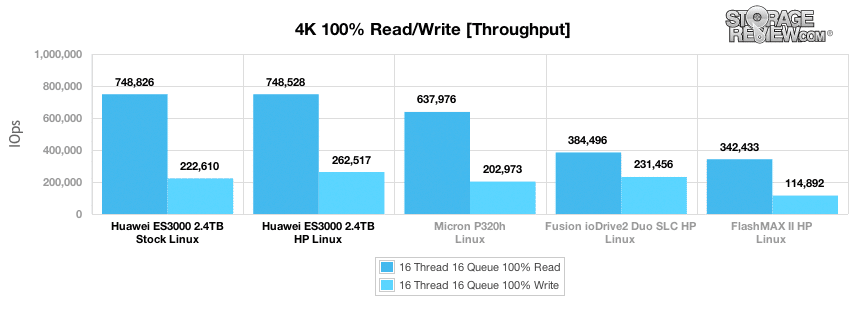
After 6 hours of preconditioning, the Huawei Tecal ES3000 1.2TB Linux offered 4k random read performance at a class best 747,000 IOPS (stock and HP) with write speed at 176,000 IOPS for stock and 257,000 IOPS for HP. Both stock and HP read activity performance was the highest in the group, and the HP write performance was also the highest.
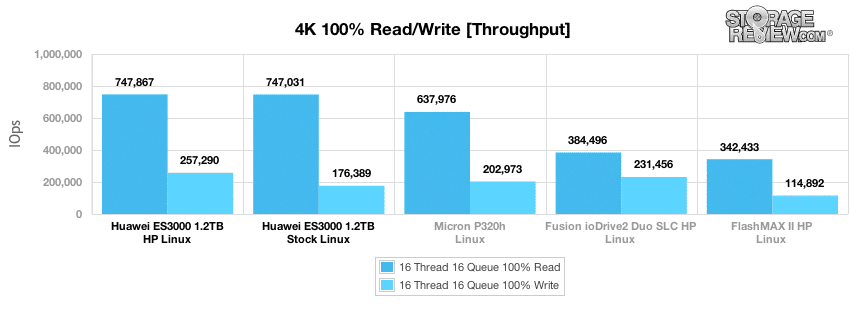
The Huawei Tecal ES3000 2.4TB Linux offered 4k random read performance at nearly 750,000 IOPS with write speeds at 222,610 IOPS (Stock) and 262,517 IOPS for HP mode. Read performance was tops, and while the stock ES3000 was just barely edged out in write performance by the Fusion ioDrive2 DUO SLC HP, the ES3000 HP performed at the front of the group.
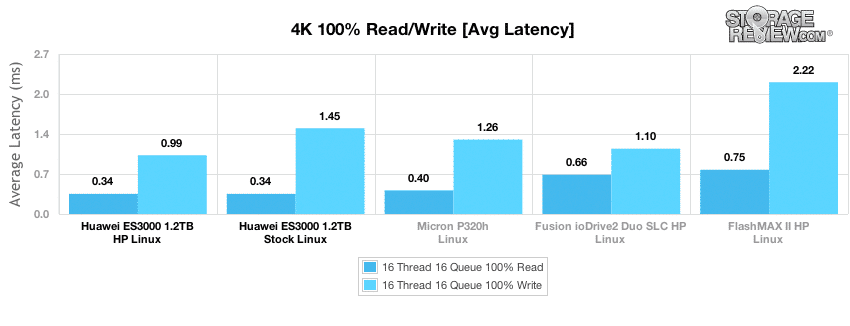
With a workload of 16T/16Q, the Huawei Tecal ES3000 1.2TB Linux offered an average 4k random read latency that lead the group at 0.34ms, while the write latency performance hit 1.45ms in stock and 0.99ms in HP mode. That HP number was the best, though stock just places ahead of the FlashMAX II HP.
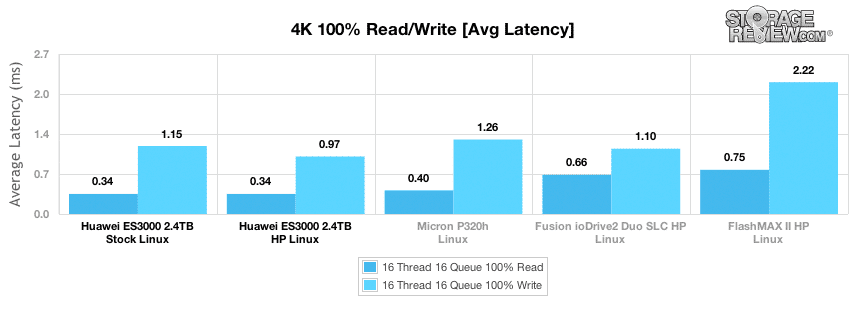
The Huawei Tecal ES3000 2.4TB Linux provided the best average 4k random read latency at 0.34ms, and its HP mode delivered the best write performance at just 0.97ms.
Max latency from the Huawei Tecal ES3000 1.2TB Linux was the best for read and write activity in both modes. Stock hit 5.67ms read and 15.04ms write, while HP mode achieved even lower figures at 4.84ms and 8.58ms (respectively).
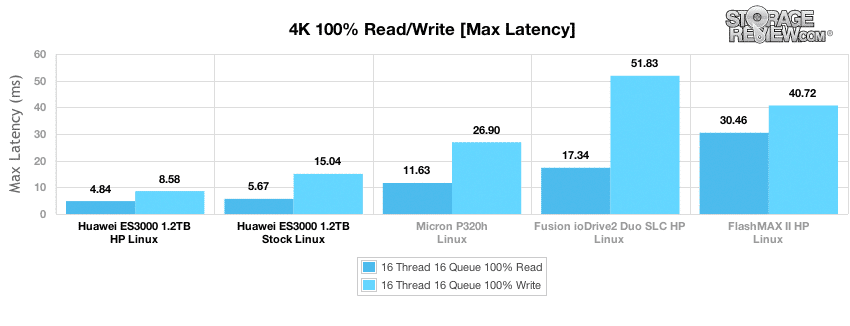
The Huawei Tecal ES3000 2.4TB Linux provided the lowest max latency in both Stock and HP modes.
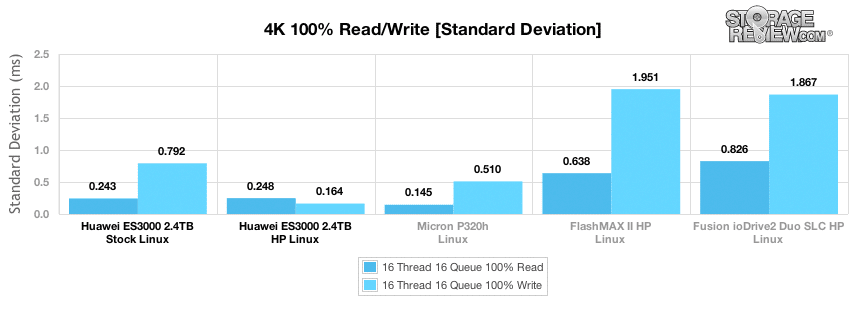
Comparing latency consistency, the Huawei Tecal ES3000 1.2TB Stock posted figures just behind the Micron P320h, though in HP mode, the Huawei outperformed the Micron in write activity performance.
The Huawei Tecal ES3000 2.4TB HP Linux posted a solid 0.248ms mark for latency consistency in read activity, and it provided the best mark at 0.164ms for write activity.
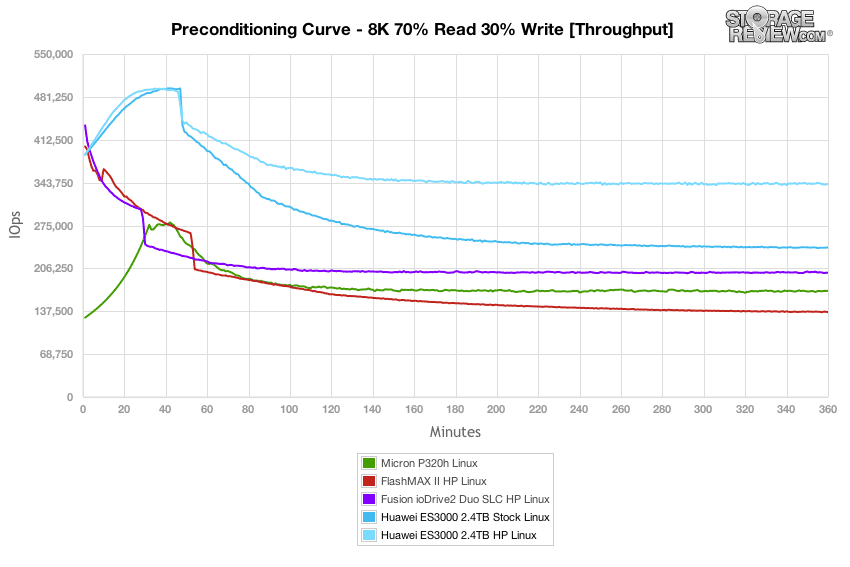
In our next workload, we look at an 8k profile with a 70/30 read/write mixed ratio. In this setting, the Huawei Tecal ES3000 1.2TB Linux actually peaked just after about 10 minutes, hitting all the way up to the 460,000 IOPS mark in burst which slowed to a speed around 190,000 IOPS (Stock) and 280,000 IOPS (HP). The burst performance was ahead of the competition, even beating out the Fusion ioDrive2 Duo SLC HP. Even more impressive were the Huawei HP figures, which bested the nearest competitor by roughly 80,000 IOPS.
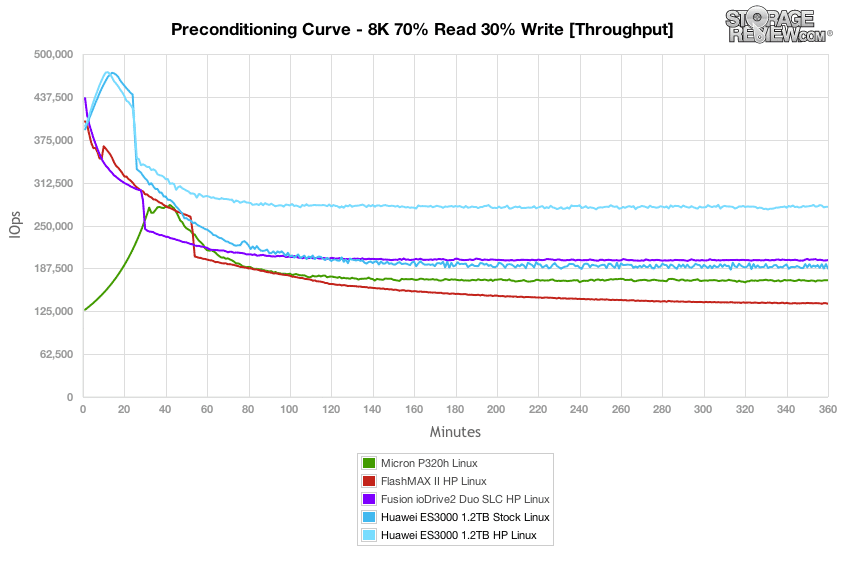
The Huawei Tecal ES3000 2.4TB HP Linux ranged up into the 490,000+ IOPS range in burst, which slowed to a speed around 340,000 IOPS. The burst performance was far ahead of the competition; in fact it was 100,000 IOPS higher than its Stock version, which also beat out the competition.
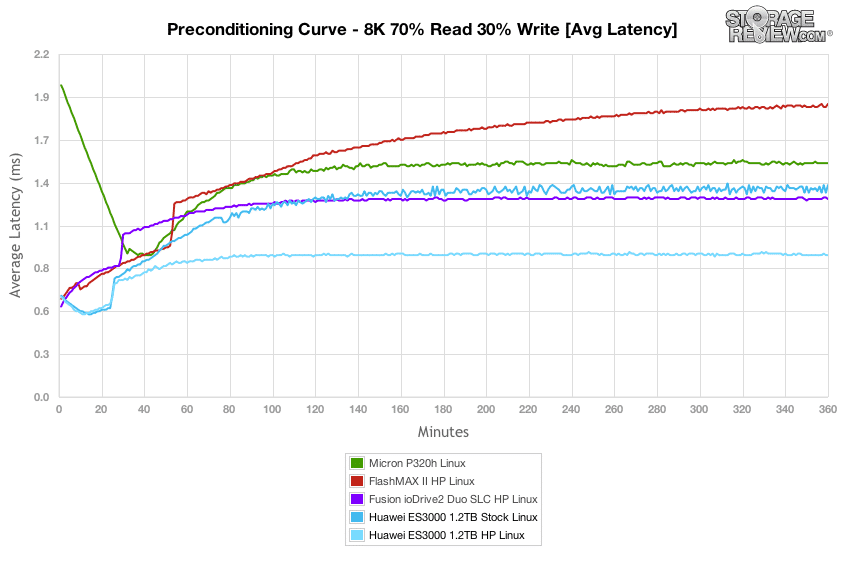
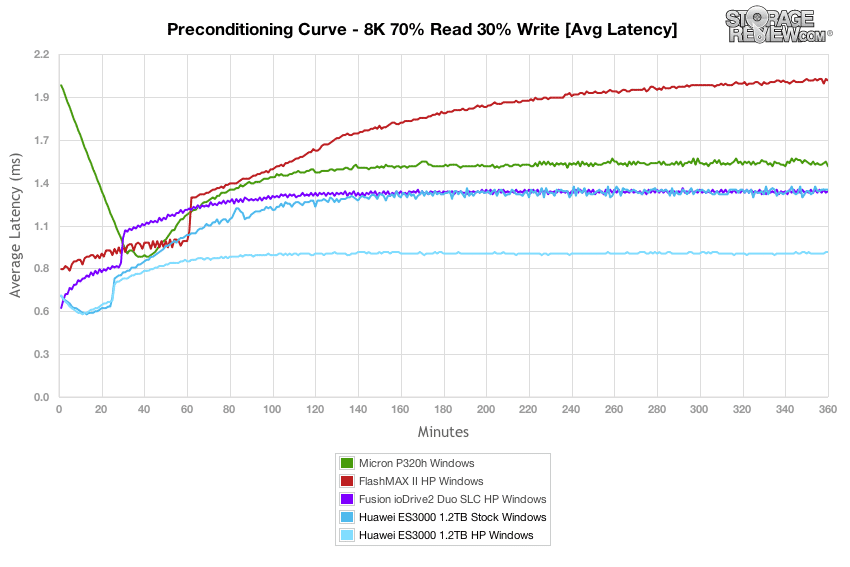
Average latency of the Huawei Tecal ES3000 1.2TB Linux measured 0.65ms at the beginning of our 8K 70/30 preconditioning test, which increased to around 1.35ms for stock and 0.95ms for HP as it neared steady-state. HP mode again displayed the best this group had to offer.
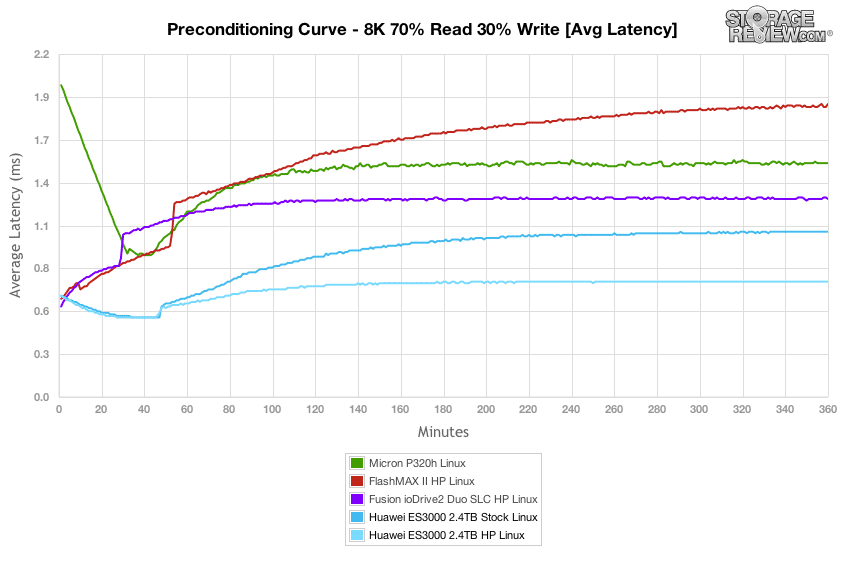
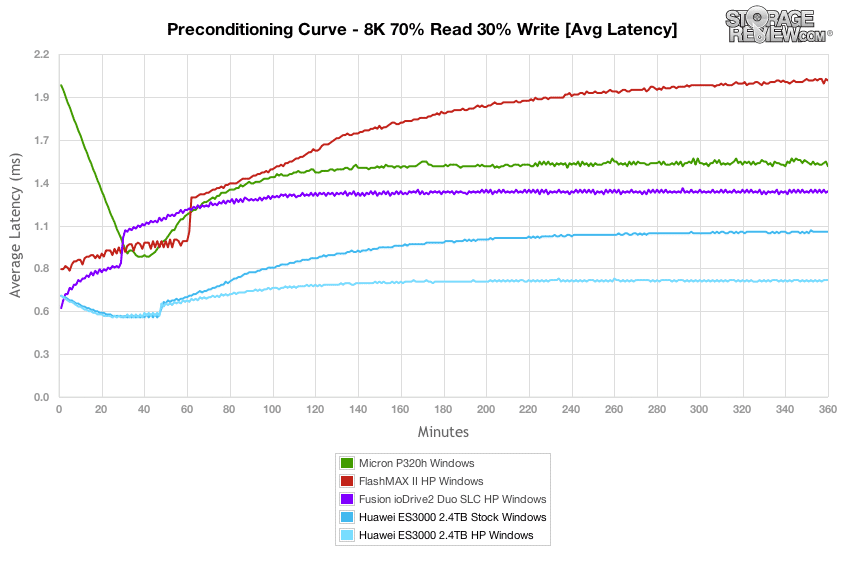
The Huawei Tecal ES3000 2.4TB HP Linux measured 0.65ms at the beginning of our 8K 70/30 preconditioning test, which increased to around 1.06ms for Stock and 0.74ms for HP as it neared steady-state.
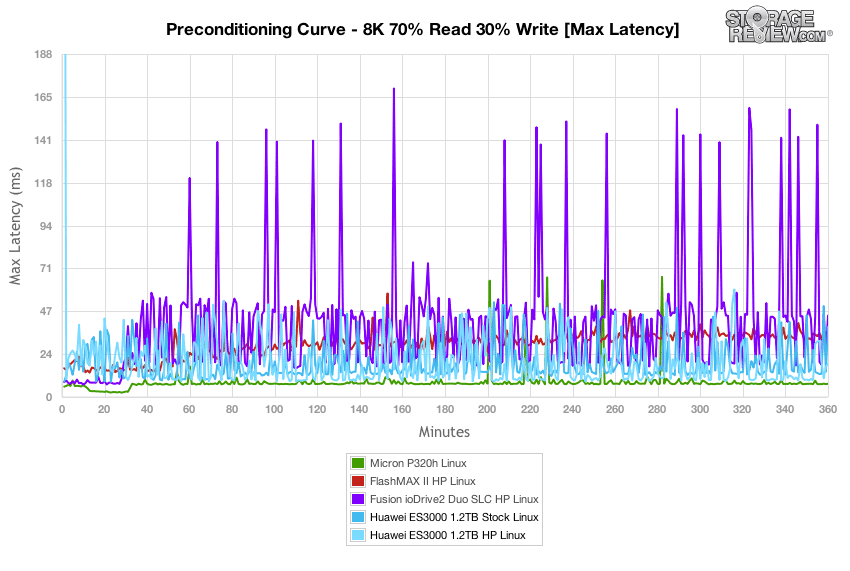
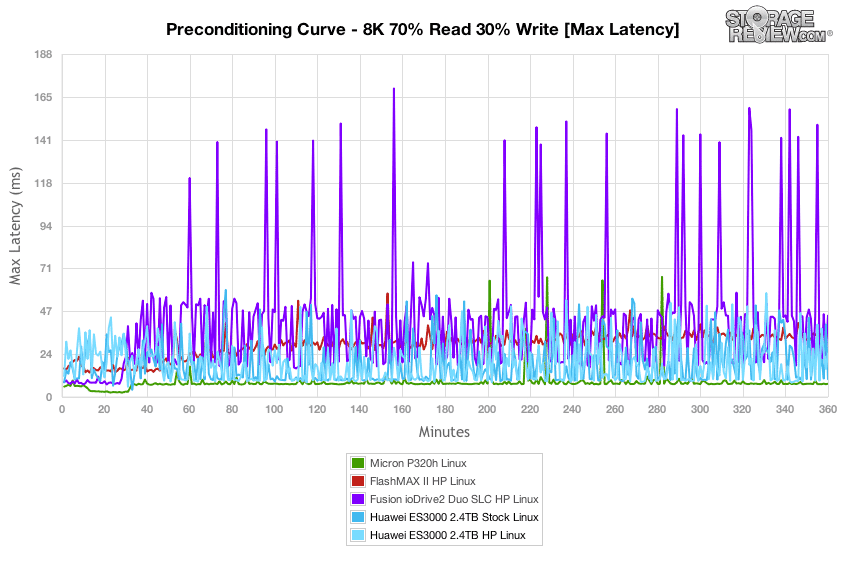
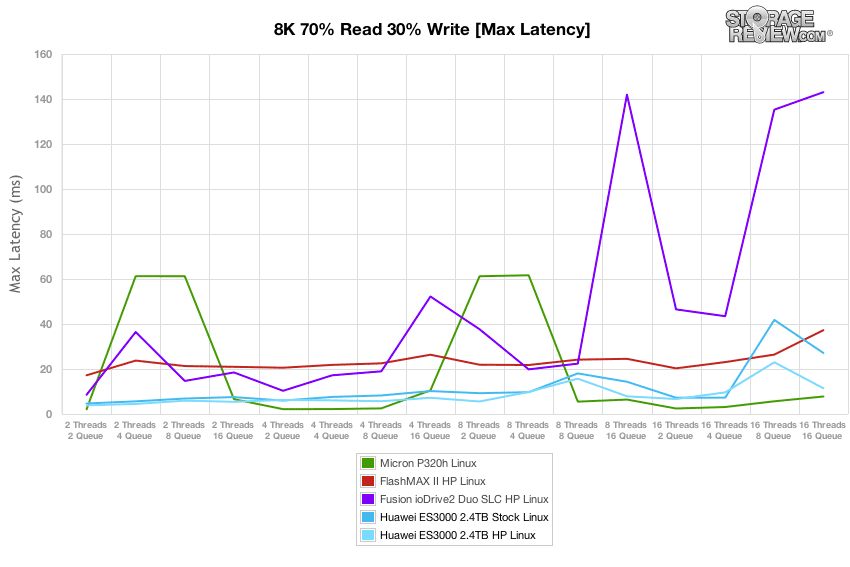
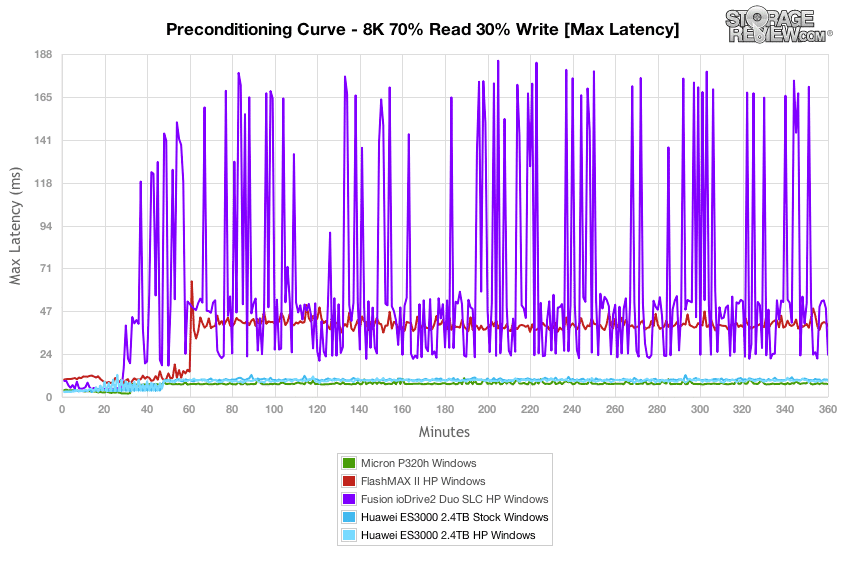
Over the duration of our 8k 70/30 test, the Huawei Tecal ES3000 1.2TB Linux offered peak response times predominantly in the sub 50ms range for Stock, and sub 40ms for HP. The Micron P320h however, delivered the best results.
The Huawei Tecal ES3000 2.4TB Linux offered the good peak response times, though its max latency couldn't maintain the pace set by the Micron P320h at sub-10ms.
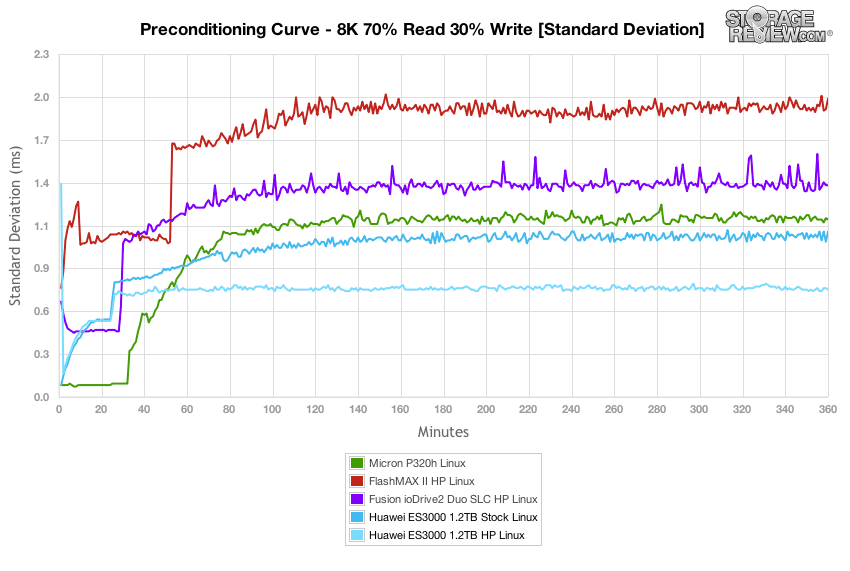
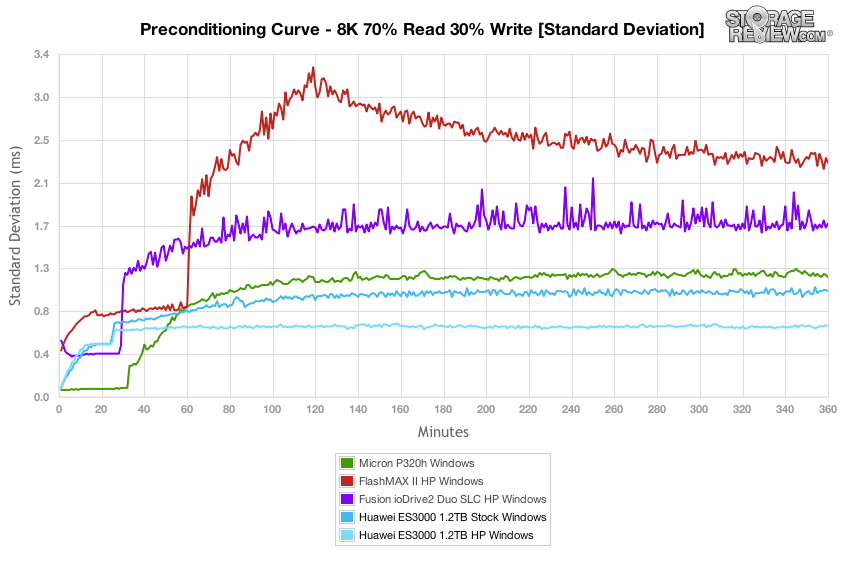
The Huawei Tecal ES3000 1.2TB Linux Stock and HP latency consistency achieved the lowest marks starting around the one hour mark, ending at 1.1ms and 0.72ms, respectively.
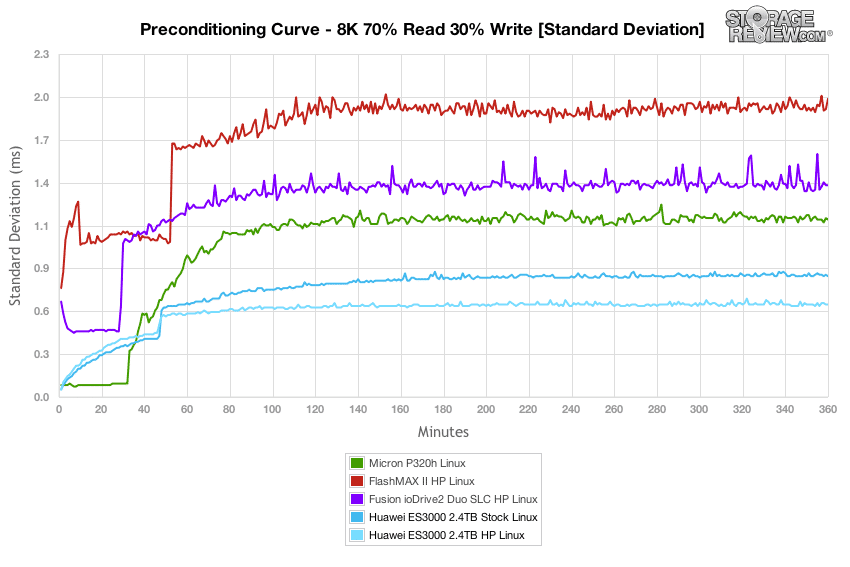
The Huawei Tecal ES3000 2.4TB Linux latency consistency achieved the lowest marks throughout, ending at 0.62ms (HP) and 0.81ms (Stock).
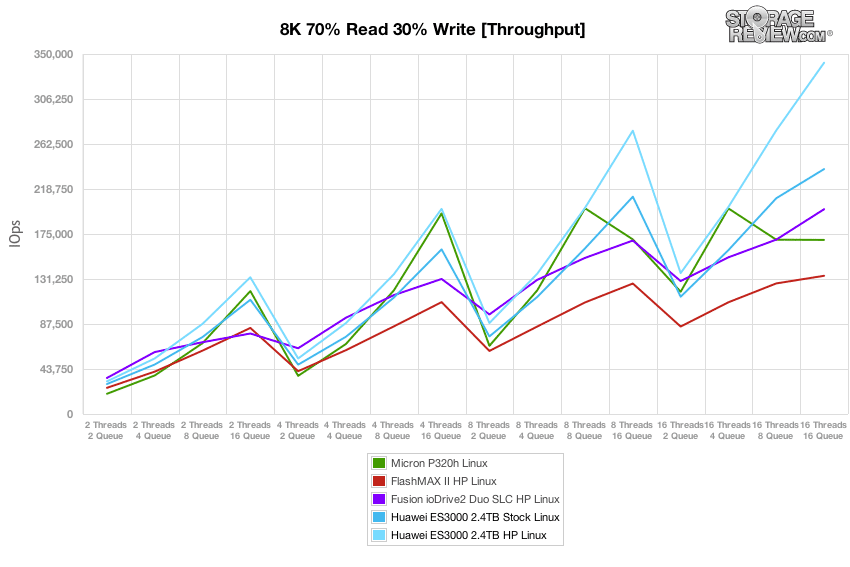
Compared to the fixed 16 thread, 16 queue max workload we performed in the 100% 4k write test, our mixed workload profiles scale the performance across a wide range of thread/queue combinations. In these tests, we span workload intensity from 2 threads and 2 queue up to 16 threads and 16 queue. In the expanded 8k 70/30 test, the Huawei Tecal ES3000 1.2TB Linux peaked at around 189,000 IOPS (Stock) and 277,000 IOPS (HP) – the HP figure was at the top of the group by a significant margin.
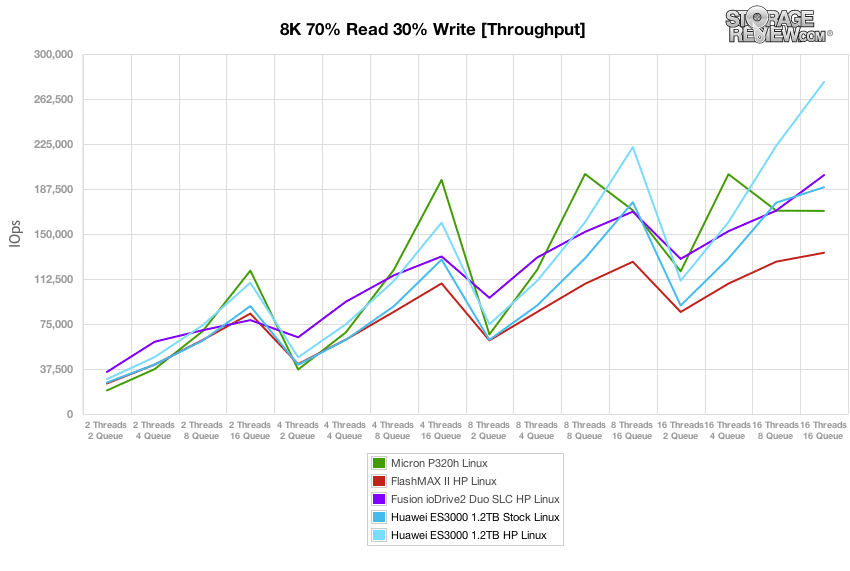
The Huawei Tecal ES3000 2.4TB HP Linux peaked at around 341,000 IOPS, planting it solidly at the top of the group.
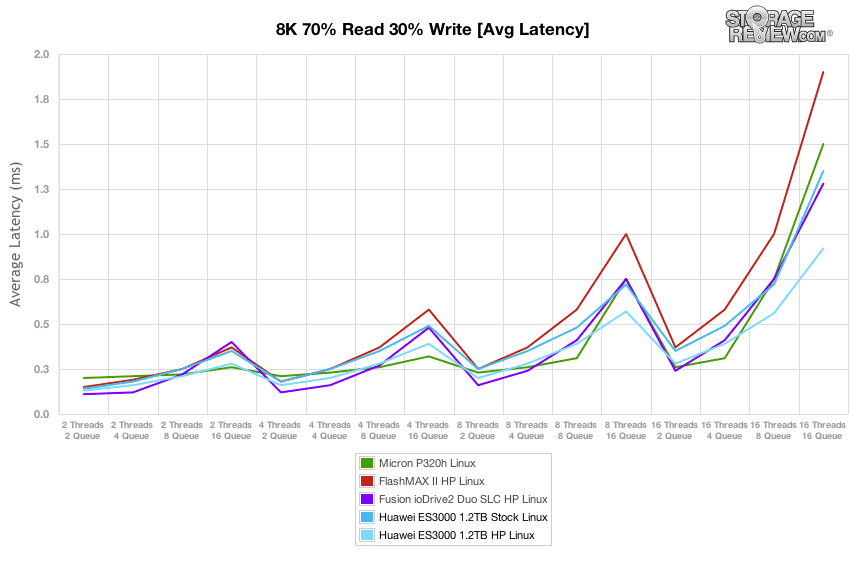
Average latency for the Huawei Tecal ES3000 1.2TB Linux HP was class-leading, and the stock version also bested most of the competition, getting edged out only by the Fusion ioDrive2 Duo SLC HP.
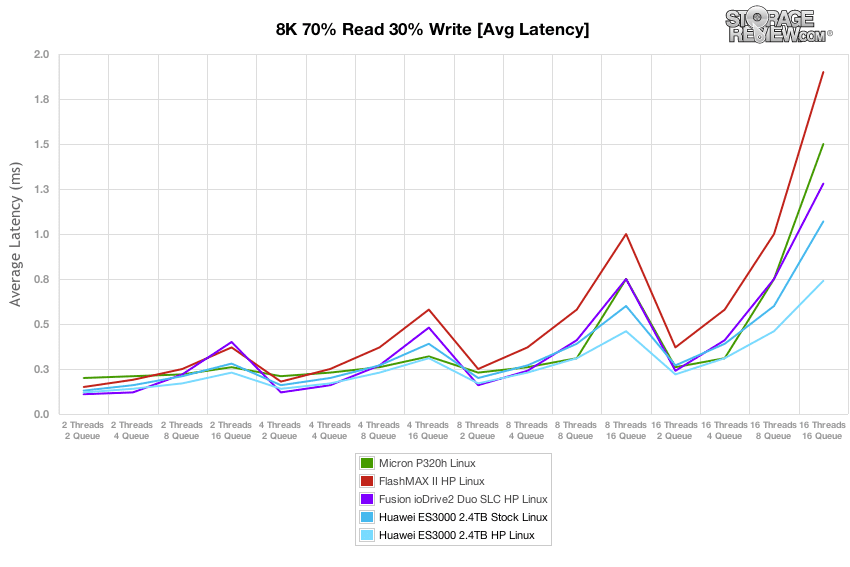
Average latency for the Huawei Tecal ES3000 2.4TB HP Linux was class-leading, peaking at 0.8ms mark.
Over the duration of our varying load 8k 70/30 test, max latency for the Huawei Tecal ES3000 1.2TB Linux remained under 31ms (Stock) and 25ms (HP) at its peaks.
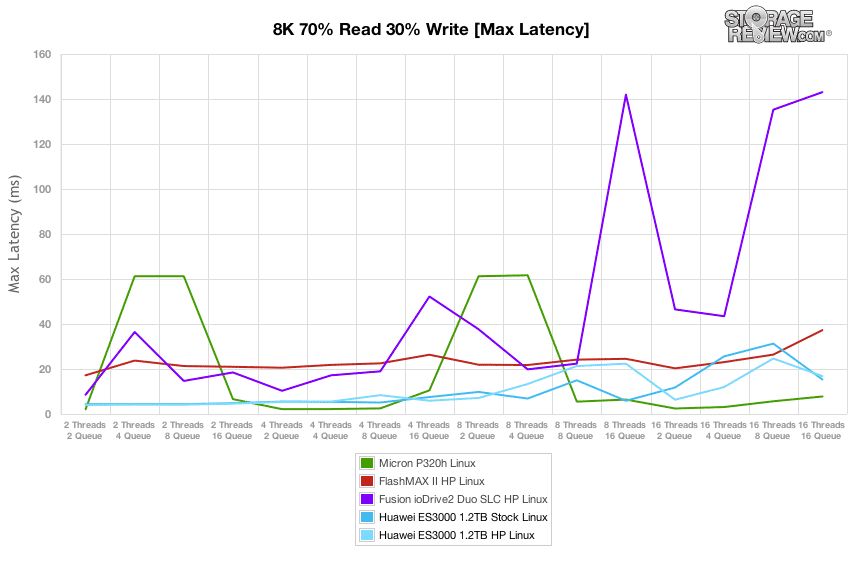
Max latency remained consistently low throughout the 8k 70/30 test, however it couldn't edge out the performance the Micron P320h produced.
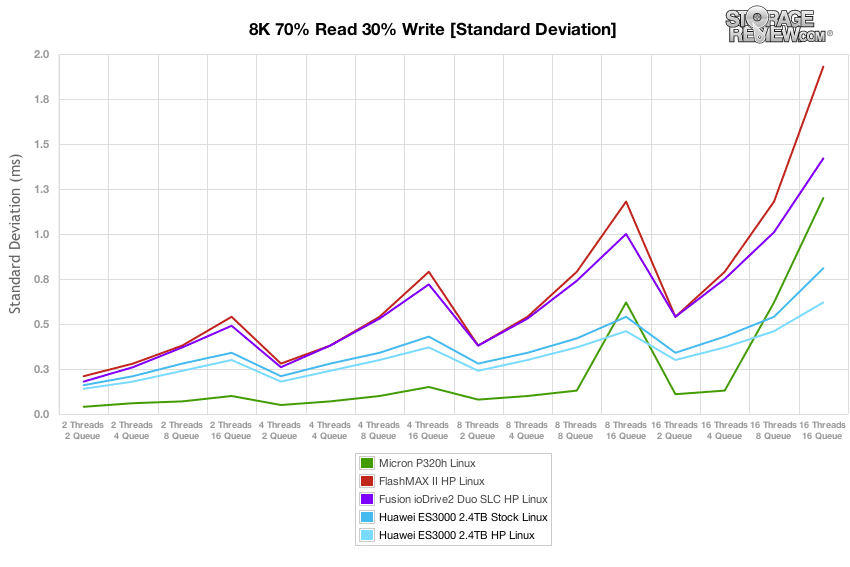
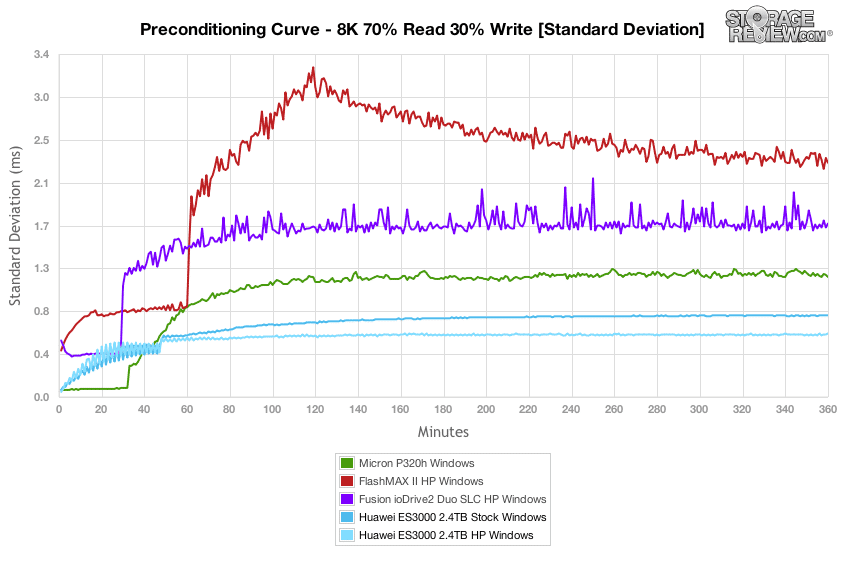
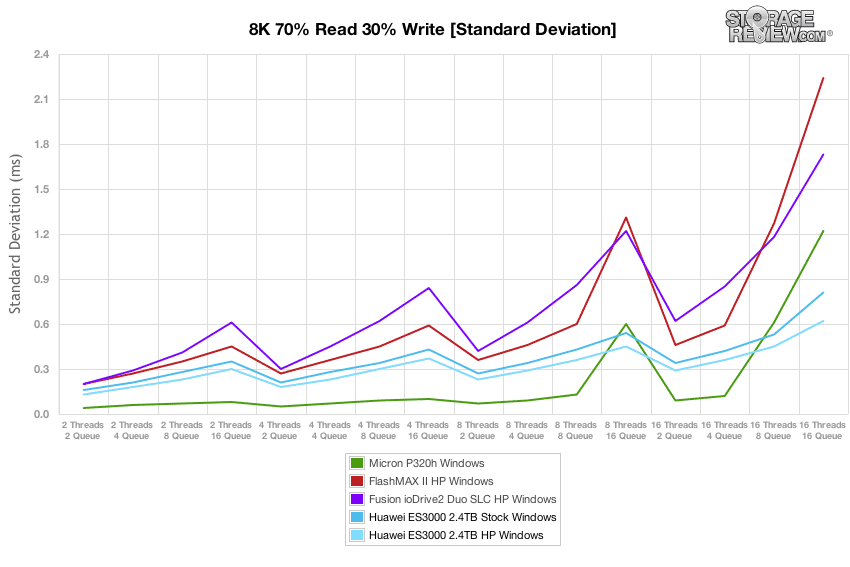
Standard deviation from the Huawei Tecal ES3000 1.2TB Linux in our test environment was class-best, both in stock and HP modes.
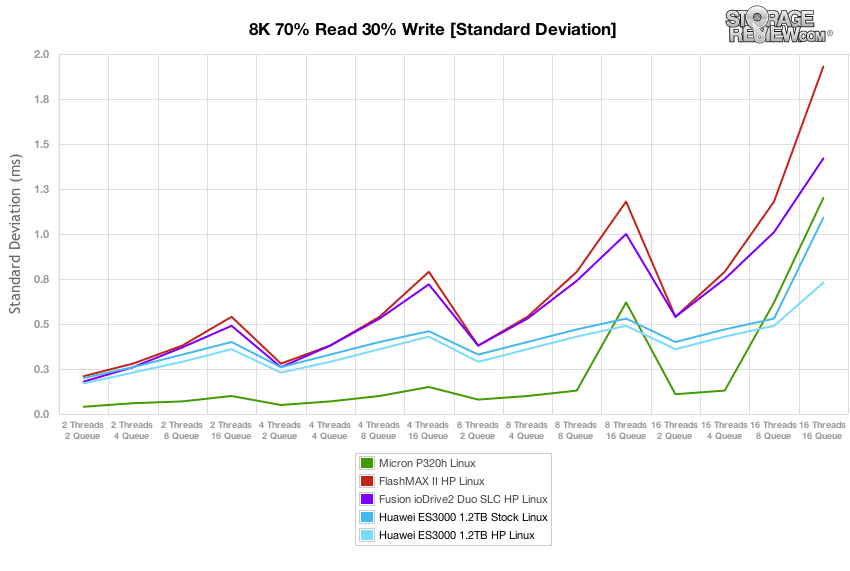
The Micron P320h held the edge for the bulk of the standard deviation test, though the Huawei Tecal ES3000 2.4TB Linux peaked lowest at the terminal point of our testing.
Windows Testing
At this point, we transitioned our testing from Linux to Windows. Given that different devices produce varying levels of performance depending on whether they are operating on a Linux- or Windows-based environment, this is a necessary step in this level of testing. Depending on the device's architecture, firmware, etc., it may produce far greater throughput and far less latency in one environment than another.
Our first test measures 100% 4k random write performance with a load of 16T/16Q. In this setting, the bursting nature of the Huawei Tecal ES3000 1.2TB Windows tested at 483,000 IOPS which then leveled off near steady-state at 179,000 IOPS (Stock) and to a class-best 279,000 IOPS (HP).
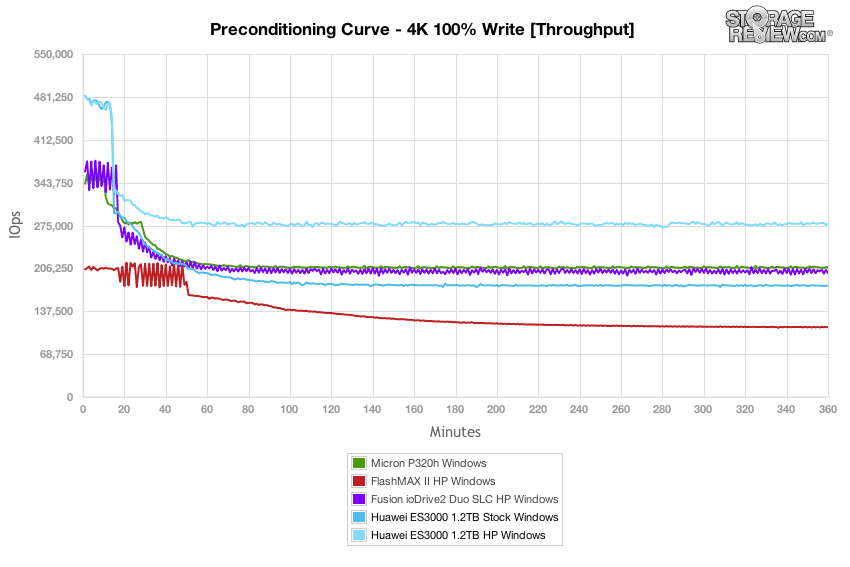
The Huawei Tecal ES3000 2.4TB HP Windows tested at 582,000 IOPS (562,000 Stock), which then leveled off near steady-state at 392,000 and 225,000 IOPS, respectively.
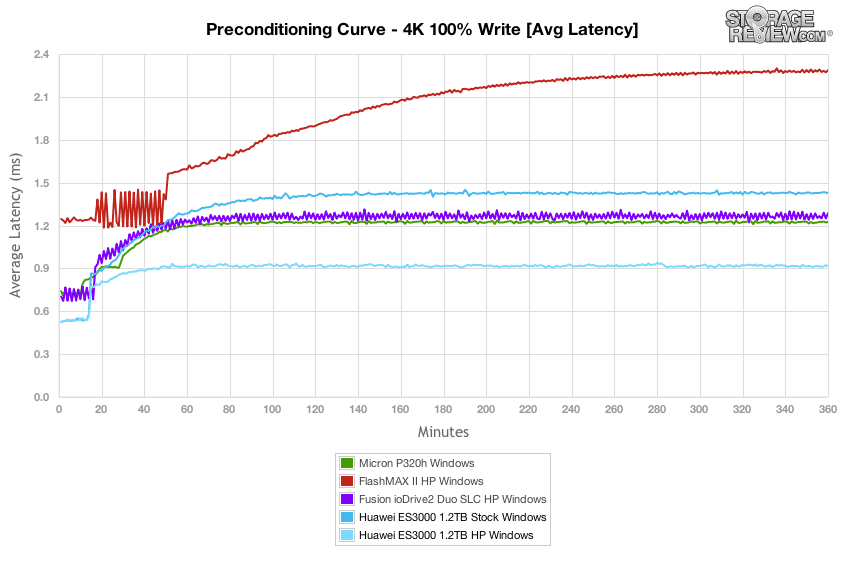
With a heavy 16T/16Q load, the Huawei Tecal ES3000 1.2TB Windows measured 0.5-1ms in burst and scaled up to right around 1.4ms (Stock) and 0.9ms (HP) as it neared steady-state.
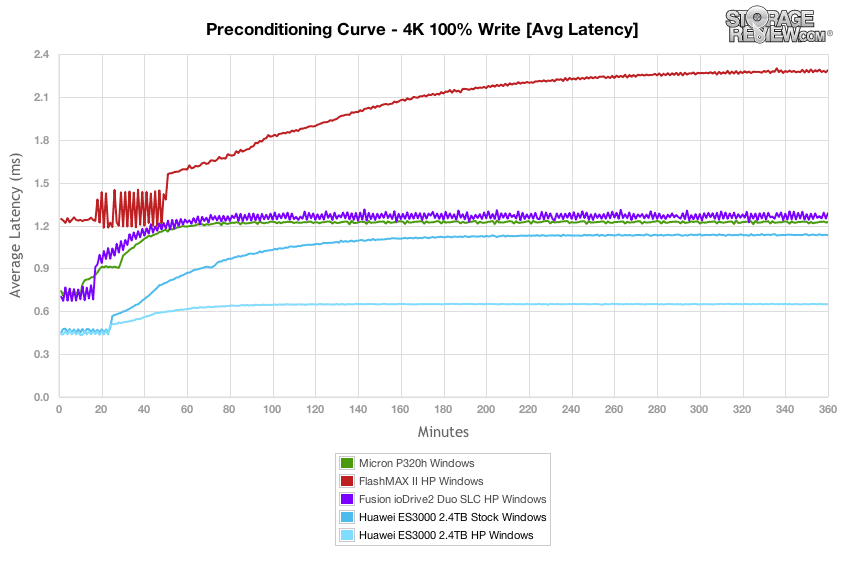
The Huawei Tecal ES3000 2.4TB Windows measured 0.44-0.9ms in burst and scaled up to 0.65ms and 1.13ms (HP and Stock) as it neared steady-state.
Comparing max latency, the Huawei Tecal ES3000 1.2TB Windows produced max latency figures under 15ms in Stock and HP modes, maintaining the most consistent performance throughout.

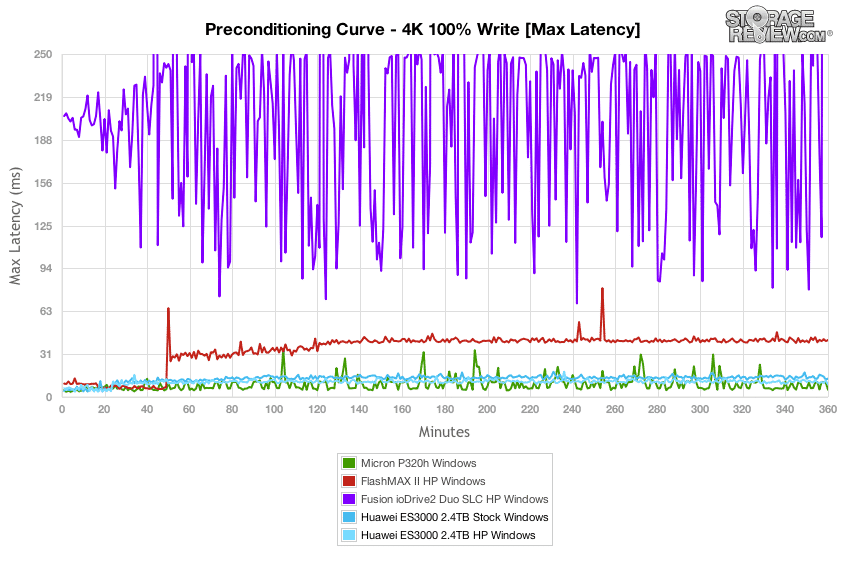
The Huawei Tecal ES3000 2.4TB Windows provided more consistency over the course of our Max Latency testing, although the Micron P320h provided the lowest marks throughout.
Looking even closer at latency consistency in our 4k random write workload, the Huawei Tecal ES3000 1.2TB Windows was edged out by the Micron P320h.
The Huawei Tecal ES3000 2.4TB HP Windows placed just above the Micron P320h at roughly 0.7ms (compared with about 0.5ms for the Micron).
After 6 hours of preconditioning, the Huawei Tecal ES3000 1.2TB Windows offered the best 4k random read performance at 580,000 IOPS (Stock) and 597,000 IOPS (HP), which were both best in group. Read activity performance from the ES3000 was also the best in HP mode, measuring 277,000 IOPS with Stock at 177,000 IOPS.
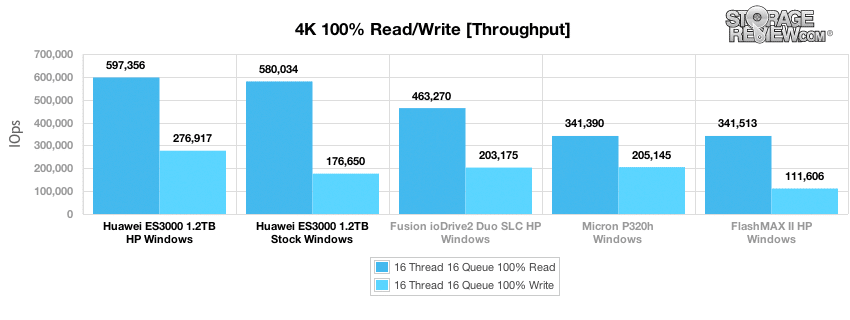
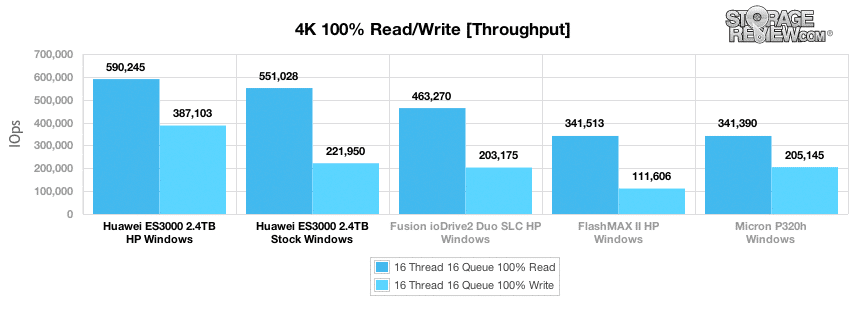
The Huawei Tecal ES3000 2.4TB HP Windows provided 590,000 IOPS in read activity and 387,000 for writes. Both figures led the way, followed by the ES3000 Stock.
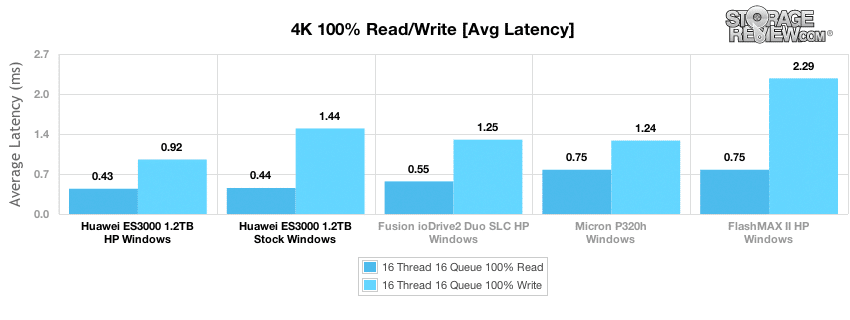
With a workload of 16T/16Q, the Huawei Tecal ES3000 1.2TB HP Windows offered an average 4k random read latency that lead the group at 0.43ms, and it also held the title for the best write latency performance at 0.92ms.
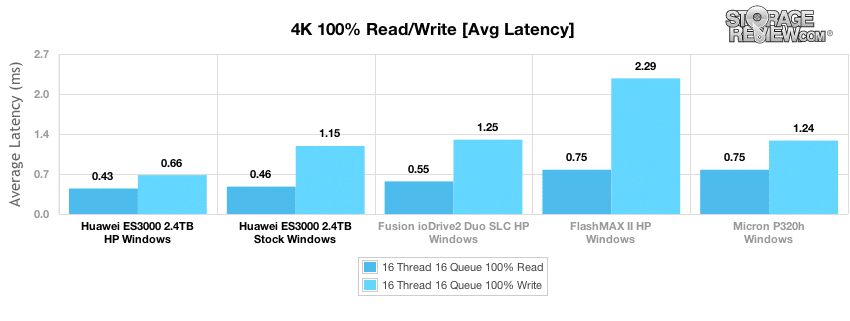
The Huawei Tecal ES3000 2.4TB Stock and HP Windows both offered the lowest average latency figures. In HP mode, the ES3000 2.4TB hit 0.43ms for read activity and 0.66 for write activity.
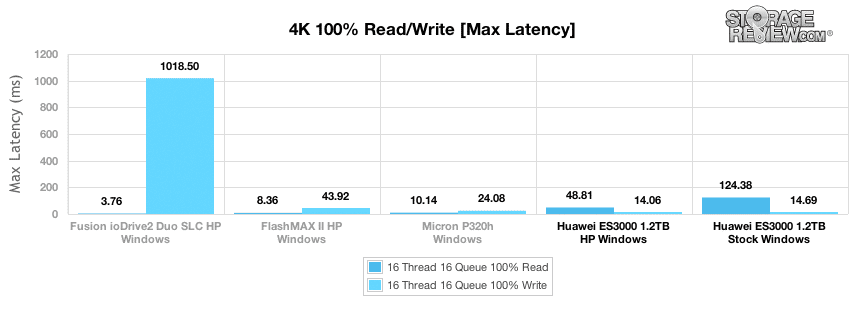
Max latency from the Huawei Tecal ES3000 1.2TB Windows was the highest in the group for read activity at 48.81ms (HP) and 124.38ms (Stock), though its write activity max was the lowest in the group at just around 14ms for both modes.
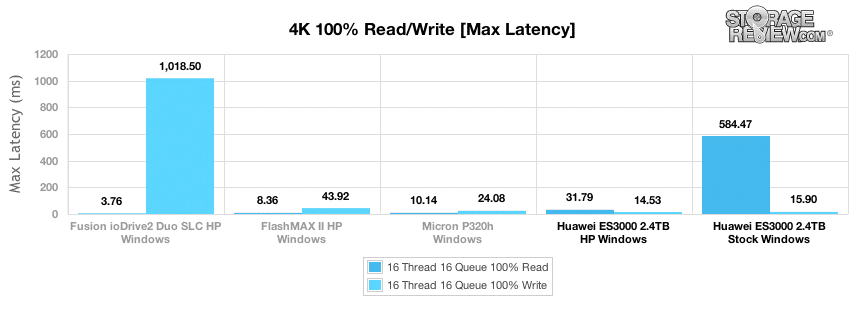
As with the 1.2TB, the Huawei Tecal ES3000 2.4TB Windows placed at the back of the group for its read activity max latency performance, though its write activity performance was the best in the group.
Comparing latency consistency, the Huawei Tecal ES3000 1.2TB Windows posted figures near the back of the group in 4k random read and write consistency.
The Huawei Tecal ES3000 2.4TB Windows also posted figures near the back of the group.
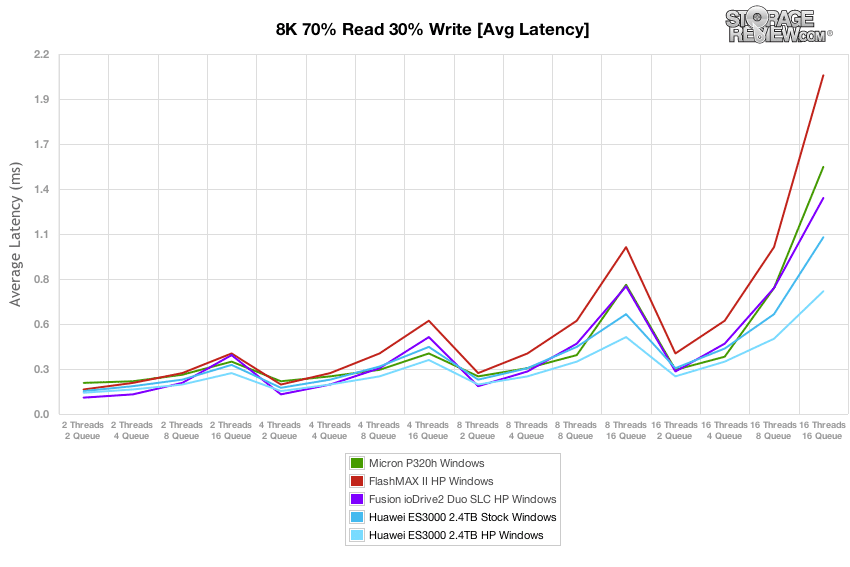
In our next workload, we look at an 8k profile with a 70/30 read/write mixed ratio. In this setting, the Huawei Tecal ES3000 1.2TB Windows started off around 380,000 IOPS and peaked in burst speeds at 450-470,000 IOPS, which then slowed to a speed around 192,000 IOPS (Stock) and 274,000 IOPS (HP). The HP performance beat out the competition handily, while even in Stock the ES3000 outperformed the competition aside from the Fusion ioDrive2 Duo SLC HP, with which it tangoed back and forth.
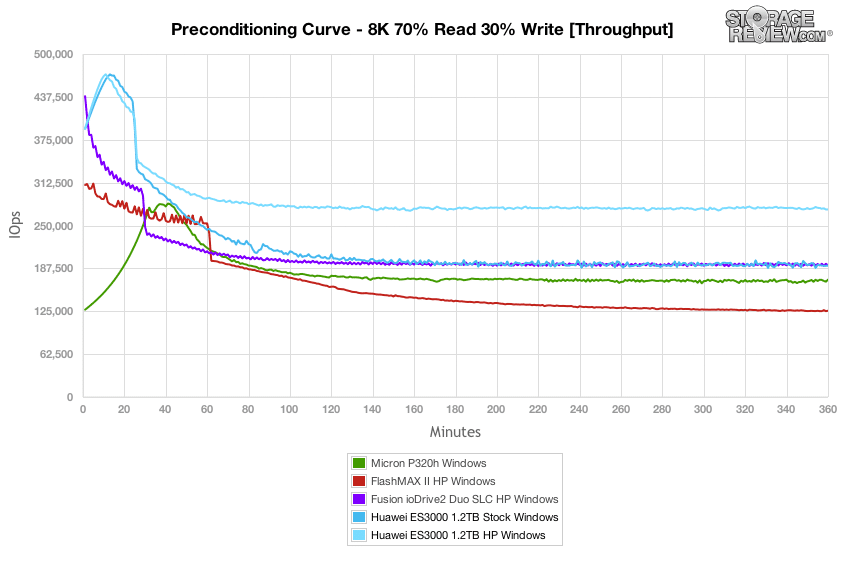
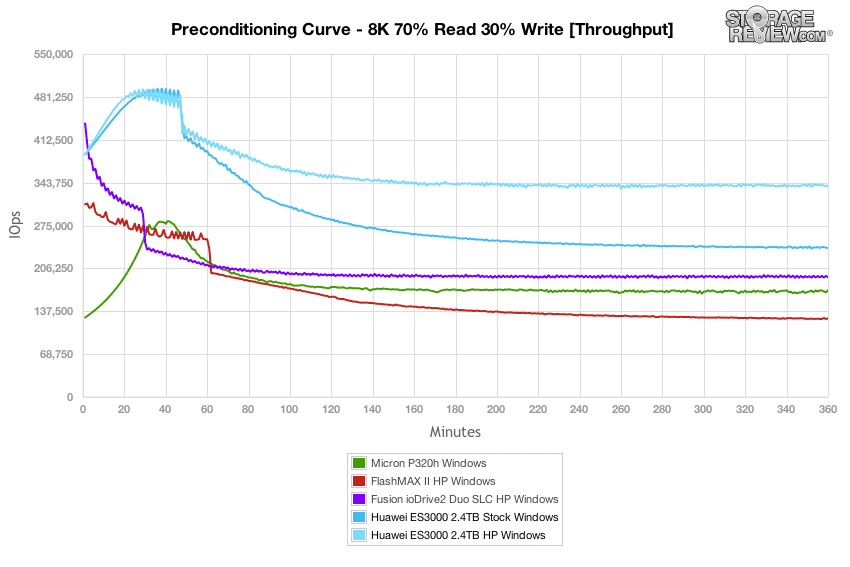
The Huawei Tecal ES3000 2.4TB HP Windows peaked at 494,000 IOPS in burst which slowed to a speed around 342,000 IOPS. Throughput here again proved to be another shining point for the Huawei.
Average latency of the Huawei Tecal ES3000 1.2TB Windows measured 0.65ms at the beginning of our 8K 70/30 preconditioning test, which increased to 0.93ms for HP and 1.33ms for Stock as the ES3000 neared steady-state. HP outperformed the competitions' marks again, and following the throughput placing, the Fusion HP and Huawei Stock were neck and neck.
The Huawei Tecal ES3000 2.4TB HP Windows measured 0.65ms at the beginning of our 8K 70/30 preconditioning test, which increased to 0.75ms (1.06ms Stock).
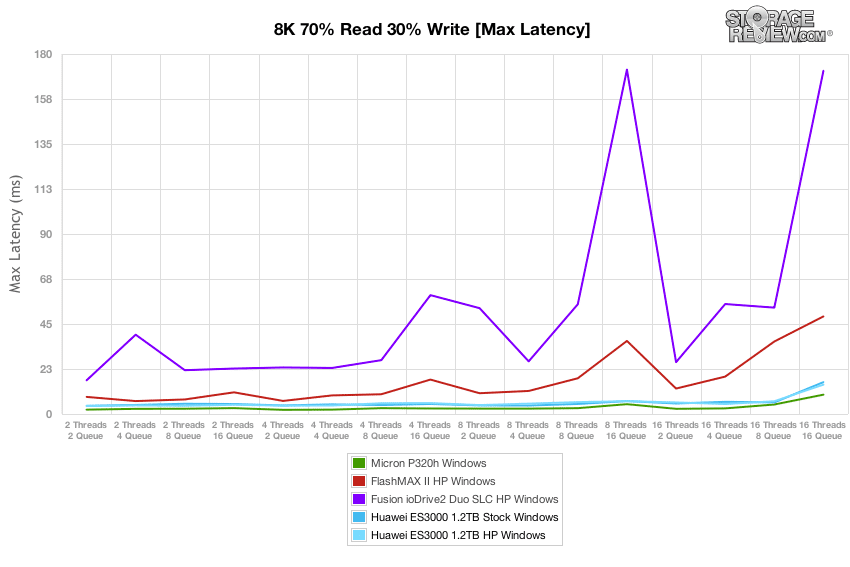
Over the duration of our 8k 70/30 test, the Huawei Tecal ES3000 1.2TB Windows offered excellent peak response times, which stayed under 10ms in HP mode and 15ms in Stock mode. However, the Micron P320h was best in class for the bulk of the test was sub 8ms figures.

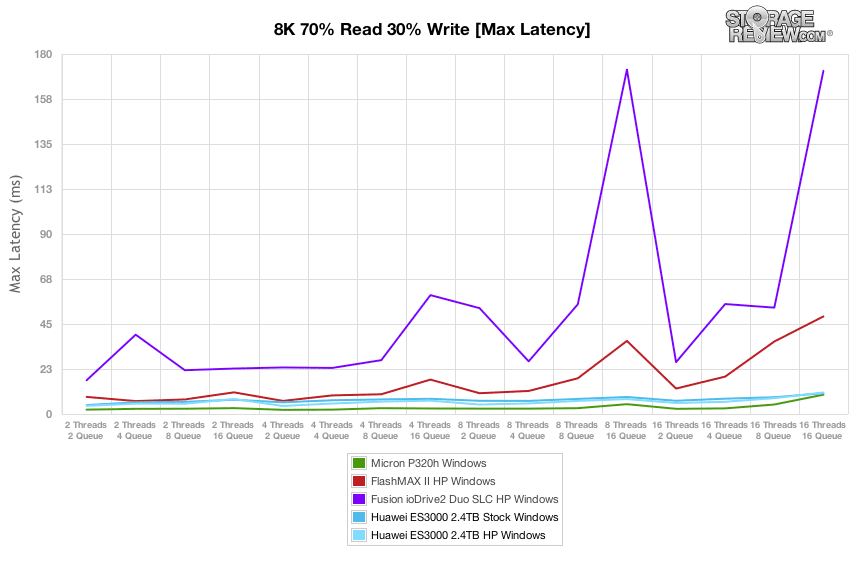
The Huawei Tecal ES3000 2.4TB Windows offered excellent peak response times, with max latency measuring below 10ms for the bulk of the test. Though it was by a very slim margin, the Micron P320h did provide the best results.
The Huawei Tecal ES3000 1.2TB Windows latency consistency achieved the lowest marks starting at the one hour mark.
The Huawei Tecal ES3000 2.4TB Windows achieved the lowest mark in latency consistency.
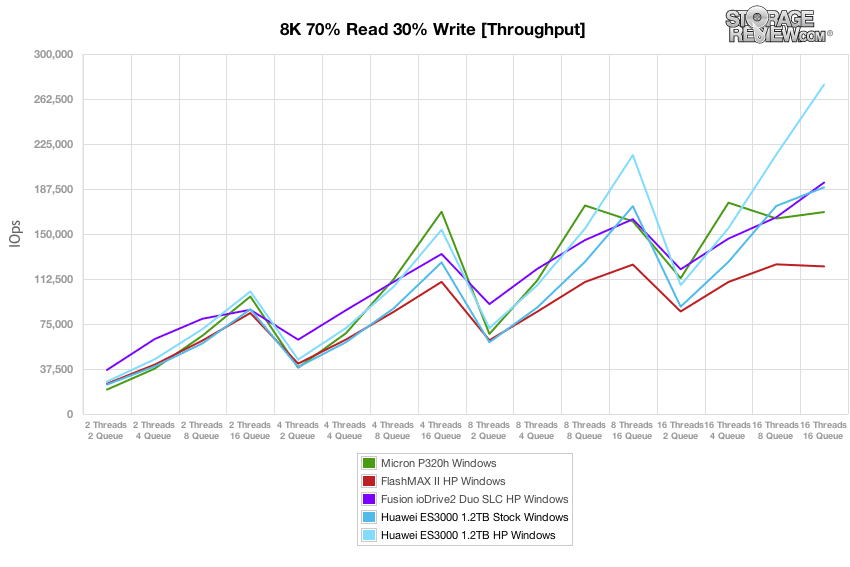
Compared to the fixed 16 thread, 16 queue max workload we performed in the 100% 4k write test, our mixed workload profiles scale the performance across a wide range of thread/queue combinations. In these tests, we span workload intensity from 2 threads and 2 queue up to 16 threads and 16 queue. In the expanded 8k 70/30 test, the Huawei Tecal ES3000 1.2TB HP Windows peaked at around 275,000 IOPS, which was at the top of the group. In fact, the figure was nearly 100,000 IOPS greater than the nearest competitor.
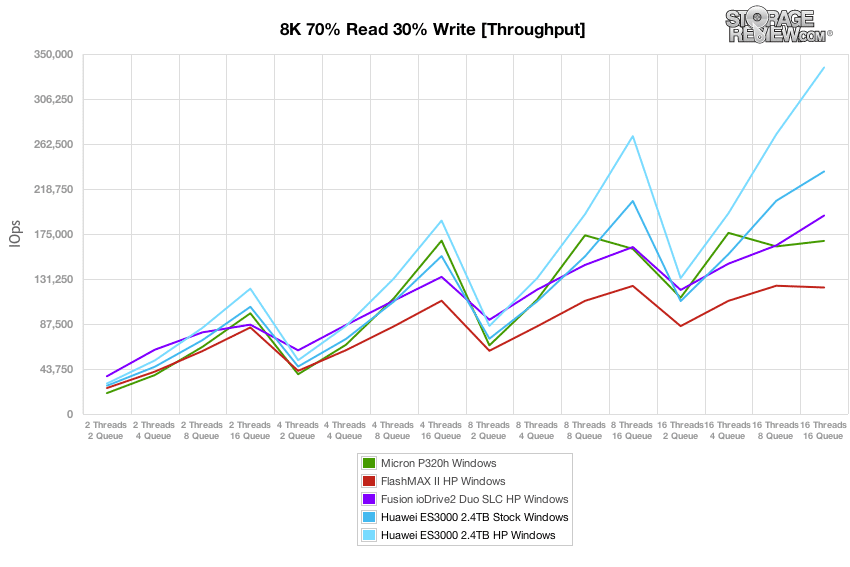
The Huawei Tecal ES3000 2.4TB HP Windows peaked at around 337,000 IOPS which was at the top of the group by a significant margin.
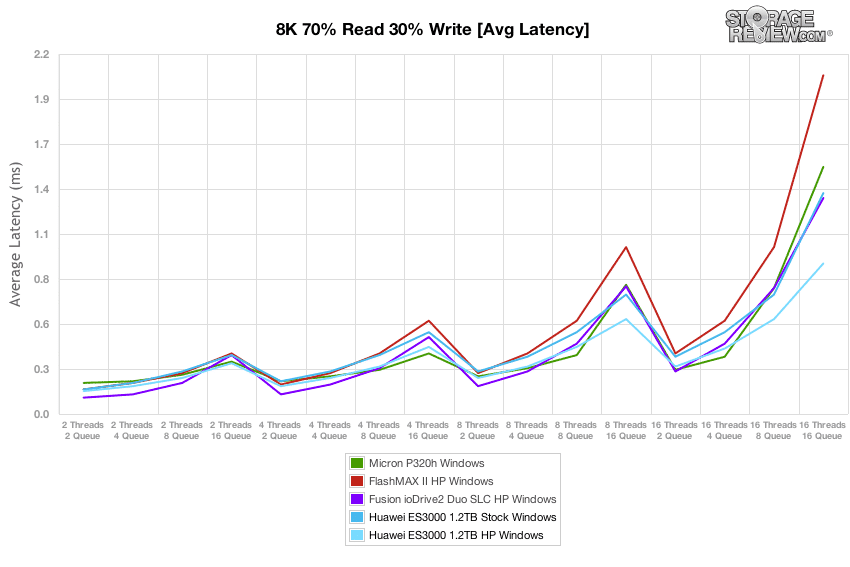
Average latency for the Huawei Tecal ES3000 1.2TB HP Windows was class-leading, and the Stock version was only slightly edged out by the Fusion ioDrive2 Duo SLC HP.
The Huawei Tecal ES3000 2.4TB Windows was class-leading in average latency, staying under 1ms in both Stock and HP modes.
Over the duration of our varying load 8k 70/30 test, max latency remained under 15ms for the bulk of the test, though the Micron P320h was the top performer here.
The Huawei Tecal ES3000 2.4TB Windows performed well in max latency, though the Micron P320h won out in this category again.
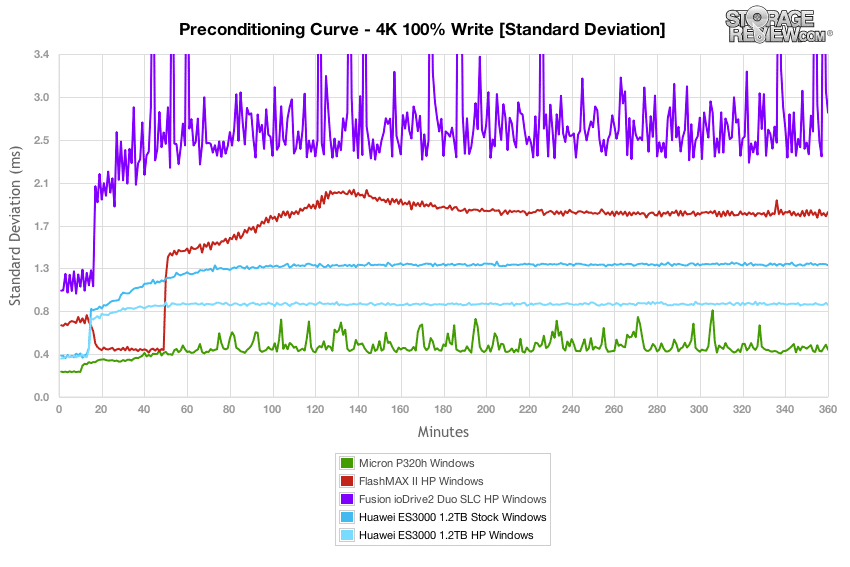
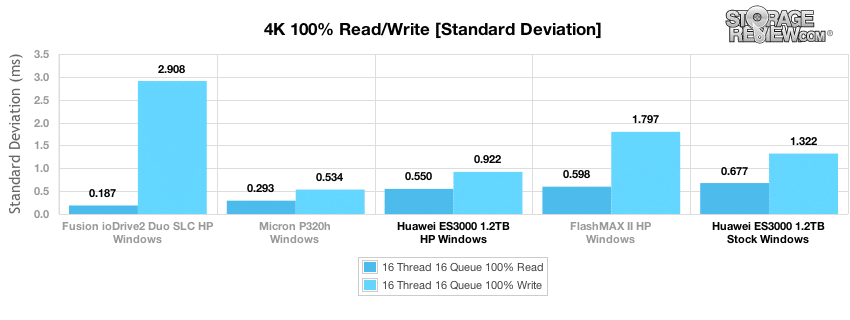
Standard deviation from the Huawei Tecal ES3000 1.2TB Windows in our test environment was class-best both in HP and Stock modes.
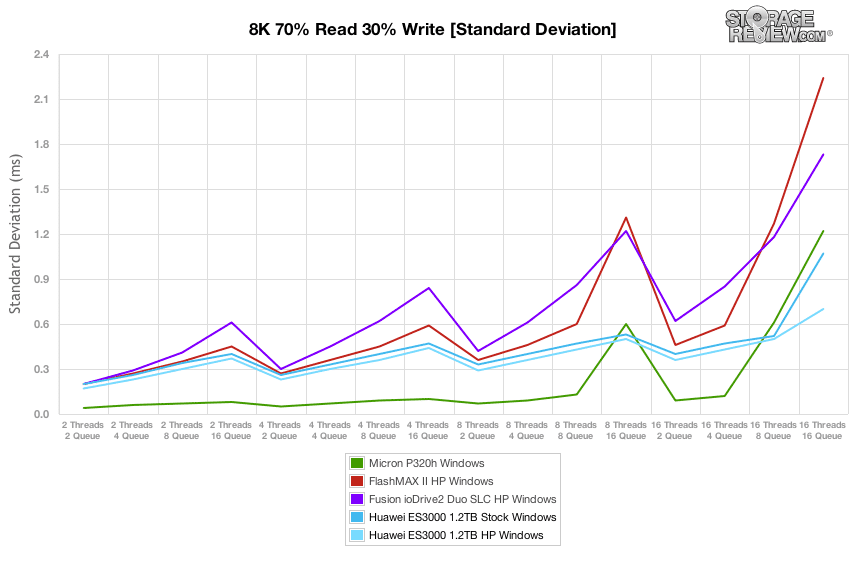
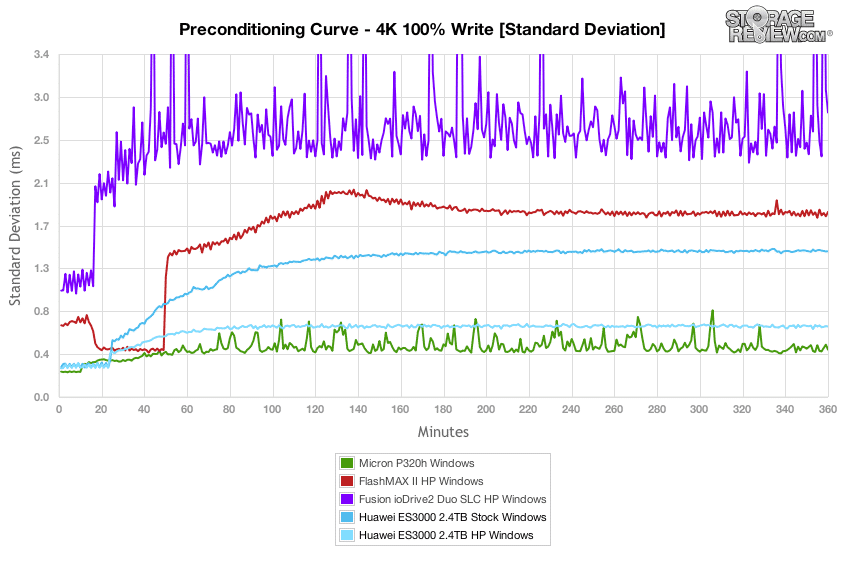
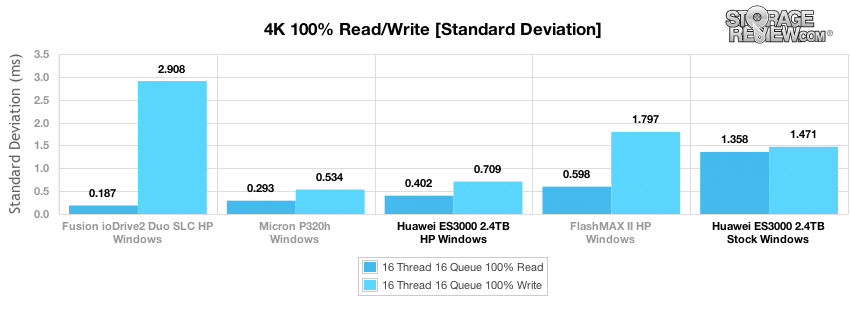
The Huawei Tecal ES3000 2.4TB Windows in HP and Stock modes fell just behind the Micron P320h for the majority of the test, though they set the best pace at the end.
Conclusion
When we evaluated the performance of the Huawei Tecal ES3000 Application Accelerator, we tested the ES3000 at both the 1.2TB and 2.4TB capacities. Additionally, obviously different environments experience different workloads and therefore choose to operate as a Linux shop or Windows shop. For that reason, we tested the ES3000 in Linux and Windows. That alone yielded a strong result for the ES3000 as it maintained similar performance across both operating systems, making it an optimal selection for organizations with either preference. Beyond that, we also tested the ES3000 in an over-provisioned HP (high performance) mode and in a Stock mode to gauge just how far the performance would drive us. With that, we clearly expected the HP mode to provide greater throughput and less latency, which it did, and we expected the same when we compared the 1.2TB and 2.4TB against one another.
Breaking down the data specifically, the Huawei Tecal ES3000 was a top-performing PCIe application accelerator dominating all other products we've tested in this category. What makes that an even more forceful statement is that the ES3000 is an MLC NAND-based device, while two of the comparables (the Fusion ioDrive2 Duo SLC and Micron P320h) are SLC-based. For the ES3000 to provide greater throughput is substantial, no doubt, but to also provide lower, more consistent response time is an even greater accomplishment.
Starting with our proprietary MarkLogic NoSQL Database environment, the Huawei Tecal ES3000 2.4TB provided extremely low average latency at 1.31ms, with peaks only reaching the 3-6ms range. That represents the lowest mark by any PCIe Application Accelerator we've tested to date. Peaks from the comparables ranged to at least 18ms. We then moved on to the Percona MySQL database test via SysBench which measures OLTP activity. Again, the ES3000 2.4TB performed excellently. At the terminal queue depth, it produced 2,735 TPS, with an average latency of 11.7ms at QD32 and an 99th percentile average at QD32 of 19.84ms. These figures were significantly better than the comparables' posted marks.
We then switched gear to move into our enterprise synthetic workload analysis spanning 4k and 8k random workloads, and the ES3000 in HP mode delivered the greatest throughput in both Windows and Linux. That attests to the level of driver refinement that Huawei has carefully engineered. In Windows, throughput topped off around 750,000 IOPS for 4k read and 250,000 IOPS for 4k write. Over to Linux, 4k performance was a bit lower in read activity, but greater in writes – roughly 600,000 IOPS and 390,000 IOPS, respectively. It is worth noting that in our preconditioning, the ES3000 was far more stable in Windows, providing less variation across burst speeds. Moving to our 8k 70/30 testing, performance was similar across operating systems, hitting 325,000 IOPS. The ES3000 also delivered excellent latency figures, providing the best in class in average latency. It also performed neck and neck with the Micron P320h in max latency and standard deviation, with the two swapping the first and second place positions.
Pros
- Excellent performance across the board in both synthetic and application workloads
- Offers strong performance across Windows and Linux environments
- Better than SLC-level performance leveraging MLC NAND
Cons
- FHHL form factor may limit some applications
- Cooling requirements mandate high-flow fan settings inside server environments
Bottom Line
The Huawei Tecal ES3000 application accelerator is an extraordinary feat of engineering that clearly establishes itself as the best-in-class performer for the highest-tier of enterprise PCIe flash storage. While Huawei may not be a well-known name in the US enterprise market, it won't take long for them to shake up the scene with products like the ES3000.


 Amazon