
Maxtor’s highly-anticipated Atlas 10k IV wraps up SCSI’s 10,000 RPM class of 2002. Formidable competitors from Seagate and especially Fujitsu await. Does the Atlas measure up? Let’s take a look!
|
 Things are a bit different this year, however. IBM was the first to the plate with a “next generation” unit, though the Ultrastar 146Z10’s areal density doesn’t quite stack up with the competition. Seagate followed with the Cheetah 10K.6. Next on the scene was Fujitsu’s MAP3147. In a pleasant surprise, Fujitsu managed to strengthen their line’s single-user performance. The net result? The MAP current rests above offerings from both IBM and Seagate in server and desktop speed.
So then, where does Maxtor’s Atlas 10k IV sit in this mix? Like the Cheetah 10K.6 and MAP3147, the flagship Atlas features four 36-gigabyte platters to pack 146 gigabytes of storage into a low-profile chassis. Like its competitors, the Maxtor comes equipped with an 8-megabyte cache. Maxtor claims an average read seek time of just 4.4 milliseconds, the most ambitious claim we’ve yet seen for a 10,000 RPM drive. Unlike Seagate and Fujitsu, Maxtor sticks with a traditional ball bearing motor rather than the fluid dynamic bearing motors found on the Cheetah and MAP. A five-year warranty protects the drive.
The Atlas 10k IV is one of the first Ultra320 SCSI drives to hit our testbed. Ultra320’s most highly-touted feature, of course, is an increase in the throughput ceiling to 320 MB/sec. Keep in mind that the current transfer rate champion, the Cheetah 15K.3, pushes 76 MB/sec in its outer sectors. While figures like these threaten Ultra2 SCSI’s 80 MB/sec barrier, Ultra160’s 160 MB/sec limit maintains plenty of headroom. It is only in multi-drive scenarios that 160 MB/sec bottlenecks arise. Our base drive tests occur with a single unit as the only active device on the host adapter. In such a setup, any performance advantages that Ultra320 (along with the requisite higher-bandwidth 64-bit PCI slots) would deliver over 160 are negligible. For our performance tests, we’re going to take advantage of the specification’s backwards compatibility and run the drive in Ultra160 mode off of our current host adapter. Bear in mind that improved bandwidth is only one of the benefits that Ultra320 delivers. A host of improvements in protocol and error correction should elevate data integrity and device interoperability to new levels.
 Maxtor makes much ado about its implementation of adaptive active filtration (AAF), dubbed MaxAdapt. AAF purportedly improves signal strength and integrity over traditional (pre-compensation) methods to further increase performance, decrease data error rates, and improve device compatibility and interoperability.
How does this final member of the class of 2002 stack up? Let’s find out!
Low-Level ResultsFor diagnostic purposes only, StorageReview measures the following low-level parameters: Average Read Access Time– An average of 25,000 random accesses of a single sector each conducted through IPEAK SPT’s AnalyzeDisk suite. The high sample size permits a much more accurate reading than most typical benchmarks deliver and provides an excellent figure with which one may contrast the claimed access time (claimed seek time + the drive spindle speed’s average rotational latency) provided by manufacturers. WB99 Disk/Read Transfer Rate – Begin– The sequential transfer rate attained by the outermost zones in the hard disk. The figure typically represents the highest sustained transfer rate a drive delivers. WB99 Disk/Read Transfer Rate – End– The sequential transfer rate attained by the innermost zones in the hard disk. The figure typically represents the lowest sustained transfer rate a drive delivers. |
For more information, please click here.
|
Note: Scores on top are better. |
|
|||||||||||||||||||||||||||
|
|
||||||||||||||||||||||||||
8B146L0 Average Read Service Time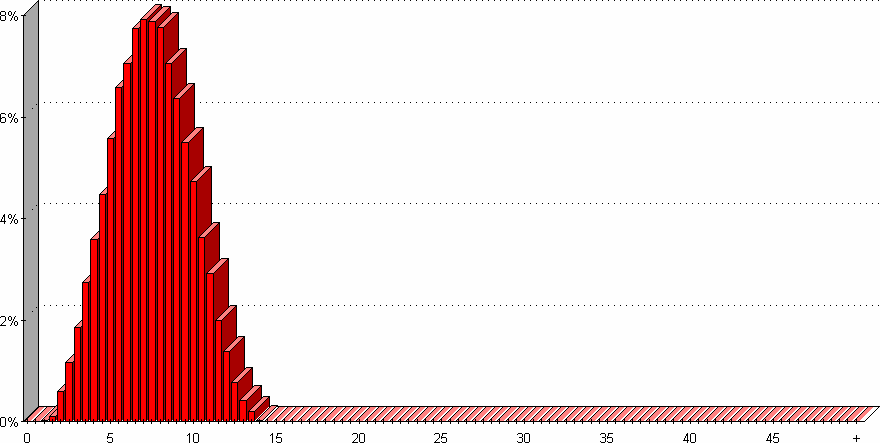 |
8B146L0 Average Write Service Time
|
||||||||||||||||||||||||||
AnalyzeDisk pegs the Atlas 10k IV’s average read access time at 7.6 milliseconds, the best score we’ve yet recorded for a 10k RPM drive. Subtracting 3 milliseconds to account for rotational latency yields an average measured seek time of 4.6 millisecond, slightly off of Maxtor’s 4.4 ms claim.
Maxtor’s score of 8.1 milliseconds in average write access times also sets a new record for 10k disks.
|
Note: Scores on top are better. |
|
|||||||||||||||||||||||||||
|
|
||||||||||||||||||||||||||
8B146L0 Transfer Rate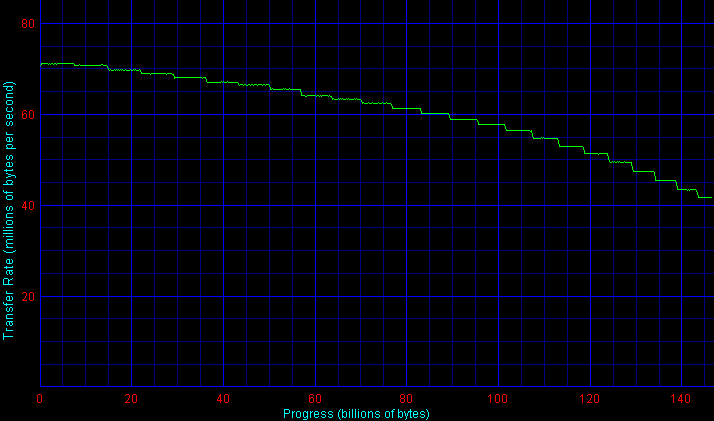
|
|||||||||||||||||||||||||||
Outer-zone transfer rates weigh in at an impressive 70.9 MB/sec. Rates decay steadily but gradually across zones to eventually yield an inner-track score of 44.1 MB/sec. Once again, both scores are great enough to set new 10,000 RPM records.
Let’s turn to some high-level tests to see how these impressive low-level translate into application performance.
Single-User PerformanceStorageReview uses the following tests to assess non-server use: StorageReview.com Office DriveMark 2002– A capture of 30 minutes of actual computer productivity use that exactingly recreates a typical office-style multitasking environment. The applications include: Outlook XP, Word XP, Excel XP, PowerPoint XP, Calypso (a freeware e-mail client), SecureCRT v3.3 (a telnet/SSH client), CuteFTP Pro v1.0 (an FTP/SSH client), ICQ 2000b), Palm Hotsync 4.0, Gravity 2.3 (a Usenet/newsgroups client), PaintShop Pro v7.0, Media Player v8 for the occasional MP3, and Internet Explorer 6.0. StorageReview.com High-End DriveMark 2002– A capture of VeriTest’s Content Creation Winstone 2001 suite. Applications include Adobe Photoshop v5.5, Adobe Premiere v5.1, Macromedia Director v8.0, Macromedia Dreamweaver v3.0, Netscape Navigator v4.73, and Sonic Foundry Sound Forge v4.5. Unlike typical productivity applications, high-end audio- and video- editing programs are run in a more serial and less multitasked manner. The High-End DriveMark includes significantly more sequential transfers and write (as opposed to read) operations. |
StorageReview.com Bootup DriveMark 2002– A capture of the rather unusual Windows XP bootup process. Windows XP’s boot procedure involves significantly different access patterns and queue depths than those found in other disk accesses. This test recreates Windows XP’s bootup from the initial bootstrap load all the way to initialization and loading of the following memory-resident utilities: Dimension4 (a time synchronizer), Norton Antivirus 2002 AutoProtect, Palm Hotsync v4.0, and ICQ 2000b.
StorageReview.com Gaming DriveMark 2002– A weighted average of the disk accesses featured in five popular PC games: Lionhead’s Black & White v1.1, Valve’s Half-Life: Counterstrike v1.3, Blizzard’s Diablo 2: Lord of Destruction v1.09b, Maxis’s The Sims: House Party v1.0, and Epic’s Unreal Tournament v4.36. Games, of course, are not multitasked- all five titles were run in a serial fashion featuring approximately half an hour of play time per game.
For more information, please click here.
|
Note: Scores on top are better. |
|
|||||||||||||||||||||||||||
|
|
||||||||||||||||||||||||||
|
|
||||||||||||||||||||||||||
The Atlas 10k IV stands as the first 10,000 RPM drive to break the 500 IOs/sec barrier in the SR Office DriveMark 2002. With a score of 503, Maxtor’s drive edges by the Fujitsu MAP3147 by a 2% margin and bests the Seagate Cheetah 10K.6 by a more substantial 10%.
Margins are a tad closer in the SR High-End DriveMark 2002. The Atlas and MAP virtually tie while the Cheetah lags the two by about 6%.
The SR Bootup DriveMark 2002 is a special case. Windows XP’s bootup process takes special steps to optimize boot speed. Substantially increased queue depths are a large side effect. In this test the MAP leaves all competitors, including the Atlas 10k IV, in the dust.
It’s in the SR Gaming DriveMark 2002, of all things, that the Atlas opens up the widest gap between itself and the competition. Maxtor’s drive leads Fujitsu’s here by about 3% while powering ahead of the Seagate by nearly a 20% margin.
Multi-User PerformanceStorageReview uses the following tests to assess server performance: StorageReview.com File Server DriveMark 2002– A mix of synthetically-created reads and writes through IOMeter that attempts to model the heavily random access that a dedicated file server experiences. Individual tests are run under loads with 1 I/O, 4 I/Os, 16 I/Os, and 64 I/Os outstanding. The Server DriveMark is a convenient at-a-glance figure derived from the weighted average of results obtained from the four different loads. StorageReview.com Web Server DriveMark 2002– A mix of synthetically-created reads through IOMeter that attempts to model the heavily random access that a dedicated web server experiences. Individual tests are run under loads with 1 I/O, 4 I/Os, 16 I/Os, and 64 I/Os outstanding. The Server DriveMark is a convenient at-a-glance figure derived from the weighted average of results obtained from the four different loads. For more information click here. |
|
Note: Scores on top are better. |
|
|||||||||||||||||||||||||||
|
|
||||||||||||||||||||||||||
These server performance measurements turn up an interesting surprise. Multi-user performance has traditionally been a Fujitsu stronghold yet Maxtor’s newcomer manages to turn in the top scores here. In the SR File Server DriveMark 2002, the Atlas bests the Fujitsu by a slim but significant 4% margin while also fending off the Cheetah 10K.6 in the more read-intensive Web Server DriveMark with a 2% lead.
Legacy PerformanceeTesting Lab’s WinBench 99 Disk WinMark tests are benchmarks that attempt to measure desktop performance through a rather dated recording of high-level applications. Despite their age, the Disk WinMarks are somewhat of an industry standard. The following results serve only as a reference; SR does not factor them into final judgments and recommends that readers do the same. |
|
Note: Scores on top are better. |
|
|||||||||||||||||||||||||||
|
|
||||||||||||||||||||||||||
Heat and NoiseIdle Noise– The sound pressure emitted from a drive measured at a distance of 18 millimeters. The close-field measurement allows for increased resolution between drive sound pressures and eliminates interactions from outside environmental noise. Note that while the measurement is an A-weighted decibel score that weighs frequencies in proportion to human ear sensitivity, a low score does not necessarily predict whether or not a drive will exhibit a high-pitch whine that some may find intrusive. Conversely, a high score does not necessarily indicate that the drive exhibits an intrusive noise envelope. Net Drive Temperature– The highest temperature recorded from a 16-point sample of a drive’s top plate after it has been under heavy load for 80 minutes. The figures provided are net temperatures representing the difference between the measured drive temperature and ambient temperature. For more information, please click here. |
|
Note: Scores on top are better. |
|
||||||||||||||||||||||||
|
|
|||||||||||||||||||||||
Objectively speaking, the Atlas 10k IV’s idle noise falls between the floor presented by the MAP3147 and the noisier Cheetah 10K.6. Though most ATA drives still register significantly quieter than the Atlas, it nonetheless follows the laudable trend of reduced noise. The lack of high-pitch whine and the subtle nature of the drive’s midrange noise should allow most workstation and desktop users easy integration.
Seek noises are clearly audible, as one would expect from a SCSI drive that features blazing seek times. Subjectively speaking, the Cheetah, MAP, and Atlas all produce about the same rumble while IBM’s Ultrastar 146Z10 is significantly louder than the trio.
ReliabilityThe StorageReview.com Reliability Survey aims to amalgamate individual reader experiences with various hard disks into a comprehensive warehouse of information from which meaningful results may be extracted. A multiple-layer filter sifts through collected data, silently omitting questionable results or results from questionable participants. A proprietary analysis engine then processes the qualified dataset. SR presents results to readers through a percentile ranking system. According to filtered and analyzed data collected from participating StorageReview.com readers, the |
According to filtered and analyzed data collected from participating StorageReview.com readers, a predecessor of the
Maxtor Atlas 10k IV, the
Maxtor Atlas 10k III
, is more reliable than of the other drives in the survey that meet a certain minimum floor of participation.
Note that the percentages in bold above may change as more information continues to be collected and analyzed. For more information, to input your experience with these and/or other drives, and to view comprehensive results, please visit the SR Drive Reliability Survey.
ConclusionThese performance results leave little doubt that Maxtor’s Atlas 10k IV is the king of its generation. The Atlas simply outperforms the competition from Seagate, Fujitsu, and IBM in both desktop and server scenarios. Our only small caveat is the drive’s relatively high operating temperature; its likely, though, that any setup expecting a SCSI drive will be set up with good airflow. In the past, the Atlas 10k series has been notorious for its relatively long time-to-market window. Offerings from IBM, Seagate, and Fujitsu are all widely available. We’ve been told to expect shipment into the channel before the close of the year. Let’s hope this prediction pans out! |