

|
Then came the 75GXP. Although the drive continued to deliver first-rate size and speed, an unusually large number of users complained about reliability problems with the model. A similar though lesser situation arose with the 60GXP, though its unclear whether or not users unfairly attributed “mundane” problems that occur with all drives (and/or all users) to the 60GXP’s lineage. SR does not hold an opinion one way or another on the matter; we simply point out what we’ve observed.
 Consumer confidence in the Deskstar line has been shaken regardless of the legitimacy of these problems. Fortunately, the chorus of reported troubles has subsided with the 120GXP. Even now reader interest in IBM’s latest runs high.
The Deskstar 180GXP is IBM’s entry into the 60 GB/platter game. These 7200 RPM drives feature up to three platters, yielding a flagship capacity of 180 gigabytes. IBM specifies average read seek times at 8.5 milliseconds.
Though the 180 GB and 120 GB models are purportedly available in models featuring both 2 megabytes and 8 megabytes of buffer, in practice the 180-gig version is always equipped with an 8-meg cache while the 120-gig unit features 2 megabytes. Check the suffix of the drive’s model number when ordering. A “-0” signifies a 2-meg buffer while a “-1” indicates 8 megabytes.
There’s more at stake than just performance when it comes to buffer sizes. All IBM ATA drives purchased after November 15th, 2002 are backed by a one-year warranty unless the drive features an 8-meg buffer. IBM provides a three-year warranty on drives equipped with the larger buffers.
IBM debuts fluid dynamic bearing (FDB) motors with the 180GXP. Already in use by some competitors, FDB motors significantly reduce idle noise floors when contrasted with the more traditional ball-bearing paradigm. FDB motors also increase a drive’s shock resistance, hopefully improving a drive’s overall dependability.
 Our review unit is a 180-gigabyte model equipped with an 8-megabyte cache. To access the drive’s full 180 GB capacity we utilized a Promise Ultra133 TX2 controller. Remember that you must have a motherboard or an ATA controller that supports 48-bit LBA addressing to utilize the full capacity of drives greater than 137 GB in size. We’re also planning a look at a 120-gig 180GXP with a 2-megabyte buffer in the near future.
Does the Deskstar 180GXP rate when put up against the competition? Let’s take a look!
Low-Level ResultsFor diagnostic purposes only, StorageReview measures the following low-level parameters: Average Read Access Time– An average of 25,000 random accesses of a single sector each conducted through IPEAK SPT’s AnalyzeDisk suite. The high sample size permits a much more accurate reading than most typical benchmarks deliver and provides an excellent figure with which one may contrast the claimed access time (claimed seek time + the drive spindle speed’s average rotational latency) provided by manufacturers. WB99 Disk/Read Transfer Rate – Begin– The sequential transfer rate attained by the outermost zones in the hard disk. The figure typically represents the highest sustained transfer rate a drive delivers. WB99 Disk/Read Transfer Rate – End– The sequential transfer rate attained by the innermost zones in the hard disk. The figure typically represents the lowest sustained transfer rate a drive delivers. |
For more information, please click here.
|
Note: Scores on top are better. |
|
||||||||||||||
|
IC35L180AVV207-1 Average Read Service Time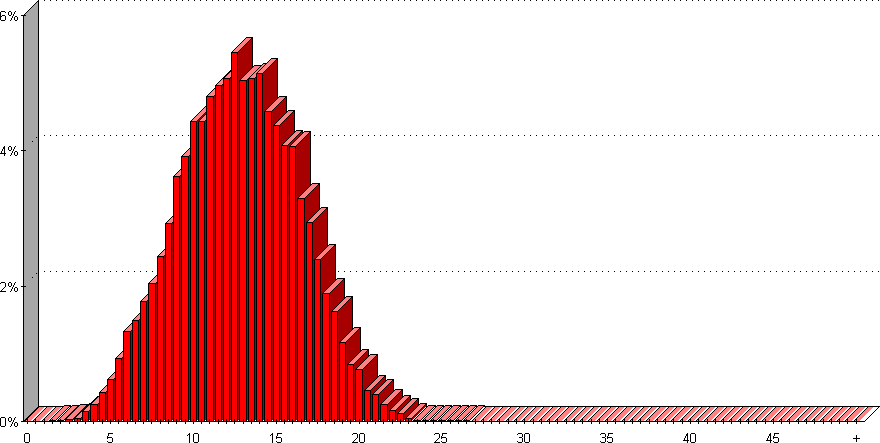 |
|||||||||||||
AnalyzeDisk places the Deskstar 180GXP’s access time at 12.9 milliseconds. Subtracting 4.2 milliseconds to account for the rotational latency of a 7200 RPM spindle speed yields a measured seek time of 8.7 milliseconds, slightly above IBM’s 8.5 ms claim. Though not quite as swift as the Maxtor DiamondMax D740X, the 180GXP’s access time nonetheless compares favorably against WD’s Caviar WD2000JB and Seagate’s Barracuda ATA V.
The use of an external controller (the Promise Ultra133) and its associated driver unfortunately makes it more difficult to consistently disable write caching which precludes us from presenting average write access times.
|
Note: Scores on top are better. |
|
|||||||||||||||||||||||||||
|
|
||||||||||||||||||||||||||
IC35L180AVV207-1 Transfer Rate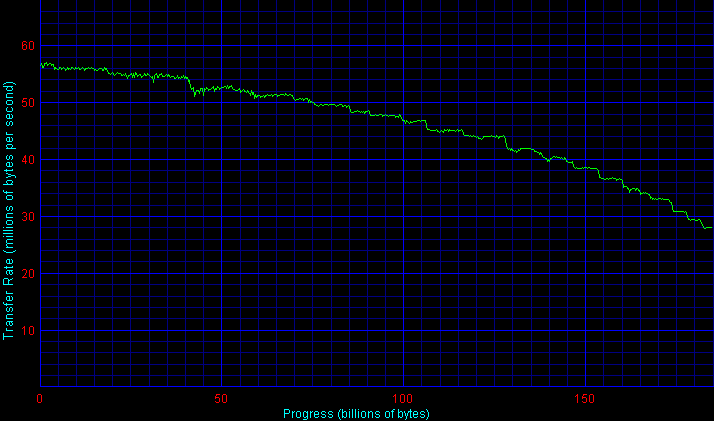
|
|||||||||||||||||||||||||||
Our first evaluation sample turned in a rather nasty-looking sawtooth transfer rate graph. The dips are similar to those experienced while running the transfer rate test with a stray background test running; even so, this drive was tested in conditions identical to that of all others. A second sample rectified the problem. Our first unit was likely defective.
The 180GXP’s outer-zone transfer rates weigh in at a respectable 56.2 MB/sec, falling just shy of Western Digital’s WD2000JB. Similarly, an inner-zone rate of 30.7 MB/sec places the Deskstar near the top of the heap.
Single-User PerformanceStorageReview uses the following tests to assess non-server use: StorageReview.com Office DriveMark 2002– A capture of 30 minutes of actual computer productivity use that exactingly recreates a typical office-style multitasking environment. The applications include: Outlook XP, Word XP, Excel XP, PowerPoint XP, Calypso (a freeware e-mail client), SecureCRT v3.3 (a telnet/SSH client), CuteFTP Pro v1.0 (an FTP/SSH client), ICQ 2000b), Palm Hotsync 4.0, Gravity 2.3 (a Usenet/newsgroups client), PaintShop Pro v7.0, Media Player v8 for the occasional MP3, and Internet Explorer 6.0. StorageReview.com High-End DriveMark 2002– A capture of VeriTest’s Content Creation Winstone 2001 suite. Applications include Adobe Photoshop v5.5, Adobe Premiere v5.1, Macromedia Director v8.0, Macromedia Dreamweaver v3.0, Netscape Navigator v4.73, and Sonic Foundry Sound Forge v4.5. Unlike typical productivity applications, high-end audio- and video- editing programs are run in a more serial and less multitasked manner. The High-End DriveMark includes significantly more sequential transfers and write (as opposed to read) operations. |
StorageReview.com Bootup DriveMark 2002– A capture of the rather unusual Windows XP bootup process. Windows XP’s boot procedure involves significantly different access patterns and queue depths than those found in other disk accesses. This test recreates Windows XP’s bootup from the initial bootstrap load all the way to initialization and loading of the following memory-resident utilities: Dimension4 (a time synchronizer), Norton Antivirus 2002 AutoProtect, Palm Hotsync v4.0, and ICQ 2000b.
StorageReview.com Gaming DriveMark 2002– A weighted average of the disk accesses featured in five popular PC games: Lionhead’s Black & White v1.1, Valve’s Half-Life: Counterstrike v1.3, Blizzard’s Diablo 2: Lord of Destruction v1.09b, Maxis’s The Sims: House Party v1.0, and Epic’s Unreal Tournament v4.36. Games, of course, are not multitasked- all five titles were run in a serial fashion featuring approximately half an hour of play time per game.
For more information, please click here.
|
Note: Scores on top are better. |
|
|||||||||||||||||||||||||||
|
|
||||||||||||||||||||||||||
|
|
||||||||||||||||||||||||||
The Deskstar 180GXP turns in a StorageReview.com Office DriveMark 2002 of 418 IOs/sec, second only to Western Digital’s Caviar WD2000JB by a gap of about 3%. Thus, in this most heavily-weighted of our tests, IBM’s drive turns in by far the best showing by a non-WD drive since we deployed our third-generation testbed over a year ago.
In the SR High-End DriveMark 2002, the margin widens to about 11%. In absolute terms, however, the Deskstar’s 382 IOs/sec are nothing to sneeze at.
A score of 307 IOs/sec prevents the 180GXP from keeping up with the WD2000JB in the SR Bootup DriveMark 2002, a replay of Windows XP’s bootup process. XP’s optimizations result in higher than normal queue depths in this test.
Finally, the Deskstar regains ground in the SR Gaming DriveMark 2002. A score of 528 IOs/sec places the drive within striking distance of the Caviar.
Multi-User PerformanceStorageReview uses the following tests to assess server performance: StorageReview.com File Server DriveMark 2002– A mix of synthetically-created reads and writes through IOMeter that attempts to model the heavily random access that a dedicated file server experiences. Individual tests are run under loads with 1 I/O, 4 I/Os, 16 I/Os, and 64 I/Os outstanding. The Server DriveMark is a convenient at-a-glance figure derived from the weighted average of results obtained from the four different loads. StorageReview.com Web Server DriveMark 2002– A mix of synthetically-created reads through IOMeter that attempts to model the heavily random access that a dedicated web server experiences. Individual tests are run under loads with 1 I/O, 4 I/Os, 16 I/Os, and 64 I/Os outstanding. The Server DriveMark is a convenient at-a-glance figure derived from the weighted average of results obtained from the four different loads. For more information click here. |
|
Note: Scores on top are better. |
|
|||||||||||||||||||||||||||
|
|
||||||||||||||||||||||||||
Equipped with superior access times, IBM’s ATA drives have traditionally done very well in our Server DriveMarks when contrasted with the competition. The Deskstar 180GXP manages to carry on the banner albeit by some pretty thin margins.
Legacy PerformanceeTesting Lab’s WinBench 99 Disk WinMark tests are benchmarks that attempt to measure desktop performance through a rather dated recording of high-level applications. Despite their age, the Disk WinMarks are somewhat of an industry standard. The following results serve only as a reference; SR does not factor them into final judgments and recommends that readers do the same. |
|
Note: Scores on top are better. |
|
|||||||||||||||||||||||||||
|
|
||||||||||||||||||||||||||
Heat and NoiseIdle Noise– The sound pressure emitted from a drive measured at a distance of 18 millimeters. The close-field measurement allows for increased resolution between drive sound pressures and eliminates interactions from outside environmental noise. Note that while the measurement is an A-weighted decibel score that weighs frequencies in proportion to human ear sensitivity, a low score does not necessarily predict whether or not a drive will exhibit a high-pitch whine that some may find intrusive. Conversely, a high score does not necessarily indicate that the drive exhibits an intrusive noise envelope. Net Drive Temperature– The highest temperature recorded from a 16-point sample of a drive’s top plate after it has been under heavy load for 80 minutes. The figures provided are net temperatures representing the difference between the measured drive temperature and ambient temperature. For more information, please click here. |
|
Note: Scores on top are better. |
|
|||||||||||||||||||||||||||
|
|
||||||||||||||||||||||||||
The Deskstar 180GXP’s fluid dynamic bearing motors impact hugely in our objective idle noise measurements. A sound pressure level measurement of 40.1 dB/A at 18 millimeters places IBM’s drive squarely in territory previously plumbed only by Seagate’s Barracuda ATA series. It’s practically impossible to hear this drive over even the quietest CPU and power supply fans. Subjectively speaking, seeks are also muted- audible if one concentrates, but not obtrusive by any means.
On the other hand, the 180GXP is the warmest ATA drive we’ve yet measured. Keep in mind though that the drive’s 22.1 degrees Celsius above ambient simply places it at the top of a relatively tight band of measurements. It certainly doesn’t approach the heat levels generated by today’s SCSI units and should integrate well into any system that features reasonable ventilation.
ReliabilityThe StorageReview.com Reliability Survey aims to amalgamate individual reader experiences with various hard disks into a comprehensive warehouse of information from which meaningful results may be extracted. A multiple-layer filter sifts through collected data, silently omitting questionable results or results from questionable participants. A proprietary analysis engine then processes the qualified dataset. SR presents results to readers through a percentile ranking system. According to filtered and analyzed data collected from participating StorageReview.com readers, the |
According to filtered and analyzed data collected from participating StorageReview.com readers, a predecessor of the
IBM Deskstar 180GXP, the
IBM Deskstar 120GXP
, is more reliable than of the other drives in the survey that meet a certain minimum floor of participation.
Note that the percentages in bold above may change as more information continues to be collected and analyzed. For more information, to input your experience with these and/or other drives, and to view comprehensive results, please visit the SR Drive Reliability Survey.
ConclusionWith the Deskstar 180GXP IBM succeeds in combining the best attributes of the Western Digital Caviar WD2000JB and the Seagate Barracuda ATA V. The 180GXP rivals the WD2000JB’s performance while mimicking the acoustic floor of the ‘Cuda V. Those in the high-end ATA drive market who can overlook the WD’s 20 extra GB of storage and slight performance advantage when it comes to high-end desktop usages (photo editing, sound/video editing) need look no further than the Deskstar 180GXP. |


 Amazon
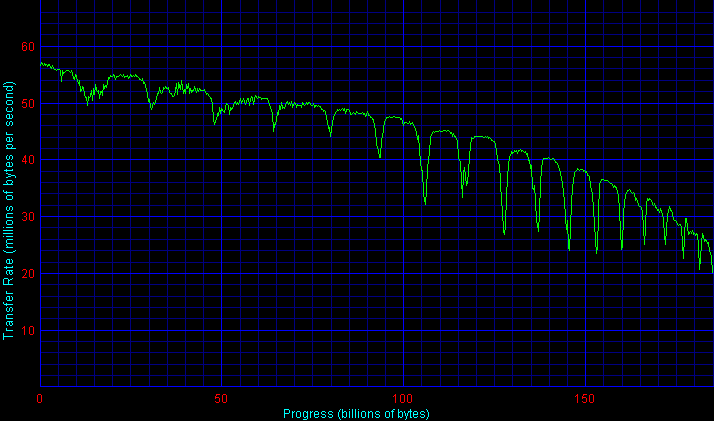