

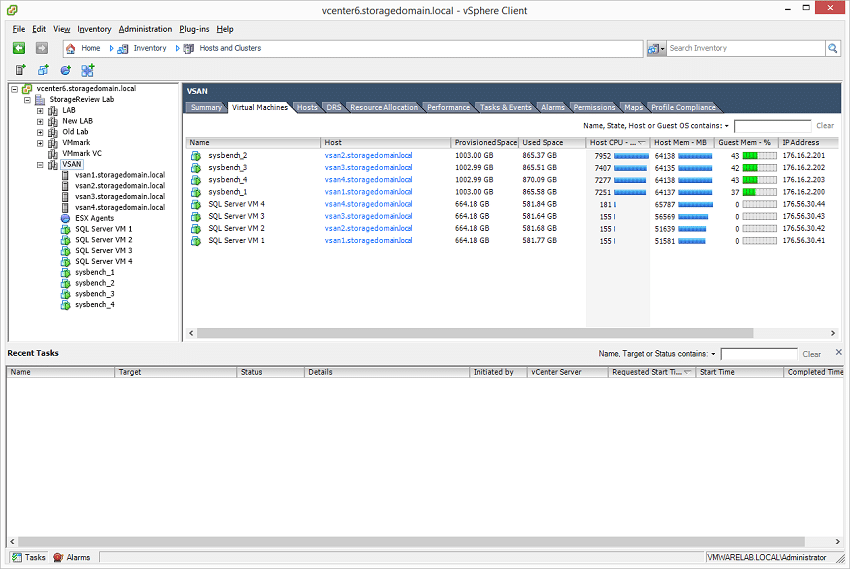
To measure the performance of the VMware VSAN cluster in transactional database workloads, we first leverage the Sysbench OLTP benchmark, paying close attention to total aggregate performance. The Sysbench OLTP benchmark runs on top of Percona MySQL leveraging the InnoDB storage engine operating inside a CentOS installation. While a traditional SAN infrastructure can better cope with large single workloads, hyper-converged systems are designed to spread that load across all nodes in the system. To that end, we deployed four Sysbench VMs on the VSAN cluster, 1 per node, and measured the total performance seen on the cluster with all operating simultaneously.
Dell PowerEdge R730xd VMware VSAN Specifications
- Dell PowerEdge R730xd Servers (x4)
- CPUs: Eight Intel Xeon E5-2697 v3 2.6GHz (14C/28T)
- Memory: 64 x 16GB DDR4 RDIMM
- SSD: 16 x 800GB Solid State Drive SAS Mix Use MLC 12Gbps
- HDD: 80 x 1.2TB 10K RPM SAS 6Gbps
- Networking: 4 x Intel X520 DP 10Gb DA/SFP+, + I350 DP 1Gb Ethernet
- Storage Capacity: 86.46TB
Sysbench Performance
Each Sysbench VM is configured with three vDisks, one for boot (~92GB), one with the pre-built database (~447GB) and the third for the database that we will test (400GB). From a system resource perspective, we configured each VM with 16 vCPUs, 64GB of DRAM and leveraged the LSI Logic SAS SCSI controller. It should be stressed that this configuration wasn’t designed to completely saturate all resources in our VSAN cluster and in fact it left many resources left over. Under full load with the benchmark running, we saw Sysbench VMs consume between 7,200 and 7,900MHz, with total host resources indicating about 10,000MHz utilized. That left over plenty of additional CPU headroom, as well as some storage I/O headroom for additional activities. Further, we had only consumed roughly 3.5TB of the 86.46TB total VSAN storage capacity in our configuration. In later performance analysis sections we will go into greater detail covering multi-workload tests as well as scaled sysbench VM testing.
Sysbench Testing Configuration (per VM)
- CentOS 6.3 64-bit
- Storage Footprint: 1TB, 800GB used
- Percona XtraDB 5.5.30-rel30.1
- Database Tables: 100
- Database Size: 10,000,000
- Database Threads: 32
- RAM Buffer: 24GB
- Test Length: 12 hours
- 6 hours preconditioning 32 threads
- 1 hour 32 threads
- 1 hour 16 threads
- 1 hour 8 threads
- 1 hour 4 threads
- 1 hour 2 threads
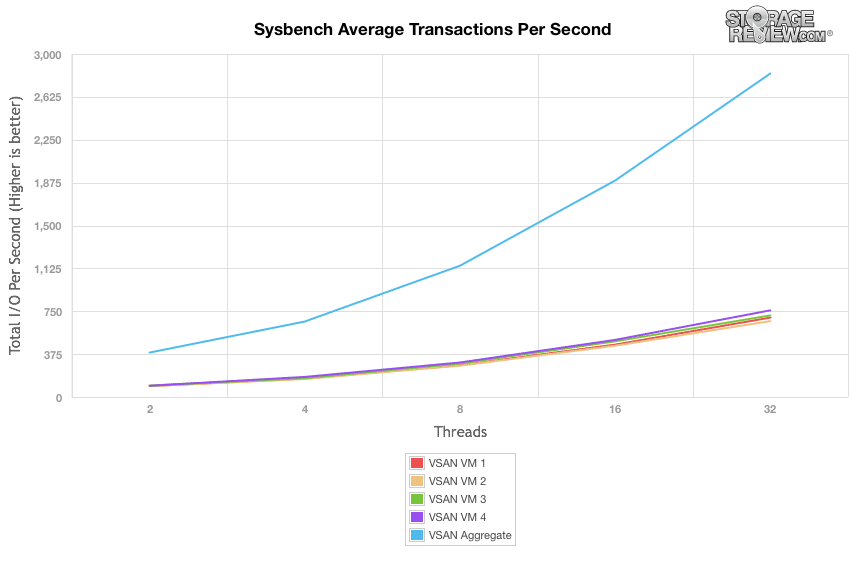
With 4 VMs operating simultaneously across the cluster, we measured peak 32-thread individual VM performance of 694TPS, 664TPS, 713TPS and 758TPS across the hosts. This gave us an average of 707TPS from all four VMs, with the slowest being 6.1% under the average and the fastest being 7.2% faster than average. While not completely even, the Sysbench testing didn’t have a ton of variation across the cluster. In total we measured an aggregate 2,829TPS across the VSAN cluster with 4 Sysbench VMs running.
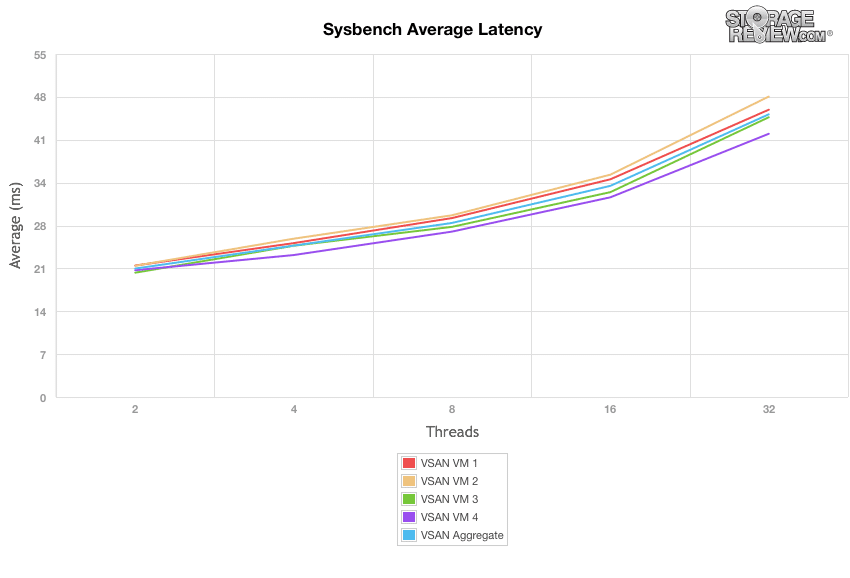
Looking at the average latency in the Sysbench hyper-converged test, we saw response times measuring 46.07ms, 48.18ms, 44.86ms and 42.21ms under full load. Average across the entire cluster came in at 45.33ms. From the fastest to the slowest VM, we saw a 12.3% spread in average latency.
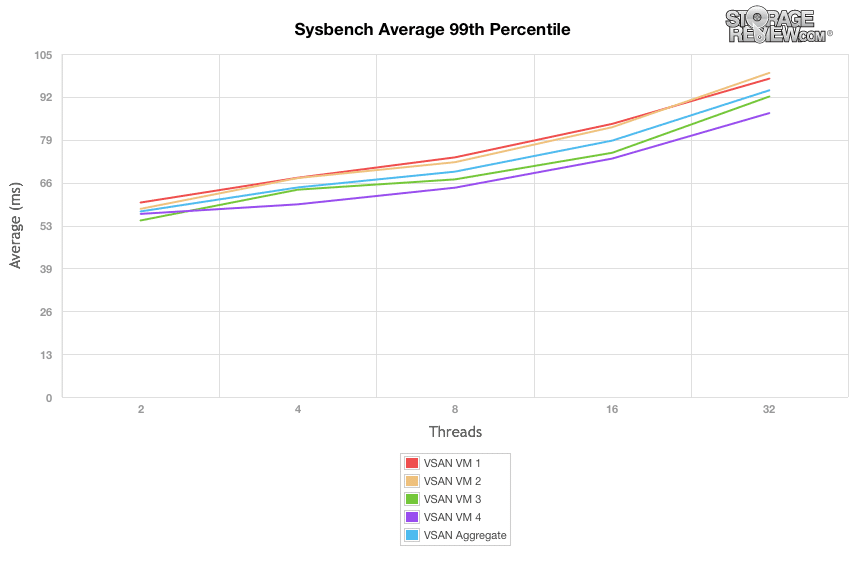
In the last section of the Sysbench MySQL test, we look at how well the platform fared when measuring 99th percentile latency. This is an area where higher maximum response times will increase this reporting value. Across the 4 Sysbench VMs, we saw times under peak load ranging from 86.91ms up to 99.23ms. Max latency during this period measured between 422ms up to 480ms on VSAN.
Hyper-converged infrastructure is best leveraged by spreading the load over all of the compute and storage resources, which isn’t necessarily the case with traditional IT infrastructure. By leveraging multiple databases across the VSAN nodes, we get a more clear picture of aggregate performance. In this case it’s a similar workload running across the nodes, we’ll look into multiple workloads shortly. Overall though, this type of configuration is critical to extracting the best possible performance out of VSAN or any other hyper-converged solution.
Next Up: VSAN Microsoft SQL Server Performance Report
VMware Virtual SAN Review: Overview and Configuration
VMware Virtual SAN Review: VMmark Performance
VMware Virtual SAN Review: Sysbench OLTP Performance
VMware Virtual SAN Review: SQL Server Performance
VMware Virtual SAN Review: Scaled Sysbench OLTP Performance
VMware Virtual SAN Review: HCIbench Synthetic Performance


 Amazon