

Note: Since the publication of this review, this drive has been retested under Testbed4, a newer hardware/software/benchmark platform. Please see this article for updated results. This review remains for reference purposes only.
|
Finally, however, things are changing. Western Digital has recently began shipping the Caviar WD2500KS, the firm’s first from-the-ground-up SATA design. WD actually labels the drive “SATA II” since it implements the 300 MB/sec transfer rates found in the SATA-2 spec. Regrettably, despite the “SATA II” moniker, the WD2500KS does not implement SATA Native Command Queuing (NCQ). Though competitors such as Seagate and Maxtor have commenced with NCQ inclusion even on desktop-oriented drives, WD claims that NCQ does not help and can even hurt single-user performance.
 Like all Caviars, the WD2500KS is built around a 7200 RPM spindle. WD claims an 8.9 millisecond access time. Though they have demonstrated the ability to work with 100 GB platters in the WD3200JD, the firm has chosen to go with three of the more conservative, last-generation 83 GB disks to yield a capacity of 250 GB. Most interesting, however, is the drive’s buffer size: WD has followed Maxtor’s lead and moved to 16 megabytes.
In fact, the firm dubs the WD2500KS as the “Caviar SE16,” or Special Edition 16, perhaps an attempt to reclaim the magic of the original “Special Edition.” Long-time readers surely recall the original WD1000BB SE that broke industry paradigm by quadrupling buffer sizes from a standard two megabytes to a then unheard of eight.
As a capacious 7200 RPM drive marketed squarely at leading-edge individuals, the Caviar WD2500KS will be compared against the following drives in the tests that follow:
Hitachi Deskstar 7K400 (400 GB) | Previous-generation competing unit |
Maxtor MaXLine III (300 GB) | Current-generation competing unit |
Samsung SpinPoint P80 (160 GB) | Previous-generation competing unit |
Seagate Barracuda 7200.8 (400 GB) | Current-generation competing unit |
Western Digital Caviar WD3200JD (320 GB) | Manufacturer’s current SATA-I offering |
Low-Level ResultsFor diagnostic purposes only, StorageReview measures the following low-level parameters: Average Read Access Time– An average of 25,000 random accesses of a single sector each conducted through IPEAK SPT’s AnalyzeDisk suite. The high sample size permits a much more accurate reading than most typical benchmarks deliver and provides an excellent figure with which one may contrast the claimed access time (claimed seek time + the drive spindle speed’s average rotational latency) provided by manufacturers. WB99 Disk/Read Transfer Rate – Begin– The sequential transfer rate attained by the outermost zones in the hard disk. The figure typically represents the highest sustained transfer rate a drive delivers. WB99 Disk/Read Transfer Rate – End– The sequential transfer rate attained by the innermost zones in the hard disk. The figure typically represents the lowest sustained transfer rate a drive delivers. |
For more information, please click here.
|
Note: Scores on top are better. |
|
||||||||||||||||||||
|
WD2500KS Average Read Service Time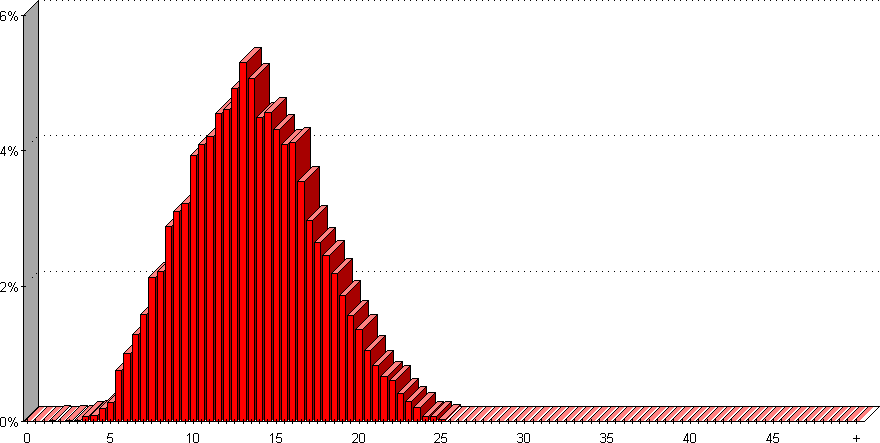
|
|||||||||||||||||||
|---|---|---|---|---|---|---|---|---|---|---|---|---|---|---|---|---|---|---|---|---|
An access time of 13.6 milliseconds translates into a measured seek time of 9.4 milliseconds- the WD2500KS thus misses its claim by half a millisecond, somewhat disappointing given the WD3200JD’s proficient showing.
|
Note: Scores on top are better. |
|
|||||||||||||||||||||||||||||||||||||||
|
|
||||||||||||||||||||||||||||||||||||||
WD2500KS Transfer Rate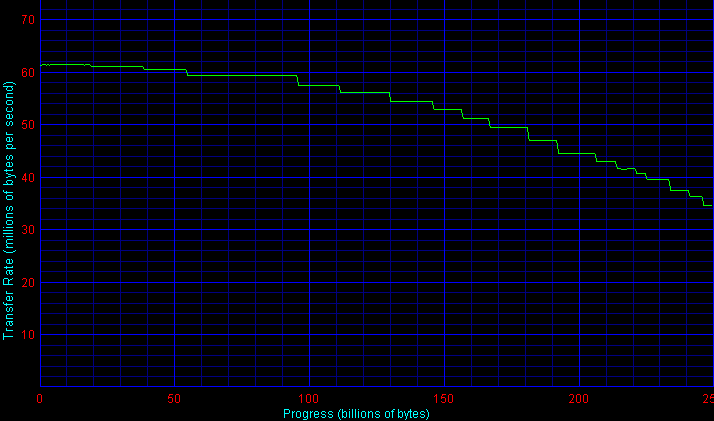
|
|||||||||||||||||||||||||||||||||||||||
An outer-zone transfer rate of 61.3 MB/sec and an inner-zone rate of 37.4 MB/sec weigh in just as one would expect given the drive’s 83 GB platters. These scores place the WD2500KS in the lead among 80 GB/platter drives but trail most of the showings delivered by drives featuring more contemporary 100+ GB platters.
Single-User PerformanceStorageReview uses the following tests to assess non-server use: StorageReview.com Office DriveMark 2002– A capture of 30 minutes of actual computer productivity use that exactingly recreates a typical office-style multitasking environment. The applications include: Outlook XP, Word XP, Excel XP, PowerPoint XP, Calypso (a freeware e-mail client), SecureCRT v3.3 (a telnet/SSH client), CuteFTP Pro v1.0 (an FTP/SSH client), ICQ 2000b), Palm Hotsync 4.0, Gravity 2.3 (a Usenet/newsgroups client), PaintShop Pro v7.0, Media Player v8 for the occasional MP3, and Internet Explorer 6.0. StorageReview.com High-End DriveMark 2002– A capture of VeriTest’s Content Creation Winstone 2001 suite. Applications include Adobe Photoshop v5.5, Adobe Premiere v5.1, Macromedia Director v8.0, Macromedia Dreamweaver v3.0, Netscape Navigator v4.73, and Sonic Foundry Sound Forge v4.5. Unlike typical productivity applications, high-end audio- and video- editing programs are run in a more serial and less multitasked manner. The High-End DriveMark includes significantly more sequential transfers and write (as opposed to read) operations. |
StorageReview.com Bootup DriveMark 2002– A capture of the rather unusual Windows XP bootup process. Windows XP’s boot procedure involves significantly different access patterns and queue depths than those found in other disk accesses. This test recreates Windows XP’s bootup from the initial bootstrap load all the way to initialization and loading of the following memory-resident utilities: Dimension4 (a time synchronizer), Norton Antivirus 2002 AutoProtect, Palm Hotsync v4.0, and ICQ 2000b.
StorageReview.com Gaming DriveMark 2002– A weighted average of the disk accesses featured in five popular PC games: Lionhead’s Black & White v1.1, Valve’s Half-Life: Counterstrike v1.3, Blizzard’s Diablo 2: Lord of Destruction v1.09b, Maxis’s The Sims: House Party v1.0, and Epic’s Unreal Tournament v4.36. Games, of course, are not multitasked- all five titles were run in a serial fashion featuring approximately half an hour of play time per game.
For more information, please click here.
|
Note: Scores on top are better. |
The Caviar WD2500KS’s StorageReview Office DriveMark of 461 I/Os per second builds upon the WD3200JD’s score by about 6%. Though not a huge gain in an absolute sense, the improvement nonetheless represents the first significant gain in WD’s 7200 RPM score in years and allows the WD2500KS to come within striking distance of category leaders Maxtor and Hitachi.
In the SR High-End DriveMark, the WD2500KS turns in 465 I/Os per second and achieves a solid second-place showing that lags Maxtor’s unit by just 1%.
The WD2500KS continues to improve upon the WD3200JD with an SR Bootup DriveMark of 418 I/Os per second. It trails the category-leading Maxtor, however, by a sizable 17% gap.
Lastly, in the SR Gaming DriveMark, 578 I/Os per second secures the WD2500KS third place, again behind the MaXLine and Deskstar.
Multi-User PerformanceStorageReview uses the following tests to assess server performance: StorageReview.com File Server DriveMark 2002– A mix of synthetically-created reads and writes through IOMeter that attempts to model the heavily random access that a dedicated file server experiences. Individual tests are run under loads with 1 I/O, 4 I/Os, 16 I/Os, and 64 I/Os outstanding. The Server DriveMark is a convenient at-a-glance figure derived from the weighted average of results obtained from the four different loads. StorageReview.com Web Server DriveMark 2002– A mix of synthetically-created reads through IOMeter that attempts to model the heavily random access that a dedicated web server experiences. Individual tests are run under loads with 1 I/O, 4 I/Os, 16 I/Os, and 64 I/Os outstanding. The Server DriveMark is a convenient at-a-glance figure derived from the weighted average of results obtained from the four different loads. For more information click here. |
|
Note: Scores on top are better. |
|
|||||||||||||||||||||||||||||||||||||||
|
|
||||||||||||||||||||||||||||||||||||||
Despites its 13.6 millisecond access time, the Caviar WD2500KS manages to top the board in the SR File Server DriveMark. The drive’s score of 131 I/Os per second leads the Samsung SpinPoint and Western Digital’s own WD3200JD by a 5% margin.
In the read-oriented SR Web Server DriveMark, the WD2500KS coincidentally matches the WD3200JD’s score of 127 I/Os per second and thus trails the Hitachi Deskstar by 6%.
Legacy PerformanceeTesting Lab’s WinBench 99 Disk WinMark tests are benchmarks that attempt to measure desktop performance through a rather dated recording of high-level applications. Despite their age, the Disk WinMarks are somewhat of an industry standard. The following results serve only as a reference; SR does not factor them into final judgments and recommends that readers do the same. |
|
Note: Scores on top are better. |
|
|||||||||||||||||||||||||||||||||||||||
|
|
||||||||||||||||||||||||||||||||||||||
Heat and NoiseIdle Noise– The sound pressure emitted from a drive measured at a distance of 18 millimeters. The close-field measurement allows for increased resolution between drive sound pressures and eliminates interactions from outside environmental noise. Note that while the measurement is an A-weighted decibel score that weighs frequencies in proportion to human ear sensitivity, a low score does not necessarily predict whether or not a drive will exhibit a high-pitch whine that some may find intrusive. Conversely, a high score does not necessarily indicate that the drive exhibits an intrusive noise envelope. Net Drive Temperature– The highest temperature recorded from a 16-point sample of a drive’s top plate after it has been under heavy load for 80 minutes. The figures provided are net temperatures representing the difference between the measured drive temperature and ambient temperature. For more information, please click here. |
|
Note: Scores on top are better. |
|
|||||||||||||||||||||||||||||||||||||||
|
|
||||||||||||||||||||||||||||||||||||||
Like the WD3200JD, the WD2500KS demonstrates that Western Digital has perfected its FDB motors and that Caviar drives can be just as silent as the competition. The WD2500KS objectively measures in at 40.7 dB/A from a distance at 18 mm and thus remains below sustained audibility in practically all situations. Seeks are also very quiet, subtly audible over our testbed’s fans.
The WD2500KS generates about as much heat as one would expect from a 3-platter 7200 RPM design. At 19.2 degrees above ambient room temperature, the drive should work well in any adequately-ventilated chassis.
ReliabilityThe StorageReview.com Reliability Survey aims to amalgamate individual reader experiences with various hard disks into a comprehensive warehouse of information from which meaningful results may be extracted. A multiple-layer filter sifts through collected data, silently omitting questionable results or results from questionable participants. A proprietary analysis engine then processes the qualified dataset. SR presents results to readers through a percentile ranking system. According to filtered and analyzed data collected from participating StorageReview.com readers, the |
According to filtered and analyzed data collected from participating StorageReview.com readers, a predecessor of the
Western Digital Caviar WD2500KS, the
Western Digital Caviar WD2500JD
, is more reliable than of the other drives in the survey that meet a certain minimum floor of participation.
Note that the percentages in bold above may change as more information continues to be collected and analyzed. For more information, to input your experience with these and/or other drives, and to view comprehensive results, please visit the SR Drive Reliability Survey.
ConclusionOn the plus side, the Caviar WD2500KS’s single-user scores represent the first real gain in the Caviar line’s scores since WD released the WD2000JB (dubbed “DriveZilla” as some may recall) nearly three years ago. Surprisingly, the drive also manages to snag first place in the multi-user-oriented File Server DriveMark. It’s difficult to ascertain how much of this improvement comes from WD’s long-overdue migration to a native SATA interface and how much comes from the WD2500KS’s larger 16 MB buffer. If we had to hazard a guess, our money would be on the larger buffer, at least for the single-user gains. Another plus- the WD2500KS is among the quietest drives around. |
Discarding the WD Raptor’s scores (the Raptor implements legacy TCQ rather than SATA NCQ), Seagate’s implementation of NCQ indeed hurts the Barracuda’s single-user scores. Maxtor’s, however, yields a slight improvement in all scenarios. The evidence suggests that NCQ’s effect on the desktop depends on the manufacturer’s prowess in execution.
WD has indicated that they plan to release an enterprise-oriented 7200 RPM SATA design that, among other things, will feature a higher capacity, NCQ, and a more rugged design. As usual, we can’t wait to see what the future brings!


 Amazon