
Kingston DC3000ME delivers reliable Gen5 SSD performance for mainstream enterprise workloads, with balanced throughput and IOPS.
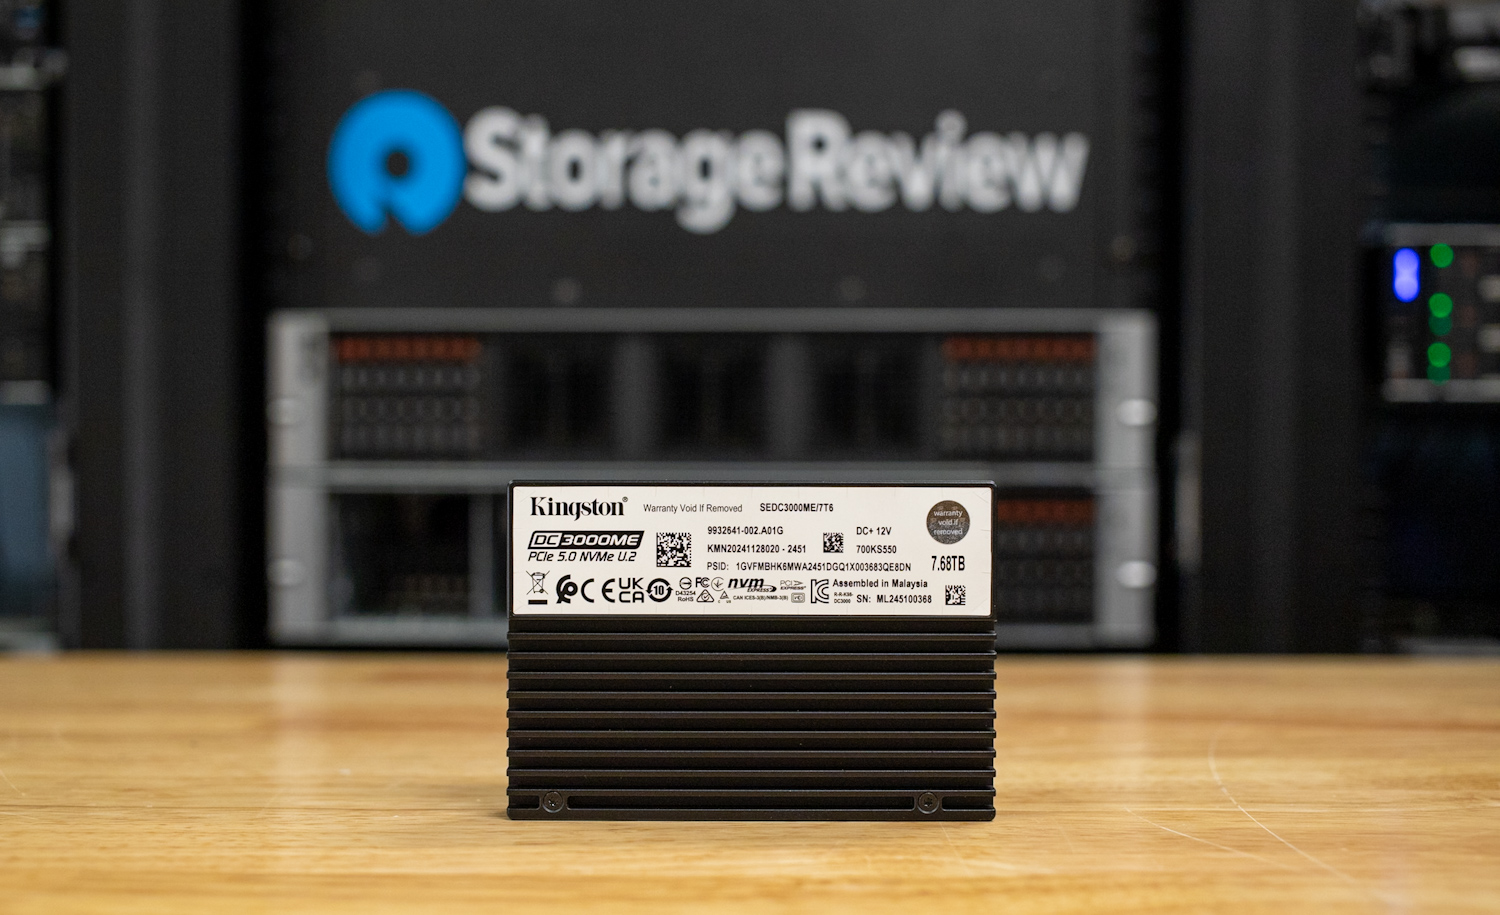
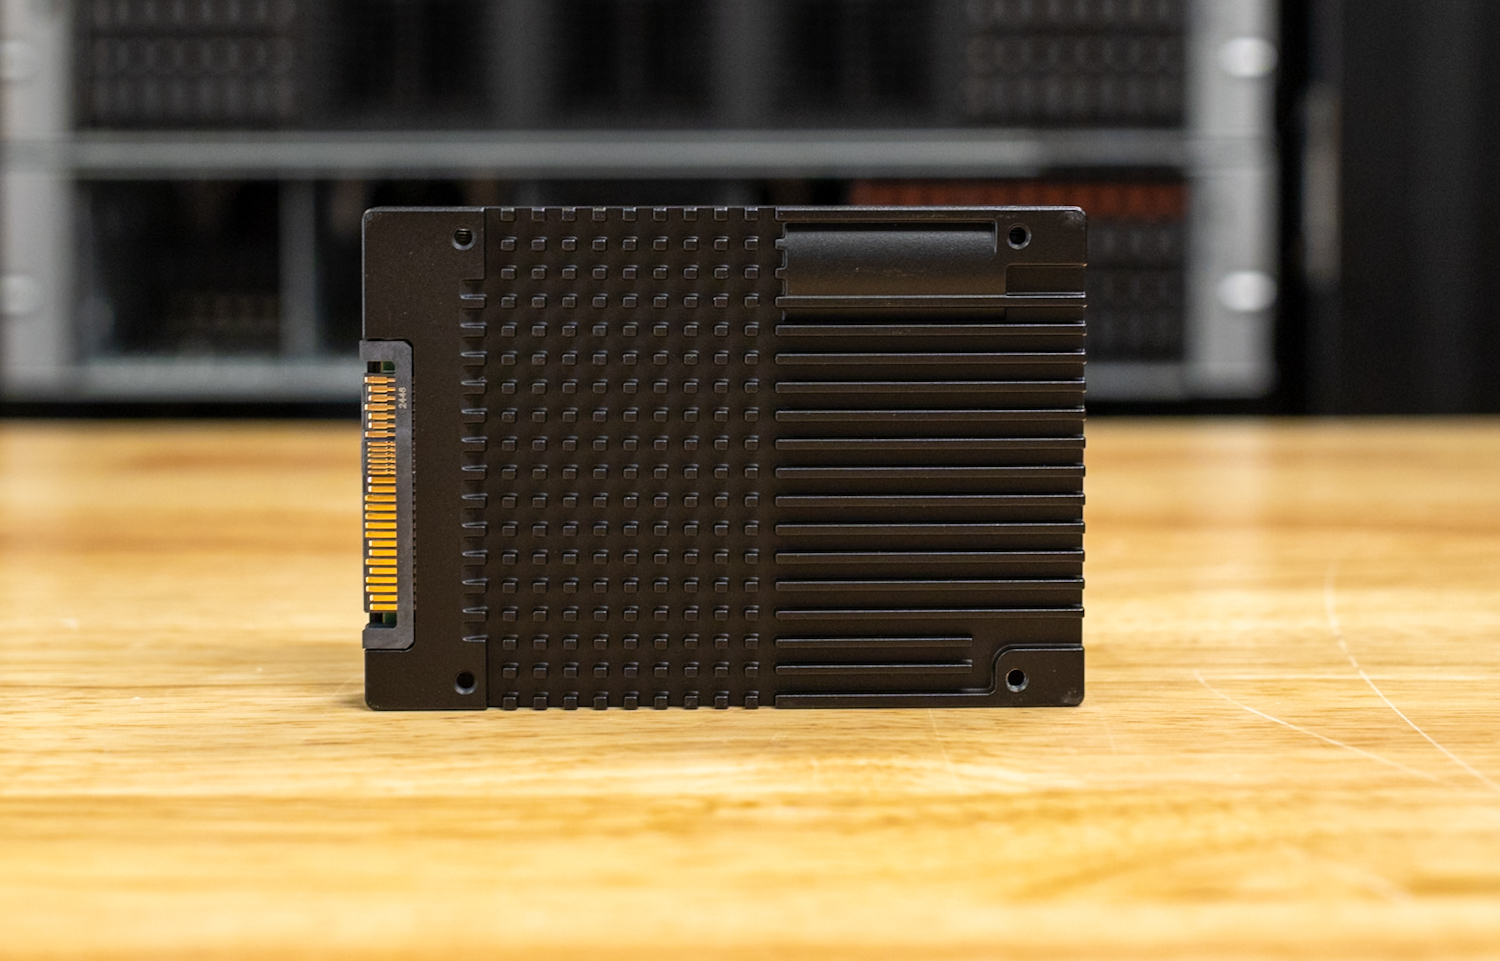
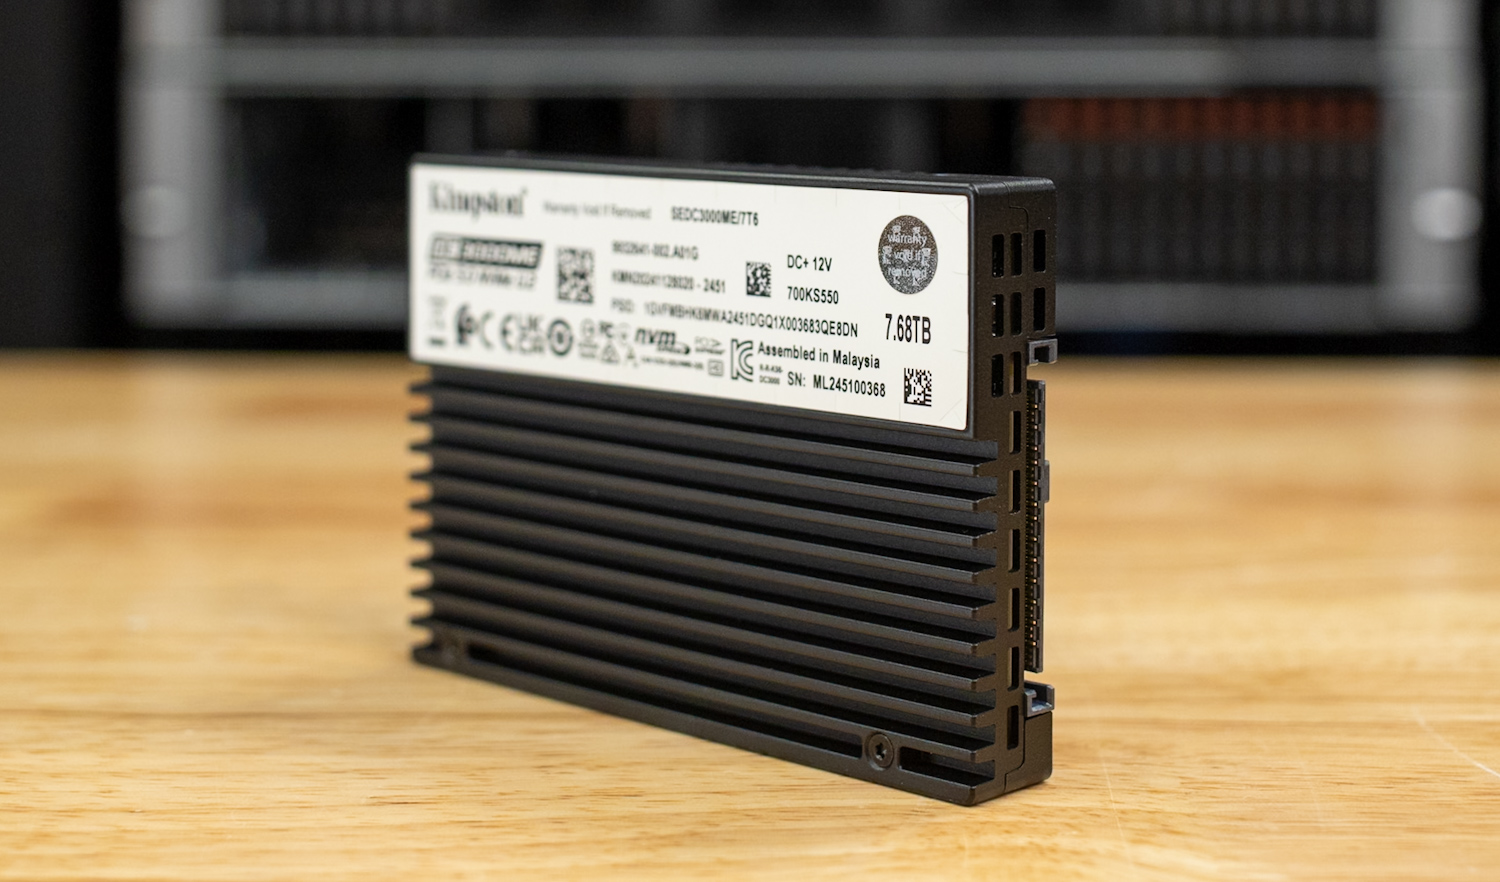
Kingston’s new DC3000ME is the company’s latest enterprise-grade NVMe SSD in a U.2 2.5″ form factor, engineered for data center and server-class workloads. Built on the PCIe 5.0 x4 interface, it pairs high-bandwidth throughput with 3D eTLC NAND for robust reliability and capacity scaling. Available in 3.84TB, 7.68TB, and 15.36TB configurations, the drive is designed for high-demand environments, such as hyperscale infrastructure, AI and HPC clusters, cloud services, and transactional systems.
Kingston DC3000ME Performance Profile
The DC3000ME maintains identical sequential read performance across all capacities, with each SKU delivering up to 14,000MB/s. This speed is ideal for workloads that rely heavily on fast data access, regardless of the chosen capacity. However, sequential write speeds vary significantly. The 3.84TB model is limited to 5,800MB/s, while the 7.68TB variant sees a substantial boost to 10,000MB/s. The 15.36TB model slightly trails behind at 9,700MB/s.
Looking at random performance, the 7.68TB is the fastest of the bunch, with a maximum of 2.8 million IOPS for reads and 500,000 IOPS for writes. This outpaces both the 3.84TB and 15.36TB drives, which are capped at 2.7 million IOPS for reads. On the write side, the 3.84TB model trails at 300,000 IOPS, while the 15.36TB model hits 400,000 IOPS. The 7.68TB version is the most capable of the variants in handling busy, high-demand tasks.
From a performance-per-capacity standpoint, the 7.68TB model also offers the most balanced combination of throughput and IOPS, making it ideal for write-intensive applications such as logging, OLTP databases, or active AI model training. The 3.84TB model is likely better suited for read-heavy or mixed workloads where capacity isn’t a priority, and the 15.36TB version trades peak write IOPS for raw storage density.
Kingston DC3000ME Enterprise Features
The DC3000ME comes with some handy enterprise-grade features that matter in production systems. Power-loss protection (PLP) is onboard to safeguard data in the event of a sudden outage. It also includes AES-256 encryption with TCG Opal support for secure data at rest. The DC3000ME supports up to 128 namespaces, which is particularly useful for virtualized or containerized use cases. That level of namespace support matches advanced U.2 SSDs and is particularly valuable for large-scale virtualized environments. Kingston also built in telemetry tools to track drive health, media wear, and operating temperature, providing administrators with visibility into long-term reliability.
Power consumption ranges from an idle draw of 8W to a maximum of 24W during full write activity, which seems typical for dense U.2 SSDs under heavy load. Kingston specifies a max read power of 8.2W, which aligns closely with the idle figure, showing a narrow power delta under read-heavy workloads. The endurance ratings match what you’d expect from an enterprise drive, with support for one full drive write per day over a five-year period. That equates to between 7,008TBW and 28,032TBW, depending on the capacity.
The Kingston DC3000ME is backed by a two-million-hour MTBF rating and Kingston’s five-year limited warranty, plus complimentary technical support.
Kingston DC3000ME Specifications
| Specification | Details |
| Form Factor | U.2, 2.5″ x 15mm |
| Interface | PCIe NVMe Gen5 x4 (backward-compatible with Gen4) |
| Capacities | 3.84TB, 7.68TB, 15.36TB |
| NAND Type | 3D eTLC NAND |
| Sequential Read/Write (MB/s) | 3.84TB – 14,000 / 5,800 7.68TB – 14,000 / 10,000 15.36TB – 14,000 / 9,700 |
| Random Read/Write IOPS (4K) | 3.84TB – 2,700,000 / 300,000 7.68TB – 2,800,000 / 500,000 15.36TB – 2,700,000 / 400,000 |
| Latency QoS (99%) | Read: <10µs, Write: <70µs |
| Static and Dynamic Wear Leveling | Yes |
| Power Loss Protection | Yes (Power Caps) |
| Encryption | TCG Opal 2.0, AES 256-bit encryption |
| Namespace Management | Up to 128 namespaces supported |
| Enterprise Diagnostics | Telemetry, media wear, temperature, health, etc. |
| Endurance (TBW / DWPD, 5 Years) | 3.84TB – 7,008 TBW, 1 DWPD 7.68TB – 14,016 TBW, 1 DWPD 15.36TB – 28,032 TBW, 1 DWPD |
| Power Consumption | Idle: 8W, Max Read: 8.2W, Max Write: 24W |
| Operating Temperature | 0°C to 70°C |
| Dimensions | 100.50mm x 69.8mm x 14.8mm |
| Weight | 3.84TB – 146.2g 7.68TB – 151.3g 15.36TB – 152.3g |
| Vibration (Non-Operating) | 10G Peak (10–1000Hz) |
| MTBF | 2 million hours |
| Warranty and Support | 5-year limited warranty with free technical support |
Kingston DC3000ME Performance Testing
Drive Testing Platform
We utilize a Dell PowerEdge R760 running Ubuntu 22.04.02 LTS as our test platform for all workloads in this review. Equipped with a Serial Cables Gen5 JBOF, it offers wide compatibility with U.2, E1.S, E3.S, and M.2 SSDs. Our system configuration is outlined below:
-
-
- 2 x Intel Xeon Gold 6430 (32-Core, 2.1GHz)
- 16 x 64GB DDR5-4400
- 480GB Dell BOSS SSD
- Serial Cables Gen5 JBOF
-
Drives Compared
CDN Performance
To simulate a realistic, mixed-content CDN workload, the SSDs were subjected to a multi-phase benchmarking sequence designed to replicate the I/O patterns of content-heavy edge servers. The testing procedure encompasses a range of block sizes, including both large and small, distributed across random and sequential operations, with varying concurrency levels.
Before the main performance tests, each SSD completed a total device fill with a 100% sequential write pass using 1MB blocks. This process utilized synchronous I/O and a queue depth of four, allowing for four simultaneous jobs. This phase ensures the drive enters a steady-state condition representative of real-world usage. Following the sequential fill, a secondary three-hour randomized write saturation stage was executed using a weighted block size split (block size/percentage) distribution, with a strong preference for 128K transfers (98.51%), followed by minor contributions from sub-128K blocks down to 8K. This step emulates fragmented and uneven write patterns often seen in distributed cache environments.
The main testing suite focused on scaled random read and write operations to measure the drive’s behavior under variable queue depths and job concurrency. Each test ran for five minutes (300 seconds) and was followed by a three-minute idle period, allowing internal recovery mechanisms to stabilize performance metrics.
- Executed using a fixed block size distribution favoring 128K (98.51%), with the remaining 1.49% of operations composed of smaller transfer sizes ranging from 64K to 8K. Each configuration varied across 1, 2, and 4 concurrent jobs, with queue depths of 1, 2, 4, 8, 16, and 32, to profile throughput scalability and latency under typical edge-write conditions.
- A heavily mixed block size profile, mimicking CDN content retrieval, was used, starting with a dominant 128K (83.21%) component and followed by a long tail of over 30 smaller block sizes, spanning from 4K to 124K, each with fractional frequency representation. This distribution reflects the diverse request patterns encountered during video segment fetching, thumbnail access, and metadata lookups. These tests were also run across the complete matrix of job counts and queue depths.
This combination of preconditioning, saturation, and mixed-size randomized access tests is designed to reveal how SSDs handle sustained CDN-like environments, emphasizing responsiveness and efficiency in bandwidth-heavy and highly parallelized scenarios.
CDN Workload Read 1
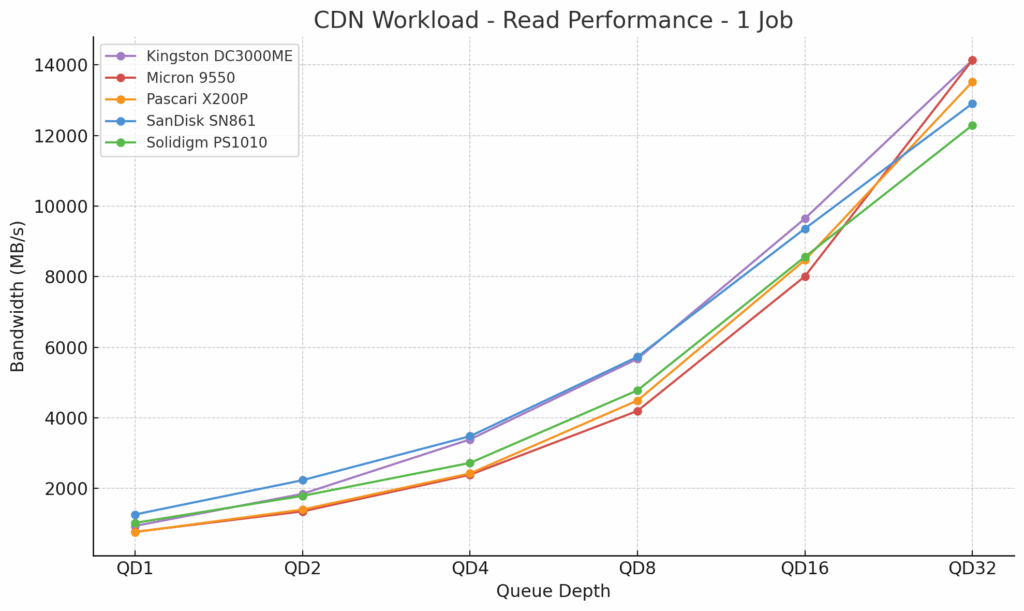
In our CDN workload read tests (1 job), the Kingston DC3000ME delivered solid performance that scaled efficiently with increasing queue depth. At QD1, it achieved a speed of 940MB/s, trailing the SanDisk SN861 by approximately 26%. However, as the queue depth increased, the DC3000ME narrowed the gap and overtook several Gen5 drives. At QD4, the Kingston DC3000ME achieves 3,390MB/s, which is roughly 42% faster than the Micron 9550, 40% ahead of the Pascari X200P, and about 25% faster than the Solidigm PS1010, although it is slightly behind the SanDisk SN861 by around 2.6%. At QD16, the DC3000ME achieved 9,645MB/s, surpassing the Solidigm PS1010 by approximately 13% and the Micron 9550 by around 20%. At the maximum test depth of QD32, Kingston gained a throughput of 14,131MB/s, effectively matching the Micron 9550 and outperforming the Solidigm PS1010 by approximately 15% and the SanDisk SN861 by nearly 10%.
 CDN Workload Read 2
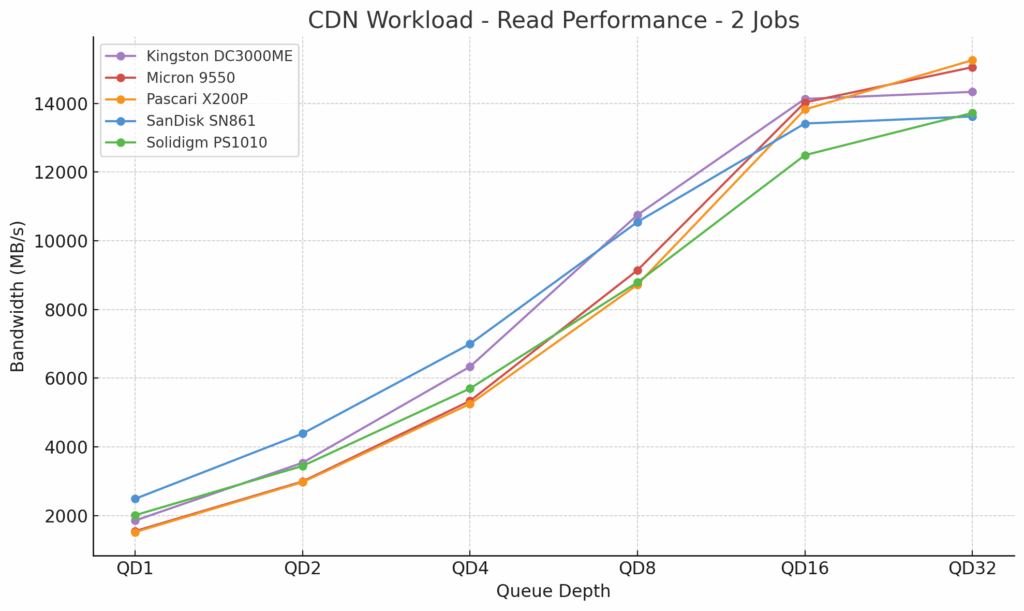
In the 2-job CDN read workload, the Kingston DC3000ME again maintained strong performance across all queue depths. At QD1, it posted 1,854MB/s. This was faster than the Micron 9550 (1,548MB/s) by 20%, the Pascari X200P (1,519MB/s) by 22%, and the Solidigm PS1010 (2,011MB/s) by approximately 8%, although it trailed the SanDisk SN861 (2,487MB/s) by 34%.
At QD4, Kingston reached 6,335MB/s, which was noticeably better than the Micron (5,337MB/s), Pascari (5,249MB/s), and Solidigm (5,609MB/s). However, it was still behind SanDisk, which took top spot at 6,996MB/s.
By QD16, Kingston hit 14,131MB/s, which led the pack at this point. At the final test point, QD32, it achieved a slight increase to 14,336MB/s, trailing Pascari (15,257MB/s) and Micron (15,052MB/s) by approximately 6% and 5%, respectively, while maintaining a solid lead over SanDisk (13,619MB/s) and Solidigm (13,721MB/s).
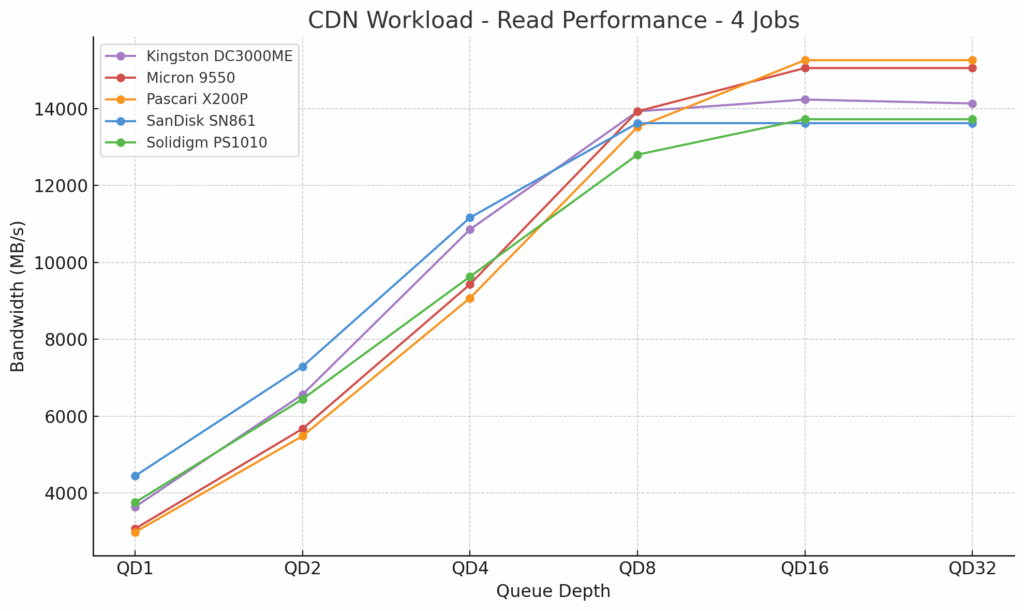
CDN Workload Read 4
With four jobs active, the Kingston DC3000ME continued to hold its own in CDN read performance. At QD1, it reached 3,639MB/s, which outperformed the Micron 9550 (3,070MB/s) and Pascari X200P (2,982MB/s), but still 22% behind the SanDisk SN861, which led this tier with 4,443MB/s. By QD4, Kingston delivered 10,854MB/s, which was a 15% improvement over Micron (9,427MB/s), 20% ahead of Pascari (9,070MB/s), and slightly above Solidigm (9,627MB/s). However, it still trailed SanDisk’s 11,161MB/s
By QD8, Kingston posted 13,926MB/s, almost identical to Micron and roughly in line with SanDisk (13,619MB/s) and Solidigm (12,800MB/s). At QD16 and QD32, throughput plateaued around 14,131–14,233MB/s for Kingston, slightly behind Micron and Pascari (both around 15,052–15,257MB/s), but still comfortably ahead of SanDisk (13,619MB/s) and Solidigm (13,721MB/s).
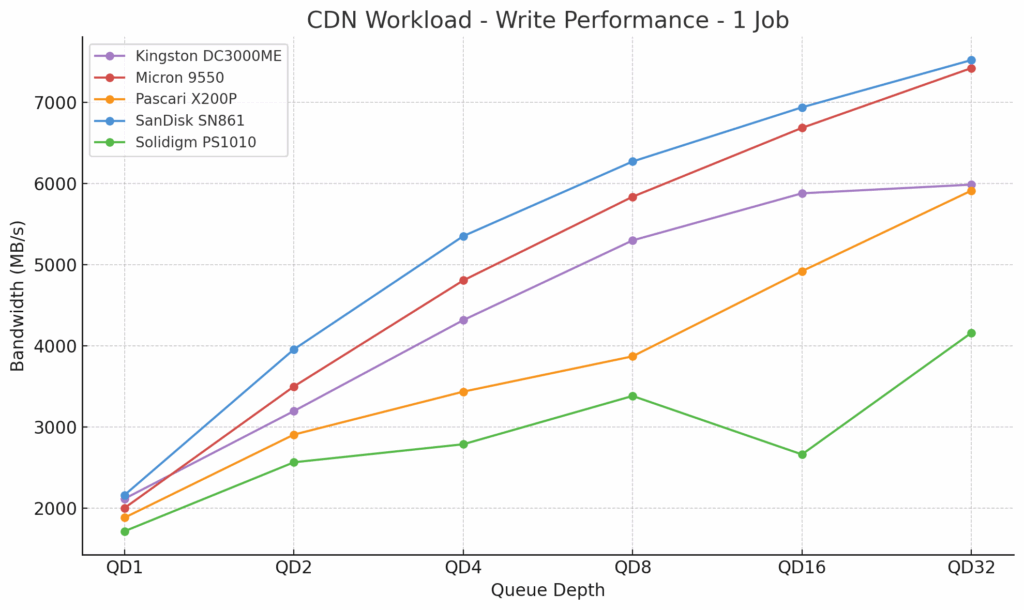
CDN Workload Write 1
In our CDN write workload (1 Job), the Kingston DC3000ME showed consistent scaling across queue depths. At QD1, it reached 2,118MB/s, which was faster than the Micron 9550 (2,004MB/s), Pascari X200P (1,885MB/s), and Solidigm PS1010 (1,718MB/s), while trailing the SanDisk SN861 by just a hair (2,164MB/s). At QD4, Kingston posted 4,318MB/s, which is 55% faster than Solidigm (2,789MB/s), 26% faster than Pascari (3,437MB/s), but 10% slower than Micron (4,807MB/s) and 19% behind SanDisk (5,353MB/s).
By QD16, it delivered 5,880MB/s, edging out Pascari (4,921MB/s) by 20% and more than doubling Solidigm (2,664MB/s), but still 11% behind Micron (6,686MB/s) and 15% off SanDisk (6,939MB/s). At QD32, Kingston capped at 5,987MB/s, again close to Pascari (5,913MB/s), but trailing Micron (7,422MB/s) and SanDisk (7,521MB/s) by approximately 20% and 25%, respectively.
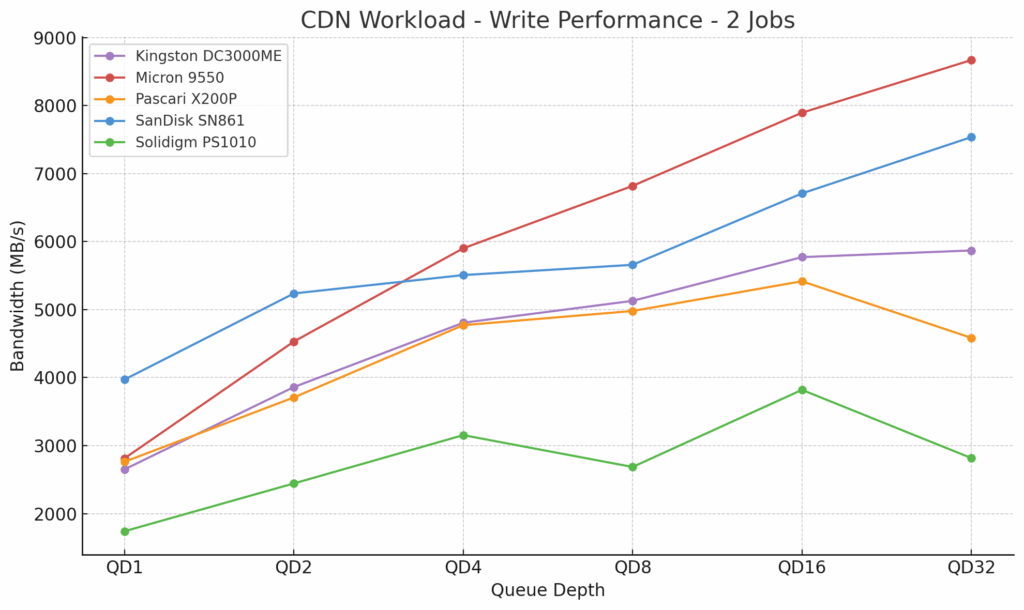
CDN Workload Write 2
In the 2-job CDN write workload, the Kingston DC3000ME demonstrated consistent performance, though it generally trailed the fastest Gen5 enterprise-class SSDs. At QD1, it posted 2,651MB/s, which was just under the Micron 9550 (2,813MB/s) and Pascari X200P (2,762MB/s), and about 33% behind the SanDisk SN861 (3,972MB/s).
As the queue depth increased, the DC3000ME kept pace. At QD4, it reached 4,807MB/s, which was about 23% slower than the Micron 9550 (5,902MB/s) and 13% behind the SanDisk SN861 (5,508MB/s), but ahead of the Solidigm PS1010 at 3,154MB/s.
At QD16, Kingston delivered 5,772MB/s, still trailing Micron (7,896MB/s) and SanDisk (6,709MB/s), but continuing to outperform lower-tier performers, such as the Solidigm PS1010 (3,820MB/s) and Pascari X200P (5,417MB/s). At QD32, the DC3000ME peaked at 5,870MB/s, about 32% behind the Micron 9550 (8,670MB/s) and 22% below the SanDisk SN861 (7,537MB/s), but still ahead of the Solidigm PS1010 (2,817MB/s) and Pascari (4,585MB/s).
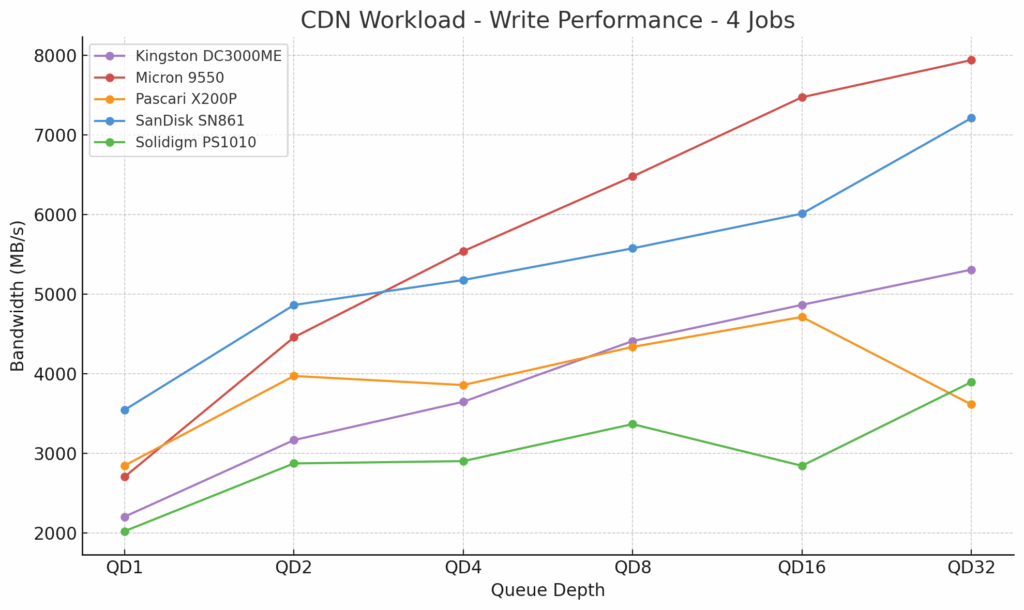
CDN Workload Write 4
In the 4-job CDN write workload, the Kingston DC3000ME scaled steadily across all queue depths, though it generally trailed the top two Gen5 drives. At QD1, it achieved 2,202MB/s, placing it behind the Pascari X200P (2,845MB/s), Micron 9550 (2,703MB/s), and SanDisk SN861 (3,544MB/s), but ahead of the Solidigm PS1010 (2,020MB/s). At QD2, Kingston reached 3,165MB/s, which again lagged behind SanDisk (4,863MB/s) and Micron (4,457MB/s), but still maintained a lead over Solidigm (2,872MB/s).
At mid-range queue depths, the Kingston DC3000ME achieved 3,647MB/s at QD4 and 4,410MB/s at QD8. While this showed decent scaling, it remained behind the Micron drive (5,539MB/s and 6,478MB/s) and SanDisk drive (5,177MB/s and 5,575MB/s) in both test points. At QD16, Kingston delivered 4,865MB/s, a modest gain over QD8 but still trailing the SanDisk drive (6,011MB/s) and the Micron drive (7,474MB/s). At QD32, the DC3000ME reached its peak at 5,307MB/s, holding well ahead of Solidigm (3,894MB/s) but significantly behind Micron (7,941MB/s) and SanDisk (7,212MB/s). While not a performance leader, the Kingston drive maintained consistent scaling and efficiency.
DLIO Checkpointing Benchmark
To evaluate SSD real-world performance in AI training environments, we utilized the Data and Learning Input/Output (DLIO) benchmark tool. Developed by Argonne National Laboratory, DLIO is specifically designed to test I/O patterns in deep learning workloads. It provides insights into how storage systems handle challenges such as checkpointing, data ingestion, and model training. The chart below illustrates how both drives handle the process across 36 checkpoints. When training machine learning models, checkpoints are essential for saving the model’s state periodically, preventing loss of progress during interruptions or power failures. This storage demand requires robust performance, especially under sustained or intensive workloads. We used DLIO benchmark version 2.0 from the August 13, 2024, release.
To ensure our benchmarking reflected real-world scenarios, we based our testing on the LLAMA 3.1 405B model architecture. We implemented checkpointing using torch.save() to capture model parameters, optimizer states, and layer states. Our setup simulated an eight-GPU system, implementing a hybrid parallelism strategy with 4-way tensor parallelism and 2-way pipeline parallel processing distributed across the eight GPUs. This configuration resulted in checkpoint sizes of 1,636GB, representative of modern large language model training requirements.
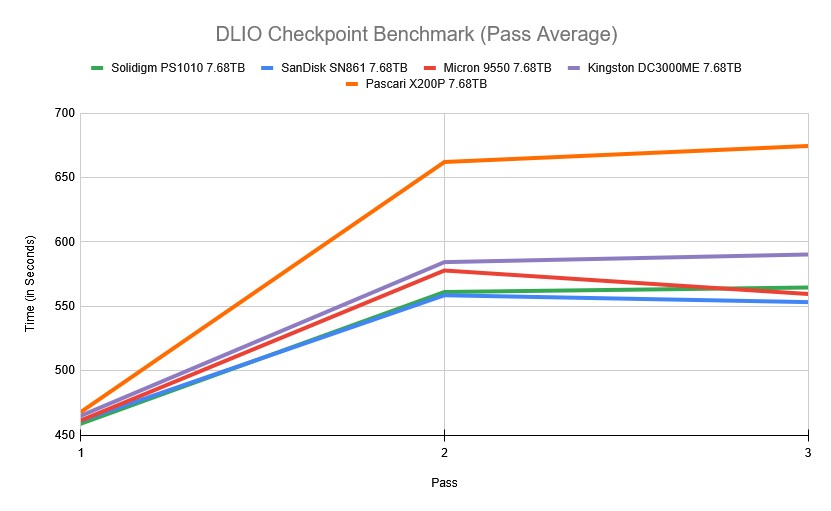
In the DLIO average pass results, the Kingston DC3000ME 7.68TB trailed slightly behind the top contenders, landing in the middle of the five-drive pack. The checkpoint times averaged 465.04 seconds in the first pass, 584.38 seconds in the second pass, and 590.30 seconds in the third pass. While it was consistently quicker than the Pascari X200P 7.68TB, which posted the highest times across all three passes (reaching 674.48 seconds in pass 3), the Kingston DC3000ME lagged the Micron 9550 7.68TB and Solidigm PS1010 7.68TB, both of which remained below 565 seconds in the final pass.
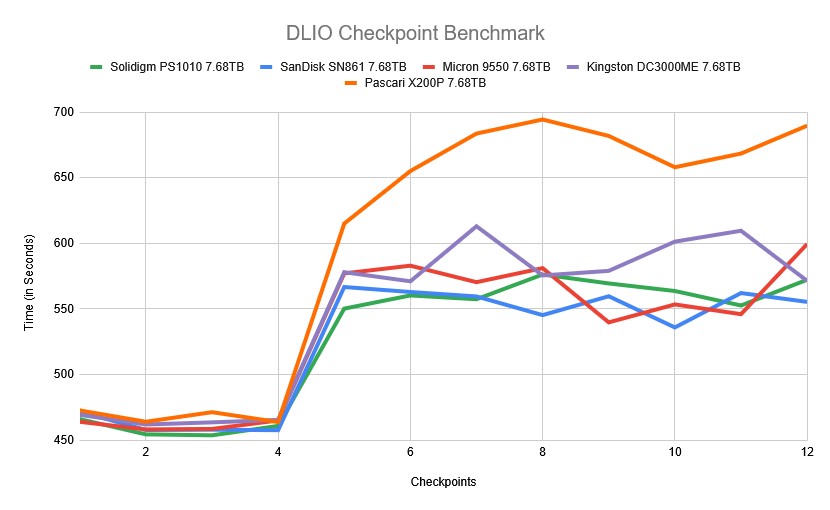
As shown in the chart below, the Kingston DC3000ME got off to a strong start, with early checkpoint times closely matching those of top-tier competitors. At checkpoint 1, it posted 469.27 seconds, just behind the Micron 9550 at 464.01 seconds and ahead of the Pascari X200P at 472.65 seconds. From checkpoint 2 through 4, it maintained a steady range between 461.92 and 465.44 seconds, again staying close to the Micron 9550 and Solidigm PS1010, both of which hovered in the 453–465 second bracket.
By the middle of the test (checkpoints 5 to 8), the Kingston DC3000ME experienced a jump in checkpoint times, peaking at 613.01 seconds during checkpoint 7. This was higher than the Micron 9550 (570.42s) and SanDisk SN861 7.68TB (559.56s), though still significantly better than the Pascari X200P, which reached as high as 694.38 seconds during the same interval. Toward the end of the test, the Kingston DC3000ME stabilized slightly, finishing at 571.36 seconds for checkpoint 12, which was roughly 28 seconds slower than Micron 9550 but still outpacing the Pascari X200P, which closed at 689.68 seconds. Overall, the Kingston DC3000ME 7.68TB demonstrated consistent performance and remained within a competitive range throughout the checkpointing workload, placing it in the middle of the pack.
FIO Performance Benchmark
To measure the storage performance of each SSD across common industry metrics, we leverage FIO. Each drive is run through the same testing process, which includes a preconditioning step of two full drive fills with a sequential write workload, followed by measurement of steady-state performance. As each workload type being measured changes, we run another preconditioning fill of that new transfer size.
In this section, we focus on the following FIO benchmarks:
- 128K Sequential
- 64K Random
- 16K Random
- 4K Random
With high-capacity QLC SSDs designed for large transfer sizes, our write speed tests are limited to 16K random. For 4K, we leverage the pre-filled state from the 16K workload to measure only 4K random read performance.
128K Sequential Precondition (IODepth 256 / NumJobs 1)
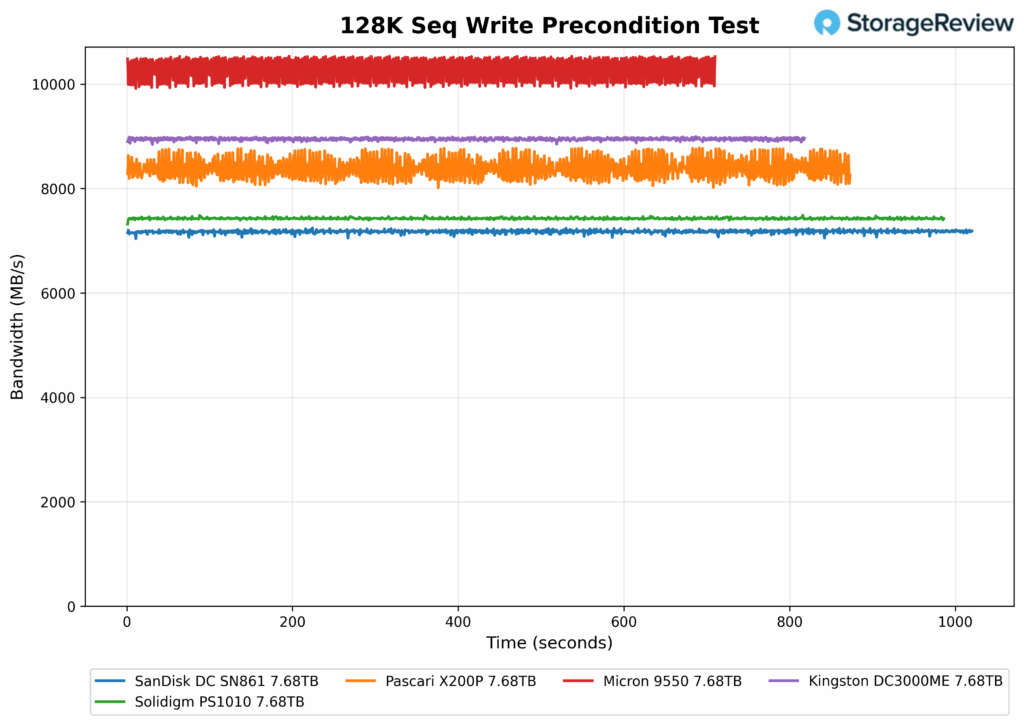
In this heavy queue-depth preconditioning test, the Kingston DC3000ME maintained a steady write bandwidth at 8,944.9MB/s throughout the 1,000-second run (though finishing the test just past the 800-second mark). While not the fastest (trailing slightly behind the Micron 9550, which reached a peak of 10.3GB/s), the Kingston DC3000ME demonstrated consistent throughput with minimal variance.
128K Sequential Precondition Latency (IODepth 256 / NumJobs 1)
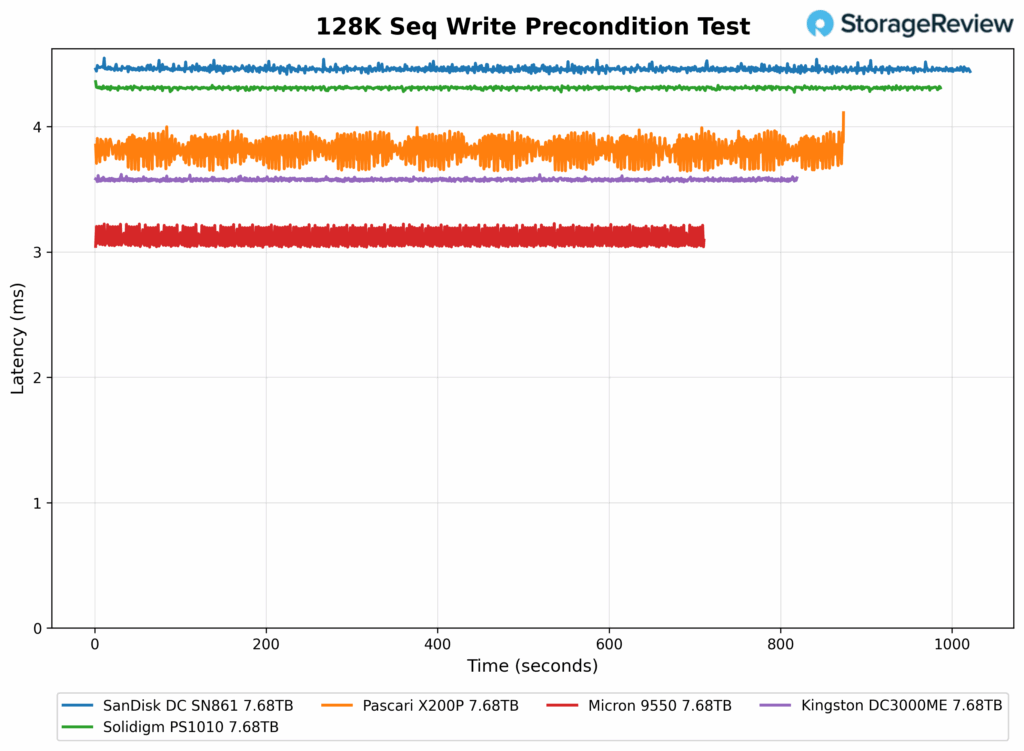
In the 128K Sequential Write Precondition latency test, the Kingston DC3000ME showed an average latency of 3.577ms (remaining stable over time with minimal fluctuation), placing it second behind the Micron drive.
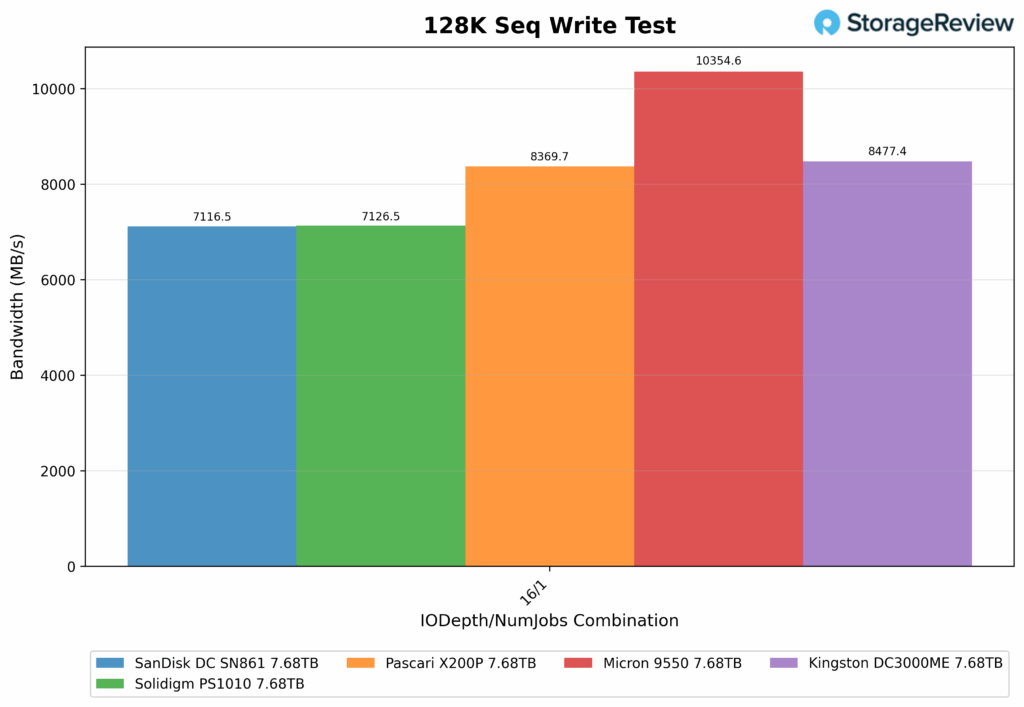
128K Sequential Write (IODepth 16 / NumJobs 1)
In the 128K Sequential Write Test, the Kingston DC3000ME achieved 8,477.4MB/s, placing it just behind the Micron 9550, which led the group at 10,354.6MB/s. The Kingston DC3000ME outperformed the Pascari X200P and maintained a solid lead over both the Solidigm PS1010 and SanDisk SN861, with each hovering around 7,100MB/s. Kingston’s performance indicates a strong balance between speed and consistency.
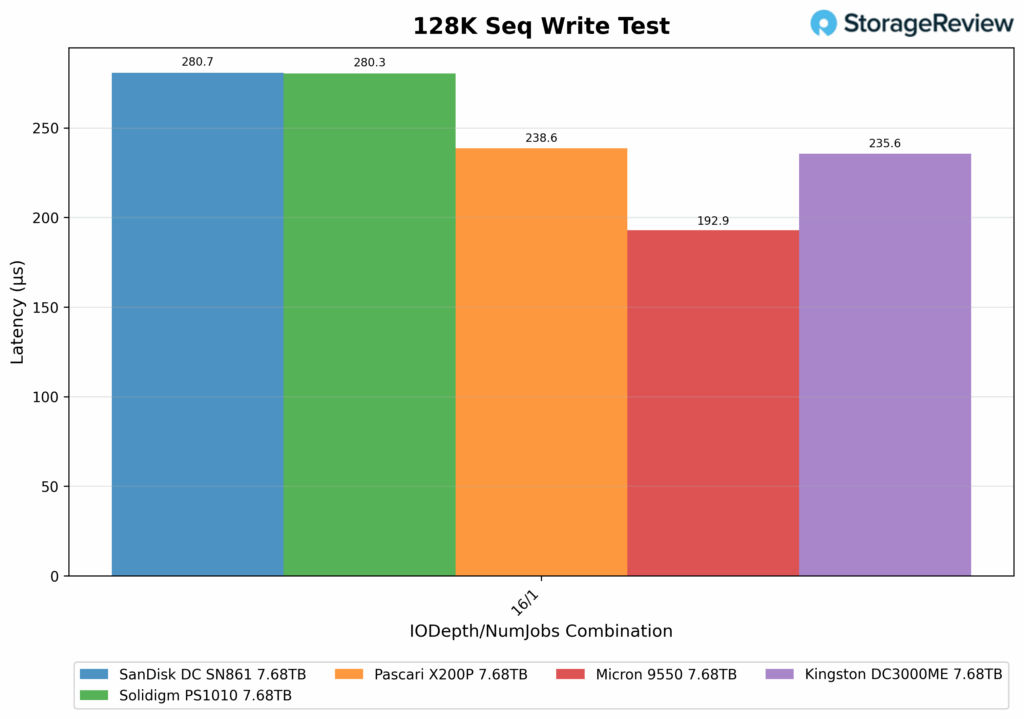
128K Sequential Write Latency (IODepth 16 / NumJobs 1)
In the 128K Sequential Write Latency test, the Kingston DC3000ME delivered a solid result with an average latency of 235.6µs. This places it ahead of both the SanDisk SN861 and Solidigm PS1010, which posted latencies of 280.7µs and 280.3µs, respectively. While not quite as fast as the Micron 9550, which led at 192.9µs, the Kingston DC3000ME remained competitive and also slightly edged out the Pascari X200P at 238.6µs.
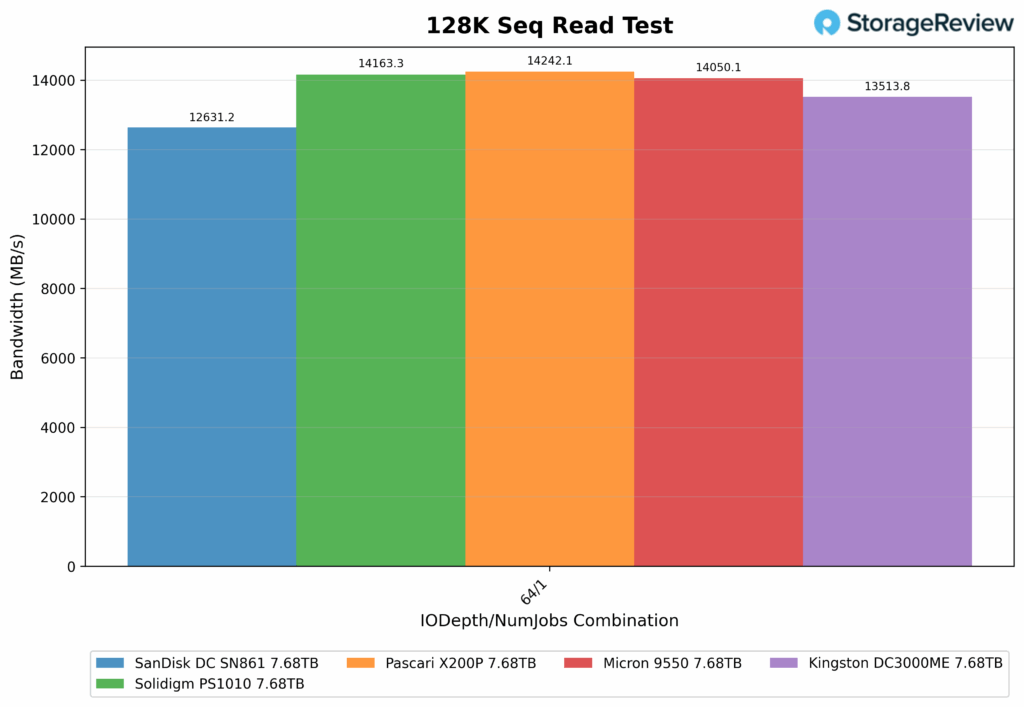
128K Sequential Read (IODepth 64 / NumJobs 1)
In the 128K Sequential Read test at a queue depth of 64 with one job, the Kingston DC3000ME achieved 13,513.8MB/s. Though this places it fourth among the tested drives, it still delivered strong throughput (with minimal real-world differences). It trailed the Pascari X200P (14,242.1MB/s) by about 5.1%, the Solidigm PS1010 (14,163.3MB/s) by 4.6%, and the Micron 9550 (14,050.1MB/s) by roughly 3.8%. It also comfortably outperformed the SanDisk SN861, which achieved a lower speed of 12,631.2MB/s. Nonetheless, the Kingston DC3000ME’s results were strong, with minimal drop-off compared to the top-tested drives.
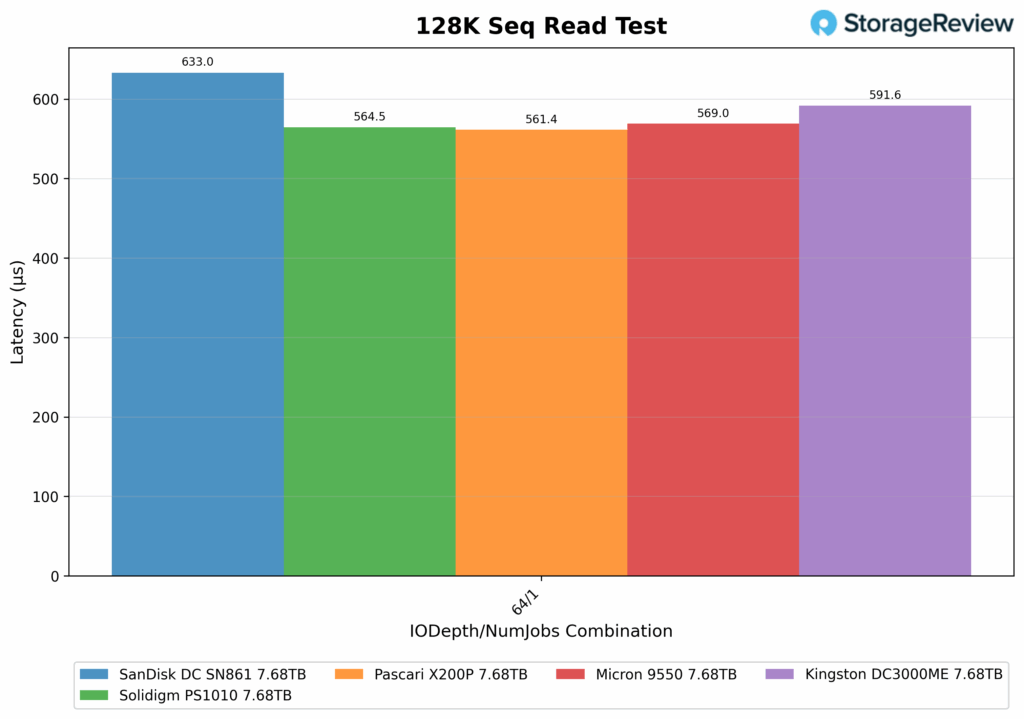
128K Sequential Read Latency (IODepth 64 / NumJobs 1)
For Latency, the Kingston DC3000ME recorded an average latency of 591.6µs, which placed it in the middle of the group. This result was 5.4% higher than that of the Micron 9550 (569.0µs) and 5.4% lower than the Solidigm PS1010 (564.5µs). The Pascari X200P led marginally at 561.4µs, while the SanDisk SN861 showed the slowest response at 633.0µs. Ultimately, the Kingston DC3000ME maintained relatively low latency under high queue depth read conditions.
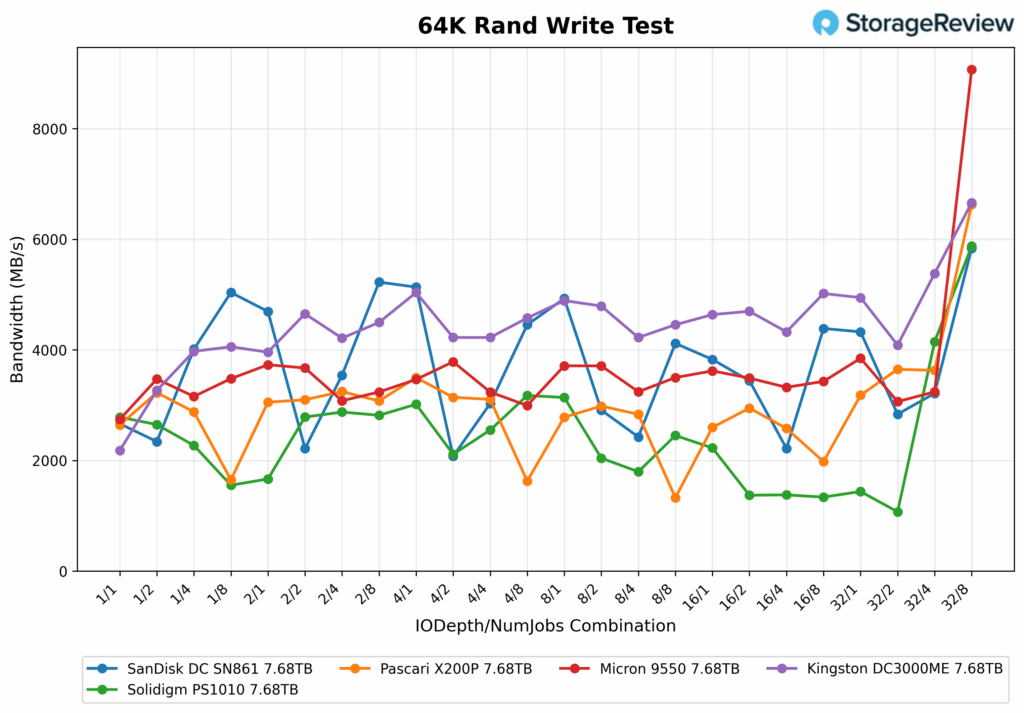
64K Random Write
In the 64K Random Write test, the Kingston DC3000ME consistently delivered high performance across various queue depths and thread combinations, peaking at 6,649MB/s in the 32 (IO depth)/8 (numjobs) configuration. This result is among the highest across all workloads and test points.
Throughout the chart, the Kingston DC3000ME maintained a stable bandwidth trend between 4,000 and 5,000MB/s, with particularly strong showings in mid-to-high concurrency setups, such as 32/4 (5,380MB/s) and 16/8 (5,017MB/s). Even under lighter conditions, such as 1/4 and 2/4, it maintained above 4200MB/s. Compared to other drives, the Kingston DC3000ME generally led or remained near the top of the group across most test points, offering both high peak throughput and consistent performance throughout the test.
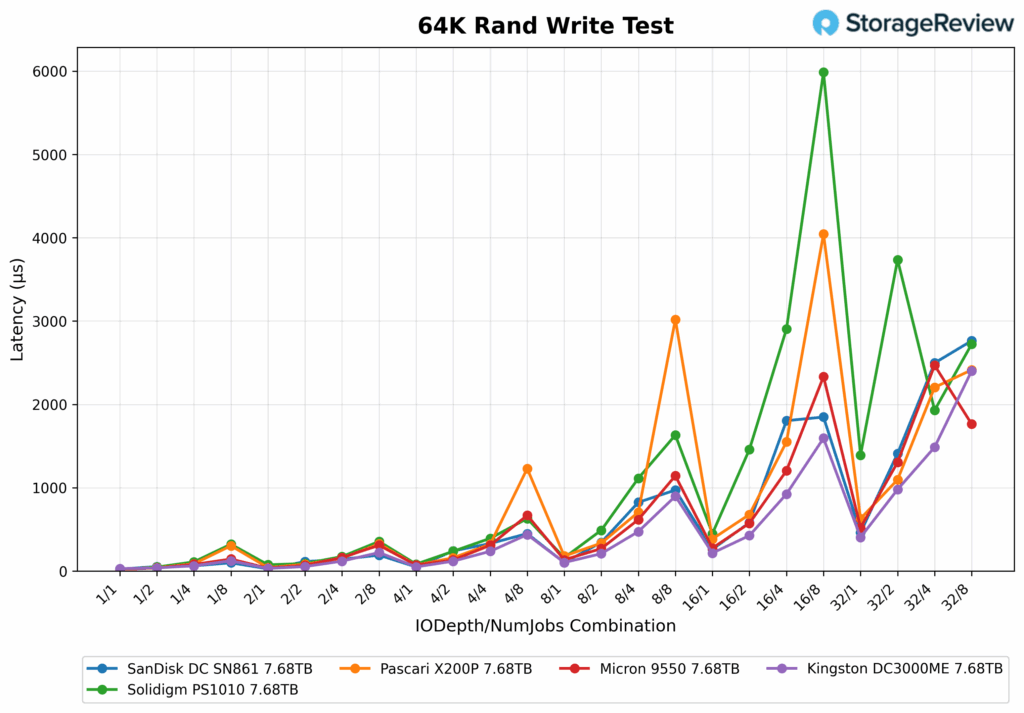
64K Random Write Latency
In the 64K Random Write Latency test, the Kingston DC3000ME consistently delivered low response times across most queue depths and job combinations, demonstrating strong write efficiency even under heavy load. For example:
- At 4/1, it showed 49µs
- At 8/1, latency stayed low at 102µs
- At 16/4, it measured 1,486µs
- And at the highest tested load, 32/8, it reached 2,402µs
These results indicate that the Kingston DC3000ME scaled predictably, avoiding the severe latency spikes seen in other drives, especially the Pascari and Solidigm drives, which exhibited erratic jumps above 3,000–6,000µs (most notably at 16/8).
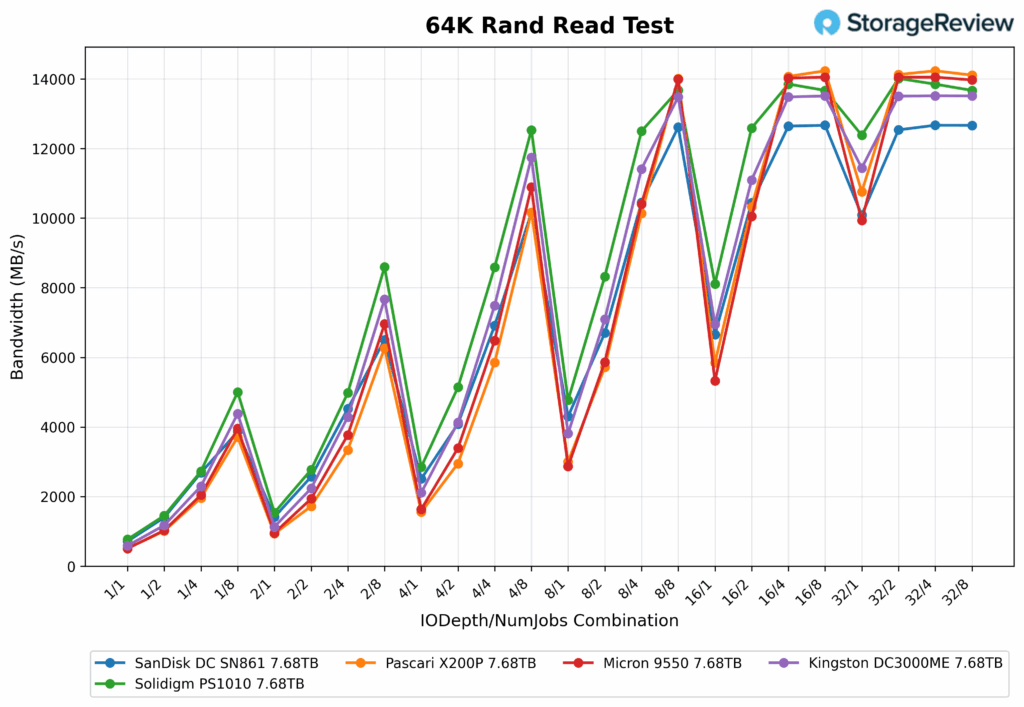
64K Random Read
In the 64K Random Read test, the Kingston DC3000ME delivered strong and consistent performance across the entire IOdepth/NumJobs matrix, ending up in fourth place by the end of the test (by a small margin). Peak bandwidth reached 13,515MB/s at 32/4, with similarly high throughput at 16/4 (13,482MB/s) and 32/8 (13,512MB/s), demonstrating excellent scalability under heavy parallel read workloads. At lower loads, like 1/4 and 2/2, the Kingston DC3000ME measured 2,298MB/s and 2,234MB/s, respectively.
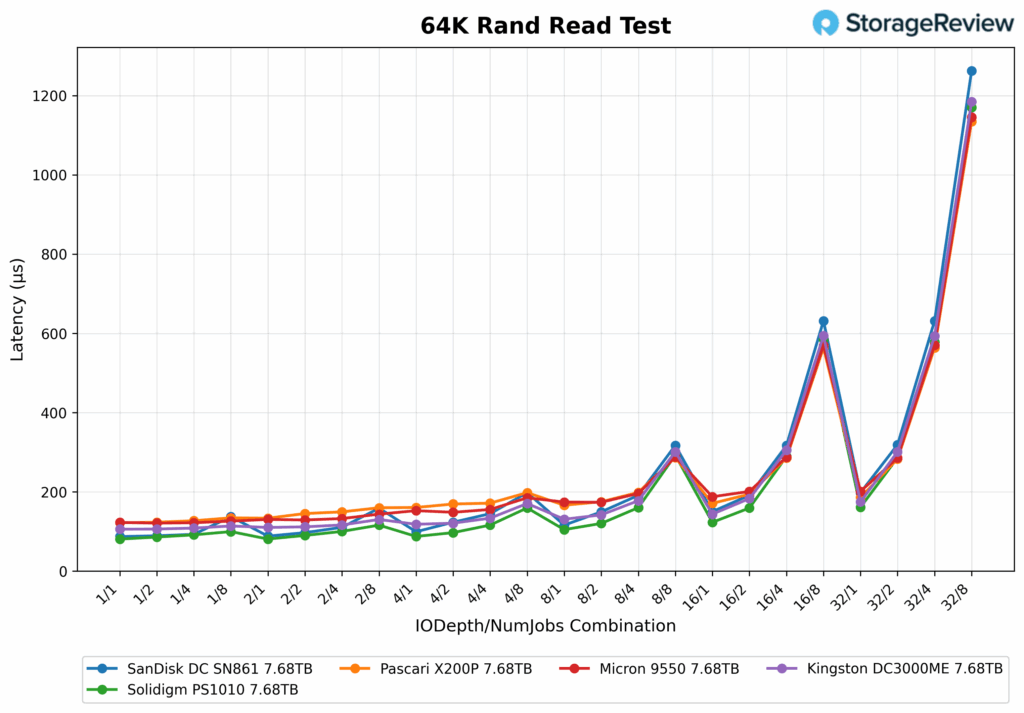
64K Random Read Latency
The Kingston DC3000ME 64K latency remained relatively low across all test points. All drives performed similarly, although the SanDisk SN861 peaked noticeably higher than all other tested drives at the end of the test. Starting at 1/2, the Kingston DC3000ME measured 106µs, followed by 108µs at 1/4, 131µs at 8/1, 133µs at 4/4, and 177µs at 8/4. At higher concurrency, it increased to 305µs at 16/4, 174µs at 32/1, 301µs at 32/2, and peaked at 1,184µs under 32/8, aligning it with the rest of the group. Overall, the Kingston DC3000ME’s latency profile tracked closely with the top performers, with minimal jitter or outlier spikes (which was the case with all tested drives)
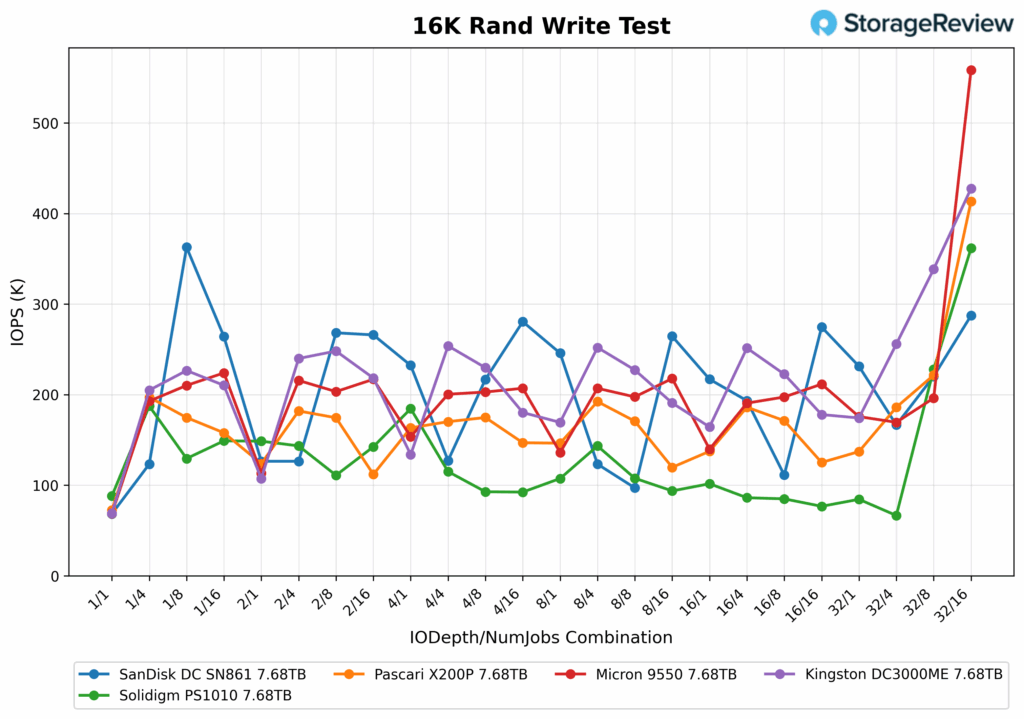
16K Random Write
In the 16K Random Write test, the Kingston DC3000ME delivered strong bandwidth across the full range of queue depths and thread counts, ending the test in second place among competing drives. It topped out at 427,592 IOPS under the 32/16 configuration. Other high-performing points included 338,521 IOPS at 32/8, 251,428 IOPS at 16/4, and 226,606 IOPS at 1/8, all showing excellent controller efficiency under varying parallel loads. Even in moderate load setups, such as 2/16 and 1/4, the drive achieved 218,300 IOPS and 204,867 IOPS, respectively. Overall, the Kingston DC3000ME consistently achieved IOPS above 160,000 across the test matrix (except in a few areas), making it one of the more balanced drives in this workload.
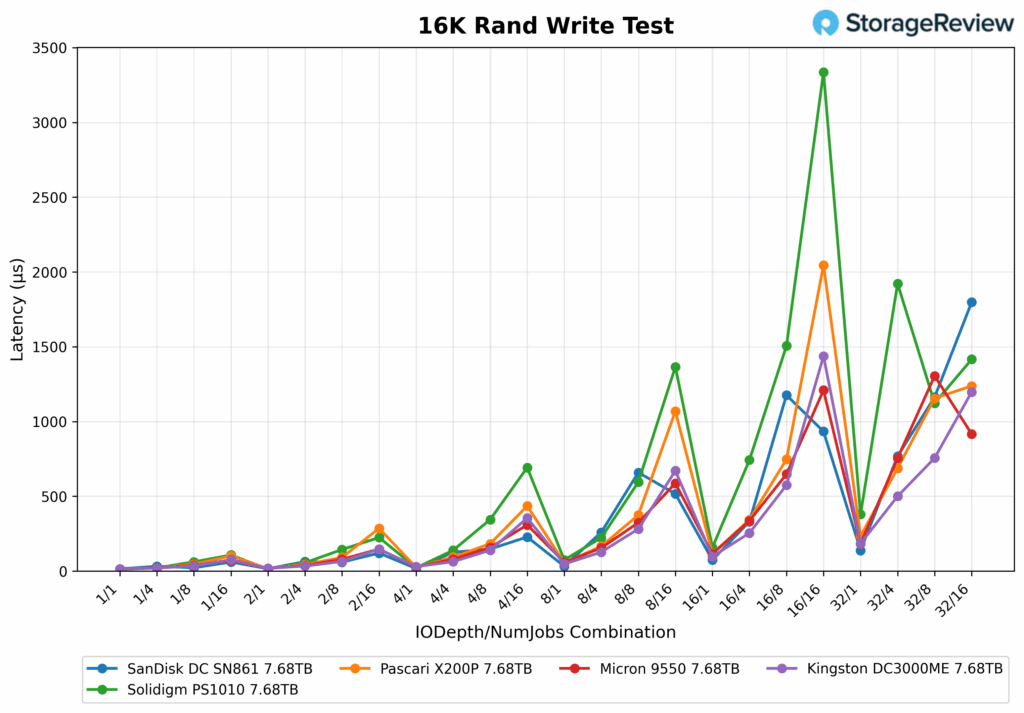
16K Random Write Latency
Kingston DC3000ME 16K write latency performance was very solid, ending the test at the top of the leaderboard (with the Pascari drive trailing by a hair). Kingston DC3000ME highlights included 14µs at 1/1, 18µs at 2/1, 19µs at 1/4, and 29µs at 1/2. As load increased, Kingston maintained a strong latency profile: 126µs at 8/4, 146µs at 2/16, 254µs at 16/4, and 575µs at 16/8. Even at the heaviest configuration, 32/16, latency remained under control at 1,197µs.
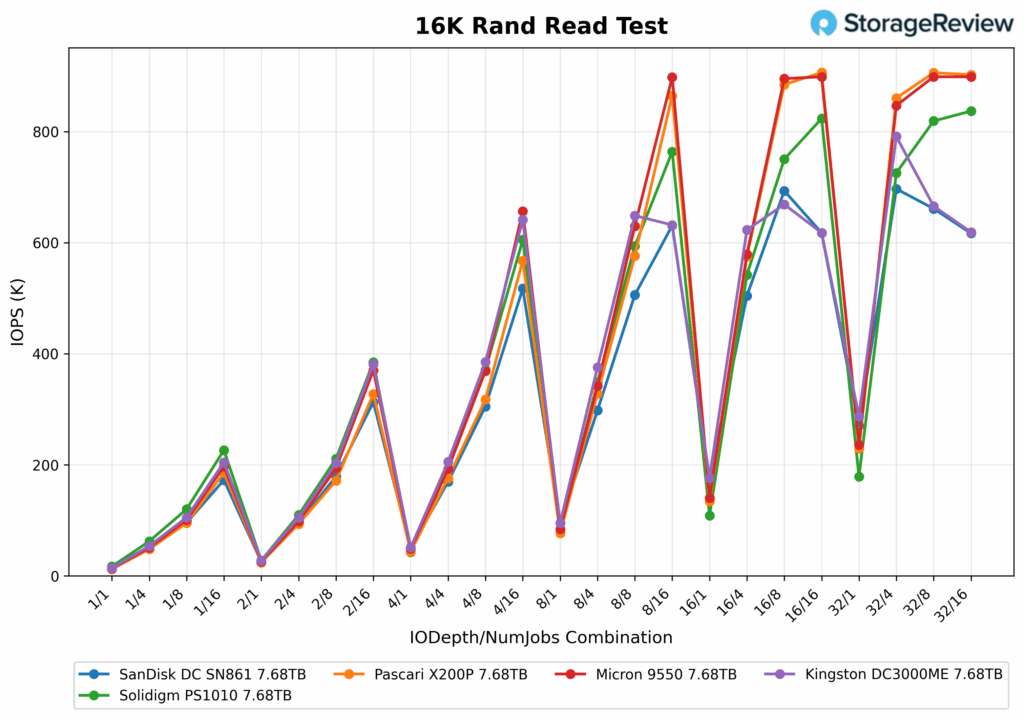
16K Random Read
Under 16K random read conditions, the Kingston DC3000ME demonstrated consistently strong performance until it reached 8/8, at which point it began to fall behind slightly. Peak IOPS landed at just under 800K (648,686) at QD32 with four jobs, followed by 641K IOPS at QD4 with 16 jobs and 623K at QD16 with four jobs. Unfortunately, the Kingston DC3000ME ended the test near the bottom of the leaderboard along with the SanDisk drive.
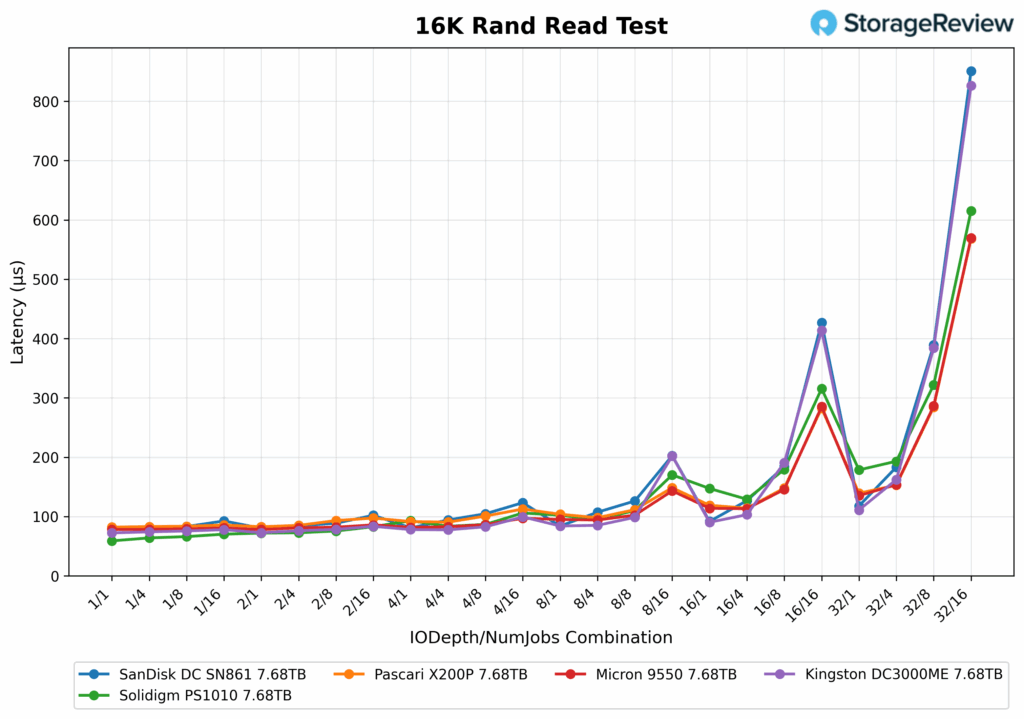
16K Random Read Latency
At peak throughput (QD8/8), the Kingston DC3000ME’s latency measured just 99µs, and stayed within a narrow, low-latency band across most configurations until around 16/8 when it started to falter. The best latency was observed at QD1/4 (74µs), with several other sub-80µs results at low to moderate queue depths. At heavier loads, like QD32/16, the Kingston DC3000ME posted a 826µs, which was significantly higher than the other tested drives (except for the SanDisk).
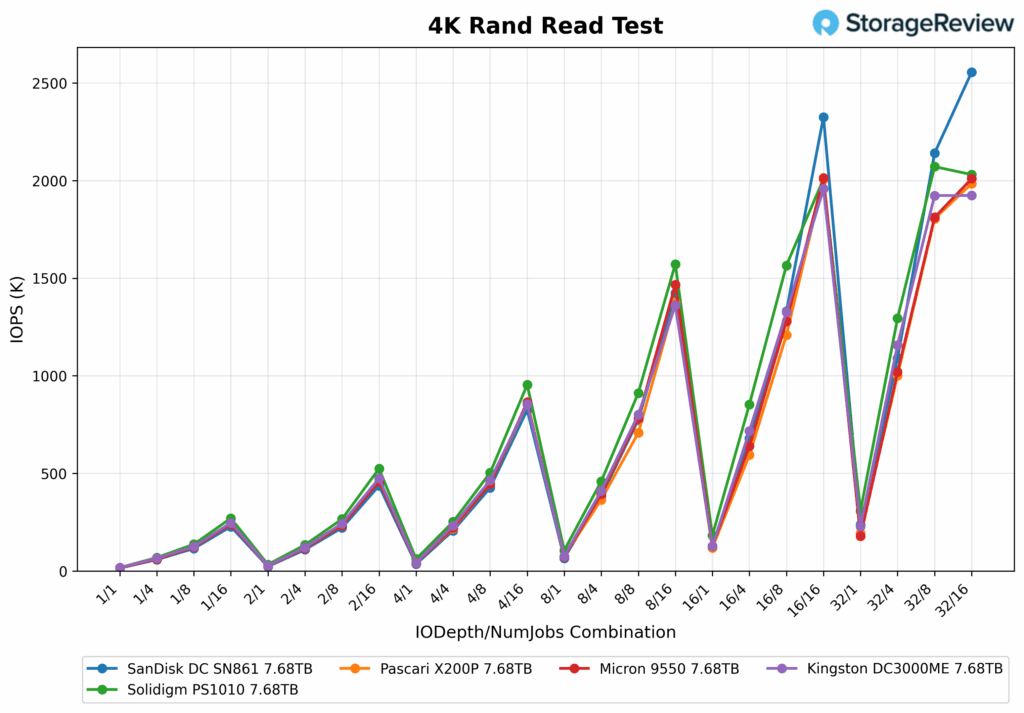
4K Random Read
In the 4K random read test, the Kingston DC3000ME showed great scaling across the test range, peaking at 1,957.92K IOPS under the 16/16 configuration. It maintained high throughput at 1,923.42K IOPS at 32/8, 1,361.32K IOPS at 8/16, and 1326.03K IOPS at 16/8, consistently ranking at the top of the leaderboard alongside Solidigm and Micron.
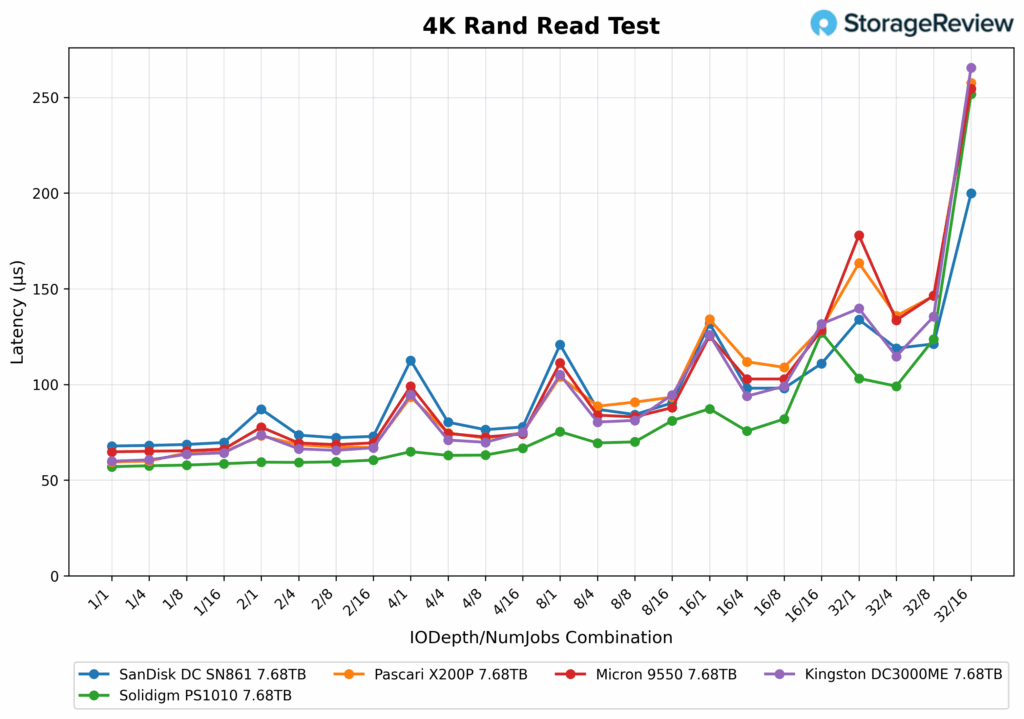
 4K Random Read Latency
The Kingston DC3000ME maintained low latency throughout the 4K random read test, starting at 60µs under the 1/1 configuration. At 1/4, it improved slightly to 61µs, and at 1/8, it remained steady at 63µs. As concurrency increased, latency scaled predictably with the Kingston DC3000ME: 66µs at 2/4, 67µs at 2/16, 71µs at 4/4, and 80µs at 8/4. Heavier configurations saw modest rises with 94µs at 16/4, 99µs at 16/8, 135µs at 32/8, and a peak of 266µs at 32/16.
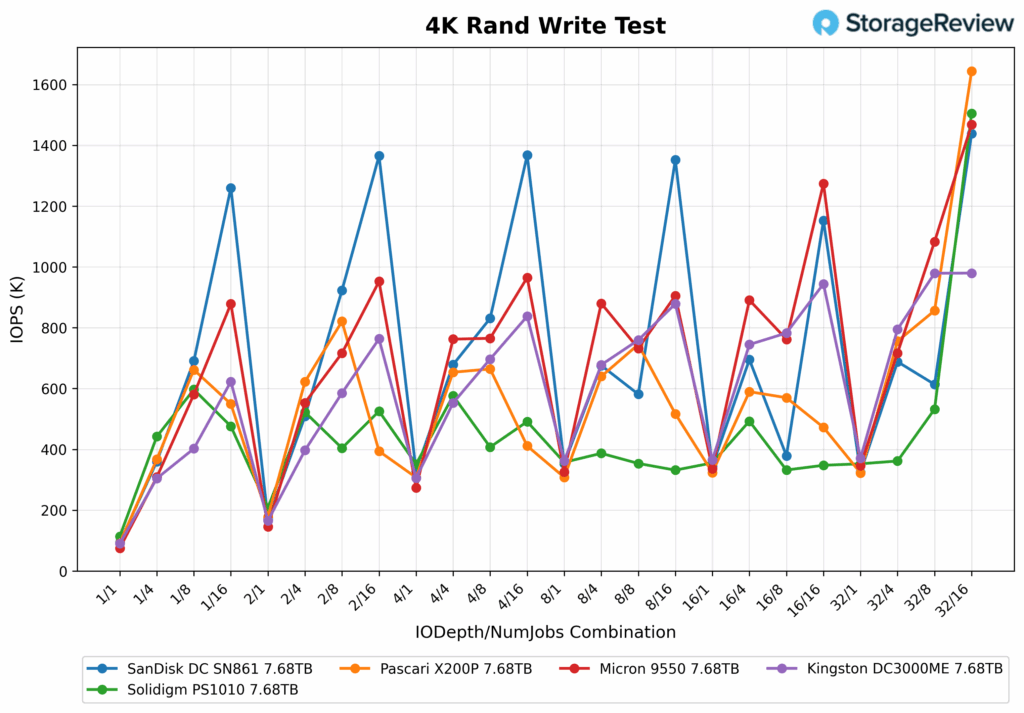
4K Random Write
In 4K random write, the Kingston DC3000ME delivered a strong showing with a maximum of 979,636 IOPS at 32/16 and 979.173 IOPS at 32/8, placing it well behind the top performer, Pascari X200P, which exceeded 1.6M IOPS at peak. That said, the Kingston DC3000ME posted decent numbers in midrange loads such as 879K IOPS at 8/16, 944K IOPS at 16/16, and 745K IOPS at 16/4.
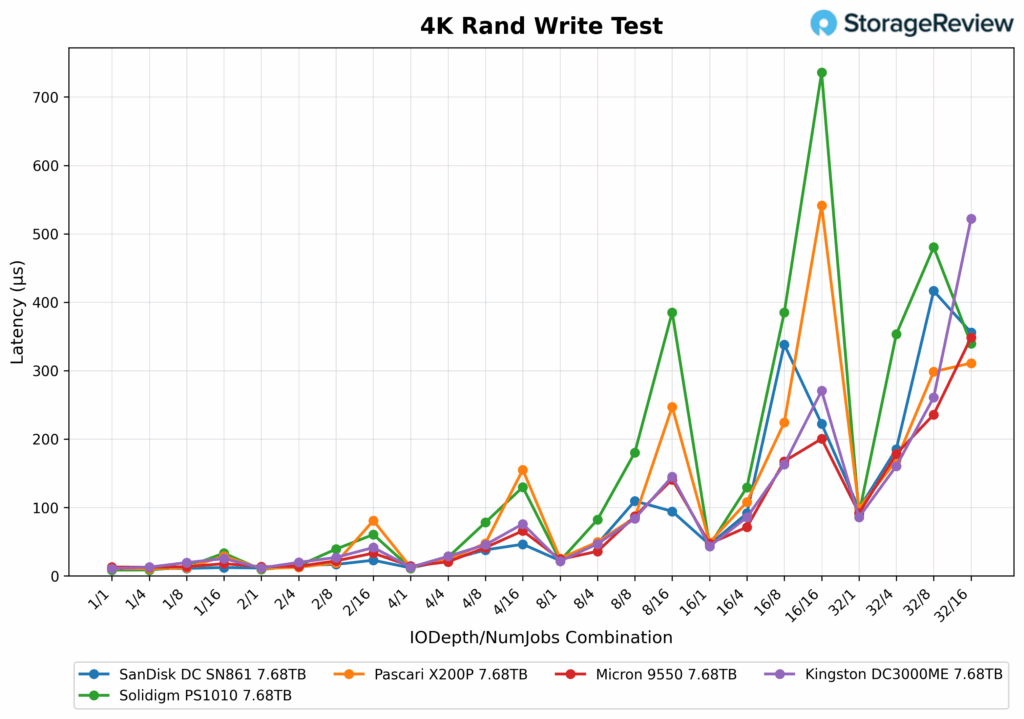
4K Random Write Latency
In random write latency, the Kingston DC3000ME started at 11µs under 1/1, stayed around 20–50µs until it hit the 8/8 depth, and scaled to 261µs at 32/8 and 522µs at 32/16. While not the lowest in latency, the Kingston DC3000ME maintained predictable and moderate scaling, without the spikes seen in drives like the Solidigm and Pasarci, which showed greater volatility beyond 16 threads.
GPU Direct Storage
One of the tests we conducted on this testbench was the Magnum IO GPU Direct Storage (GDS) test. GDS is a feature developed by NVIDIA that allows GPUs to bypass the CPU when accessing data stored on NVMe drives or other high-speed storage devices. Instead of routing data through the CPU and system memory, GDS enables direct communication between the GPU and the storage device, significantly reducing latency and improving data throughput.
How GPU Direct Storage Works
Traditionally, when a GPU processes data stored on an NVMe drive, the data must first travel through the CPU and system memory before reaching the GPU. This process introduces bottlenecks, as the CPU becomes a middleman, adding latency and consuming valuable system resources. GPU Direct Storage eliminates this inefficiency by enabling the GPU to access data directly from the storage device via the PCIe bus. This direct path reduces the overhead associated with data movement, allowing faster and more efficient data transfers.
AI workloads, especially those involving deep learning, are highly data-intensive. Training large neural networks requires processing terabytes of data, and any delay in data transfer can lead to underutilized GPUs and longer training times. GPU Direct Storage addresses this challenge by ensuring that data is delivered to the GPU as quickly as possible, minimizing idle time and maximizing computational efficiency.
In addition, GDS is particularly beneficial for workloads that involve streaming large datasets, such as video processing, natural language processing, or real-time inference. By reducing the reliance on the CPU, GDS accelerates data movement and frees up CPU resources for other tasks, further enhancing overall system performance.
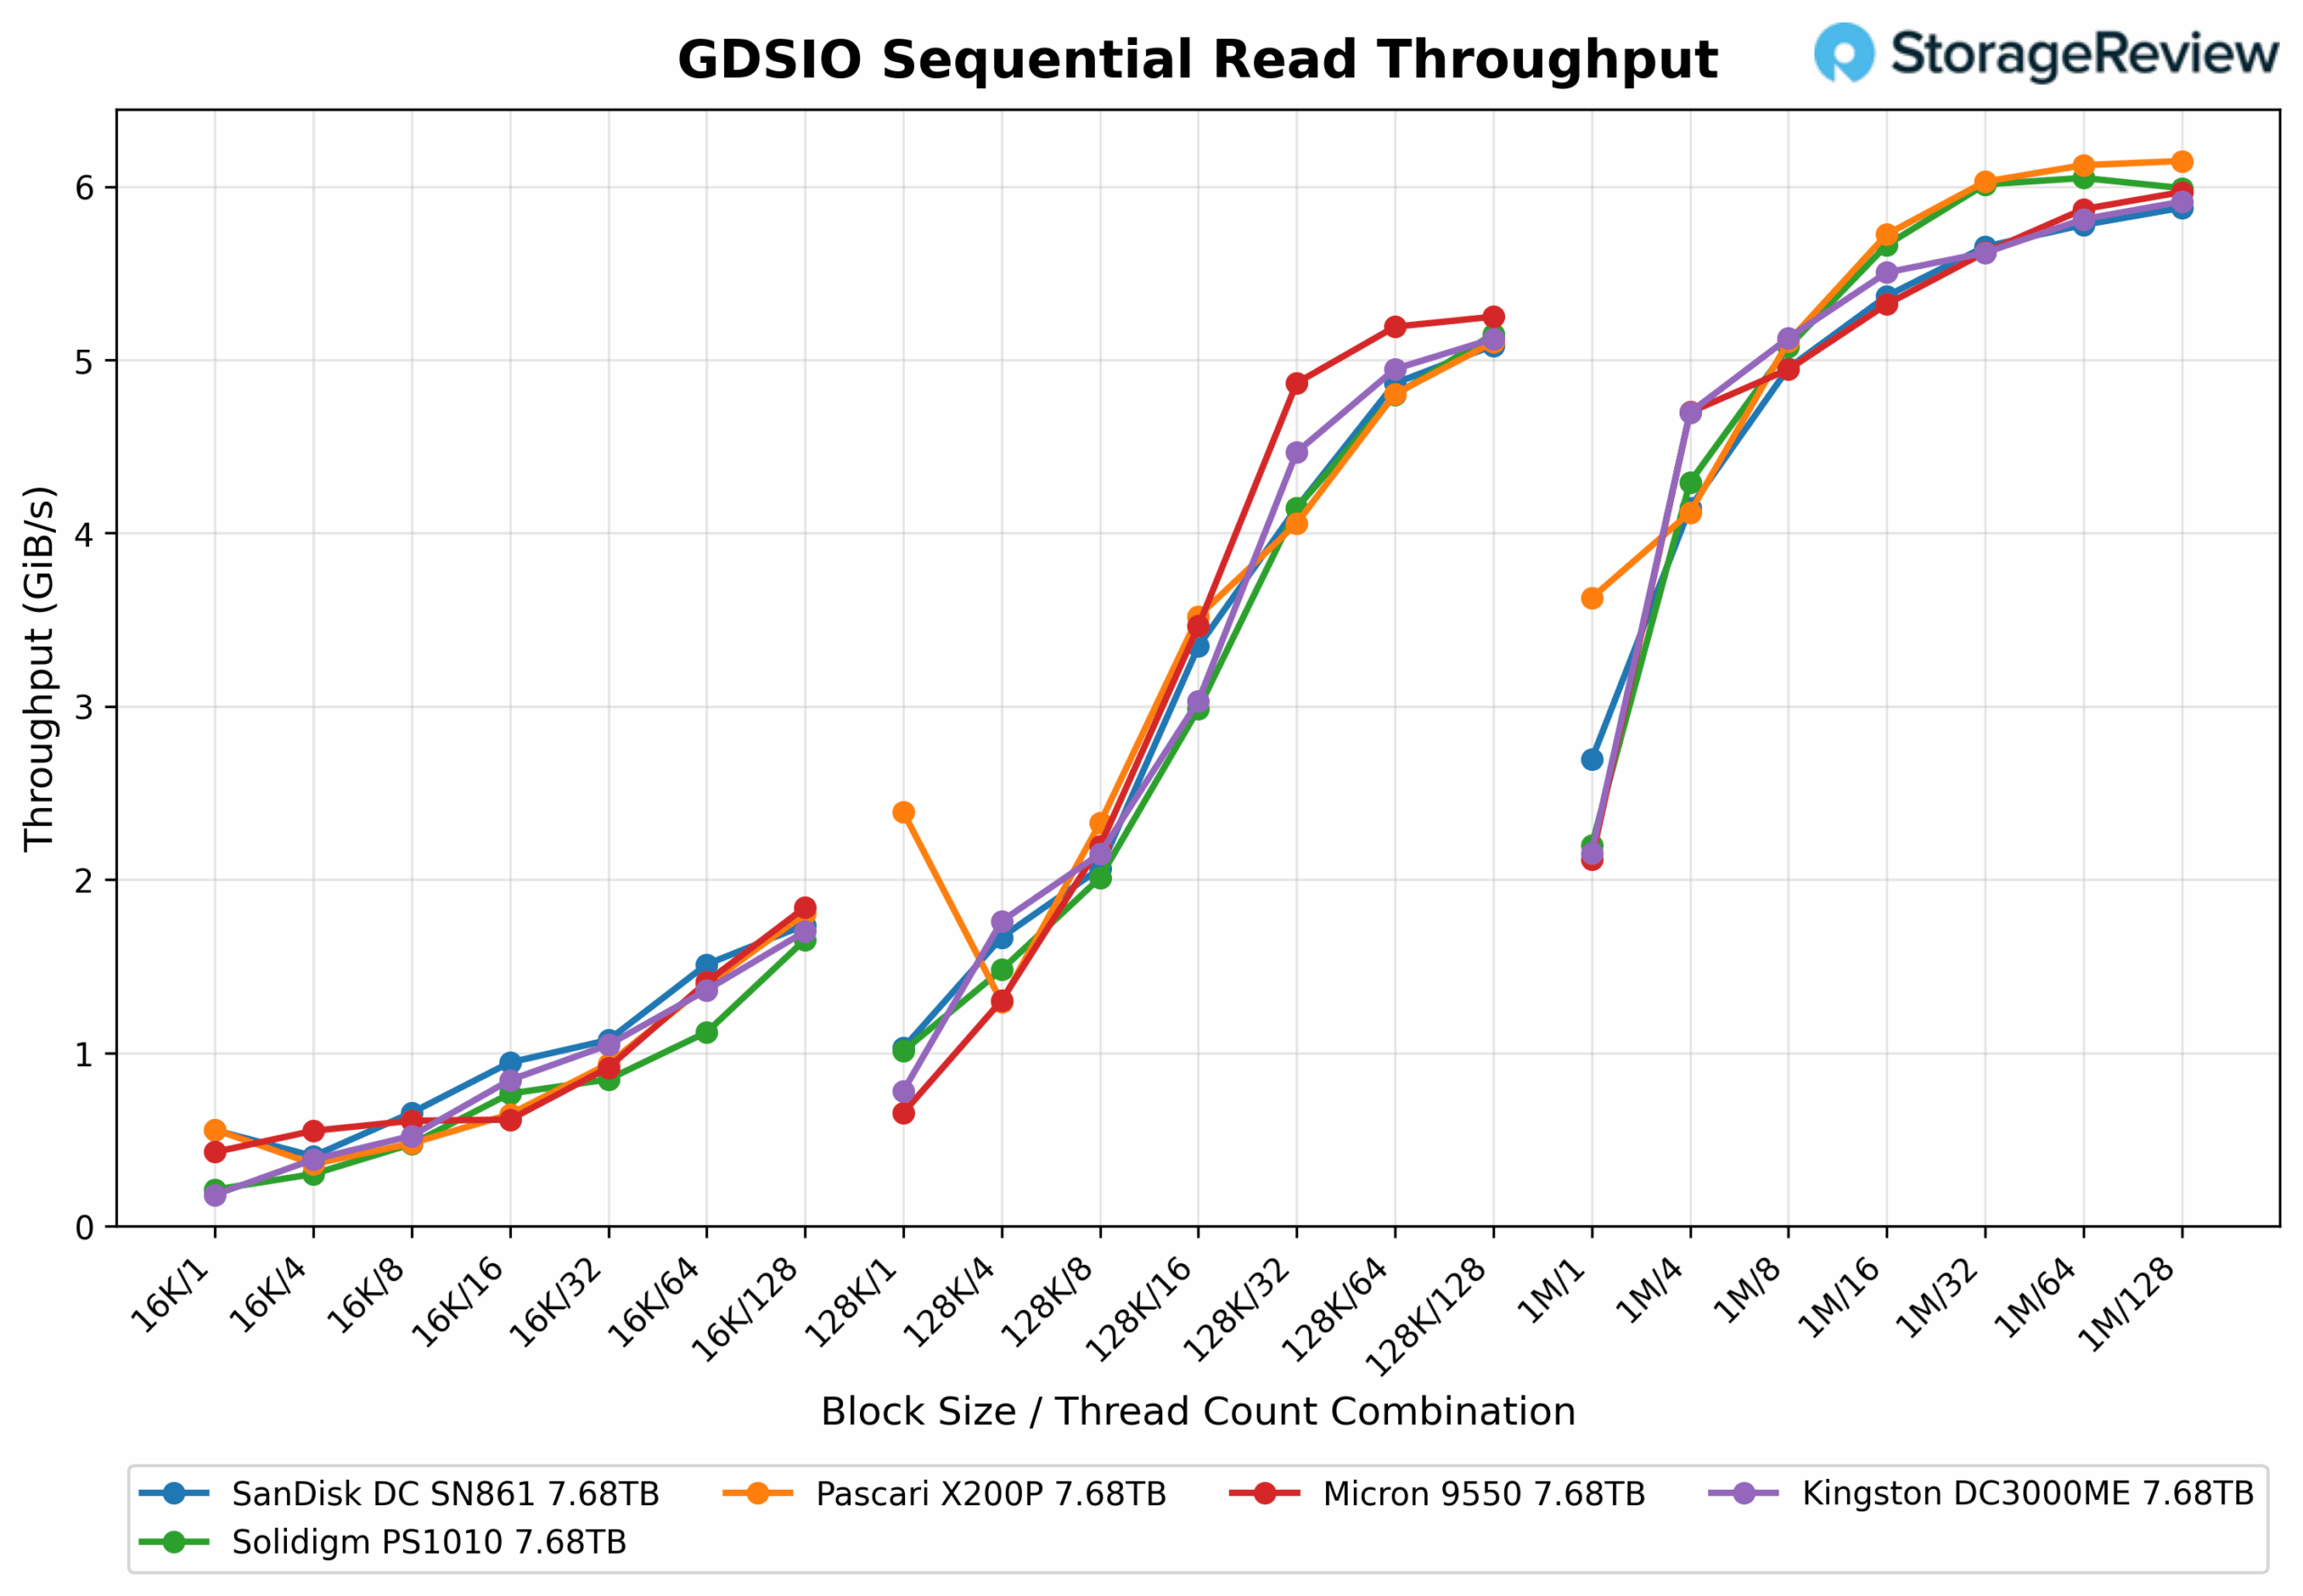
Read Throughput
Across our GDSIO sequential read testing, the Kingston DC3000ME demonstrated consistent and efficient throughput scaling across the 16K, 128K, and 1MB block sizes, though performance trends varied slightly by transfer size. With 16K blocks, throughput rose steadily with increasing thread count, with the Kingston DC3000ME peaking at 3.70GiB/s by 32 threads before gradually tapering off to 3.41GiB/s at 128 threads. For 128K transfers, the drive achieved its best result of 5.88GiB/s at 16 threads and maintained that level through 32 threads before dropping to around 5.35GiB/s by 128 threads. At a 1MB size, the Kingston DC3000ME throughput plateaued earlier, achieving 6.54 GiB/s at 16 threads and declining modestly to 5.91GiB/s at 128 threads.
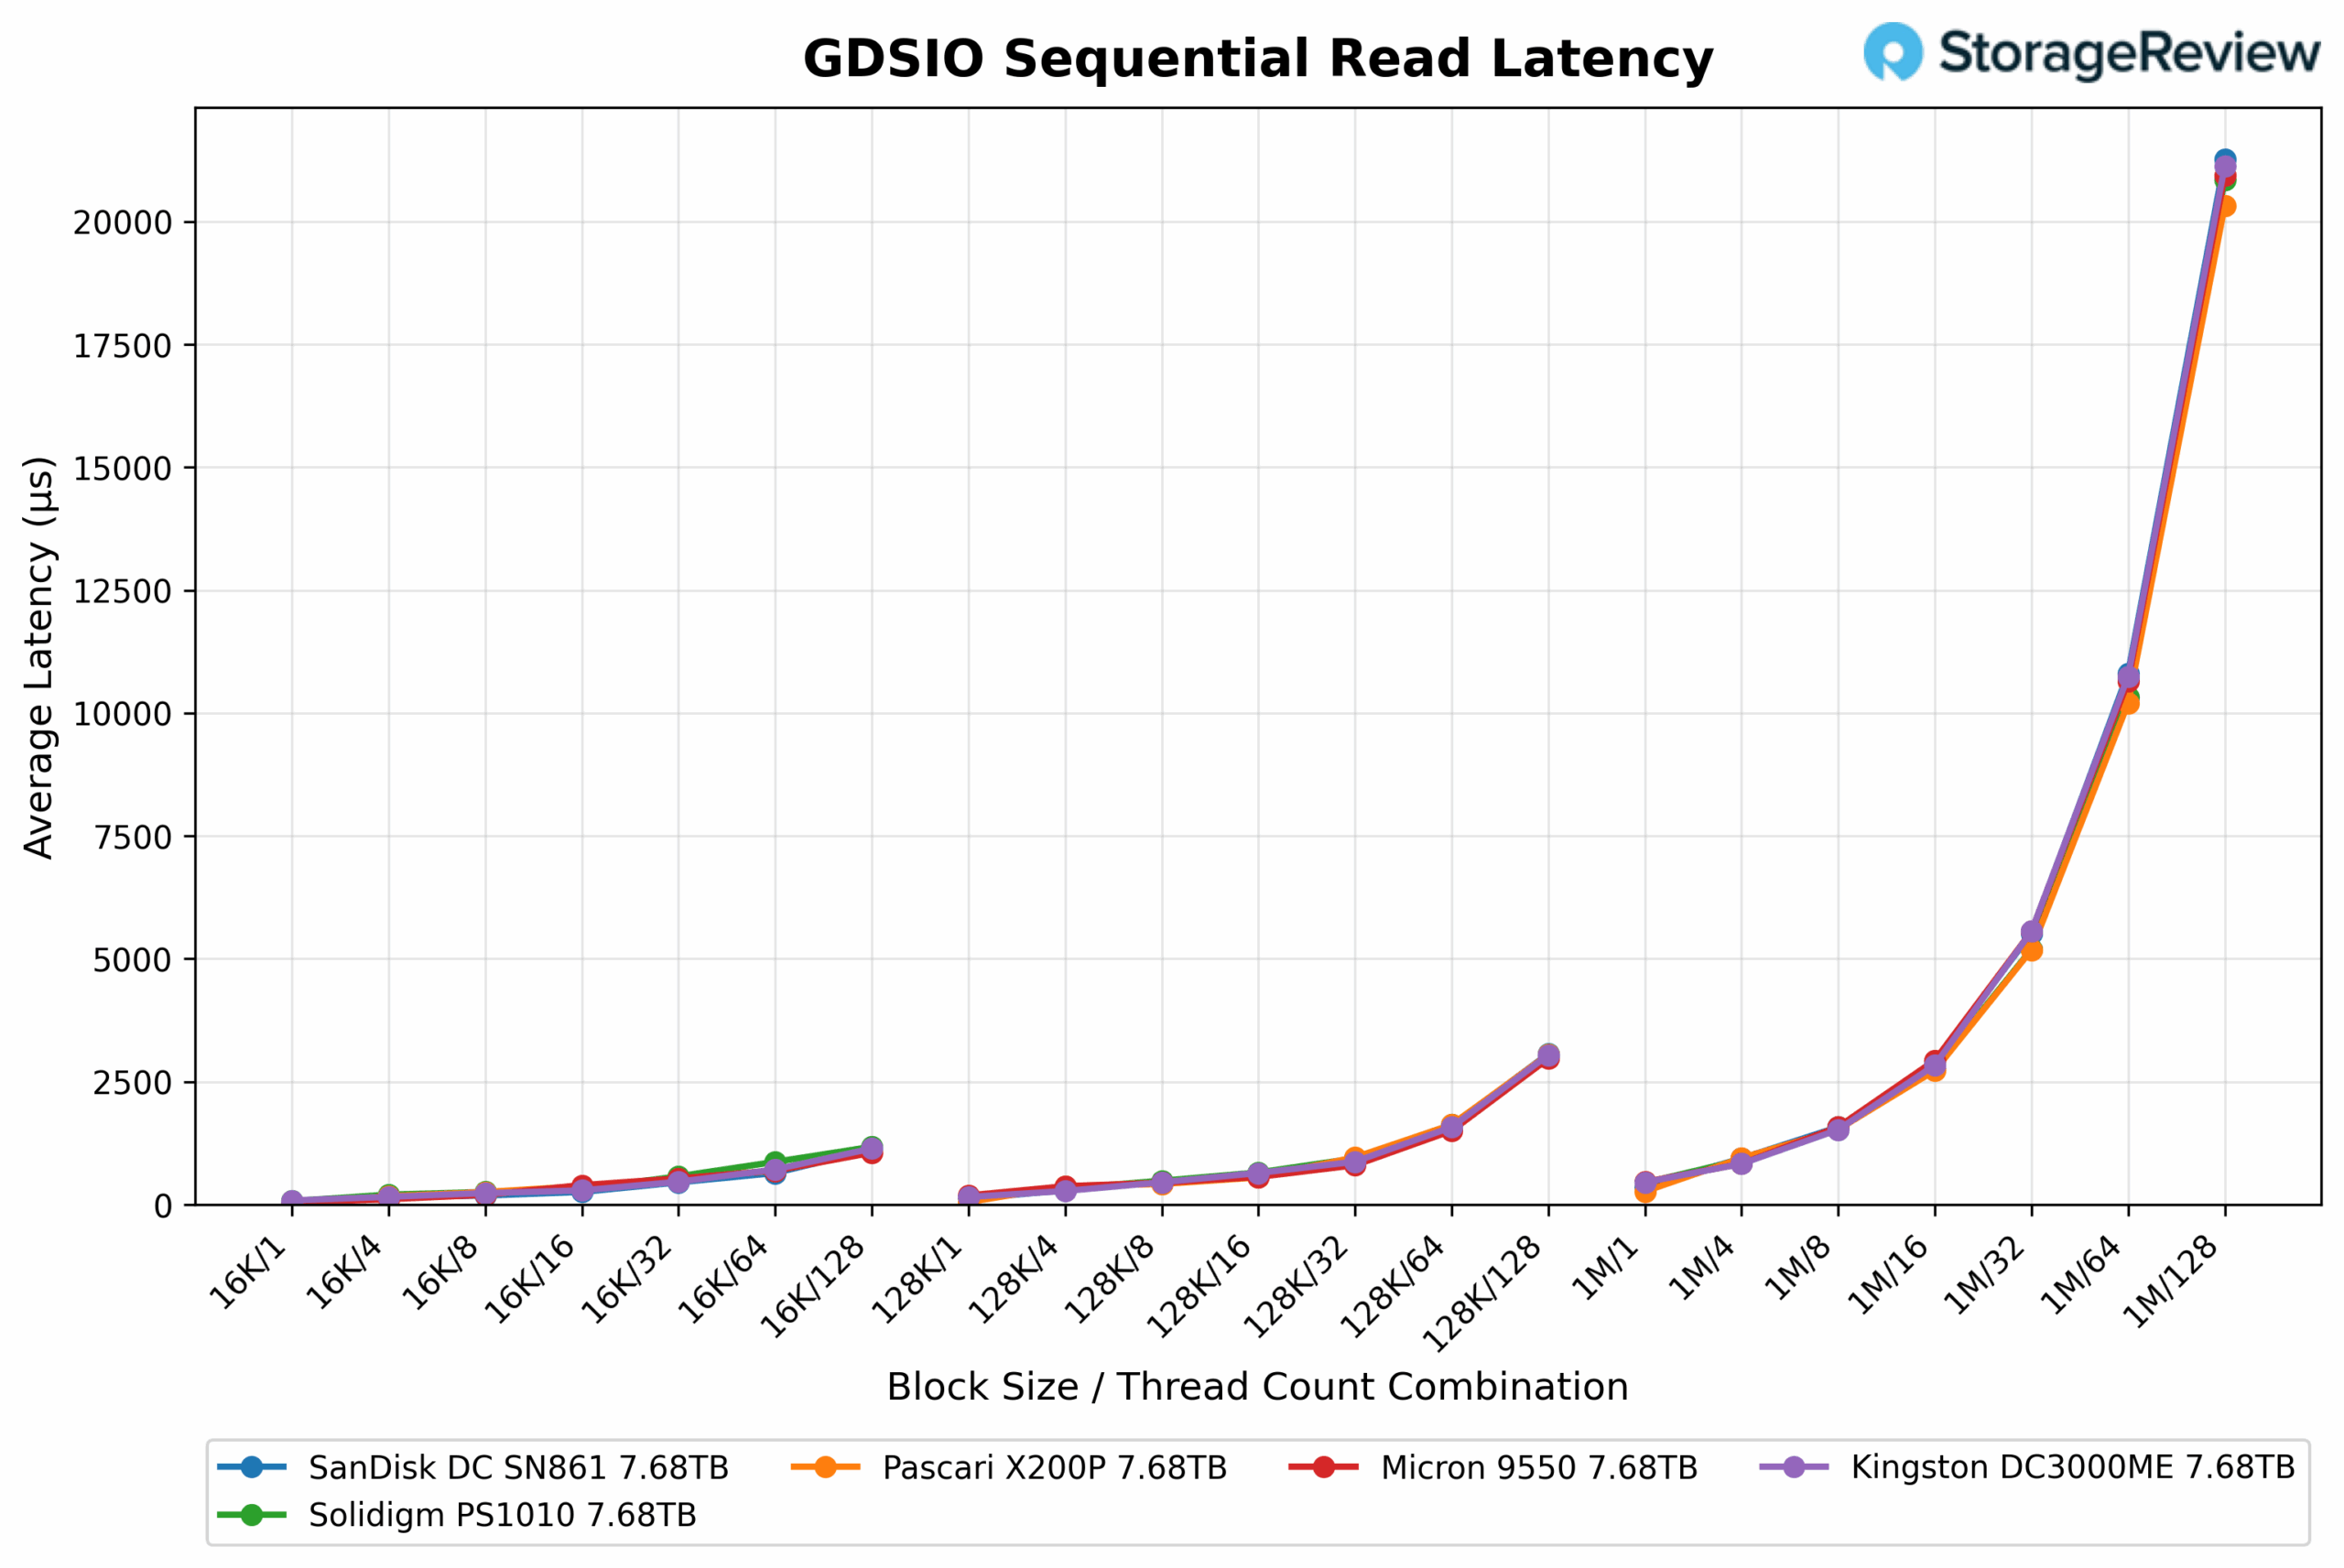
Read Latency
In terms of latency, the DC3000ME showed predictable scaling (which was the case with all tested drives): lower thread counts yielded lower response times across all block sizes, with latency increasing as threads scaled up. At 16K, latency started at 504µs and gradually increased to 582µs by 128 threads. For 128K, the latency of the Kingston DC3000ME began at 2,60µs and increased to 3,228µs at the highest thread count. With 1MB blocks, latency showed a larger jump due to the heavier payload, starting at 2,609µs with one thread and increasing to 2,703µs at 128 threads.
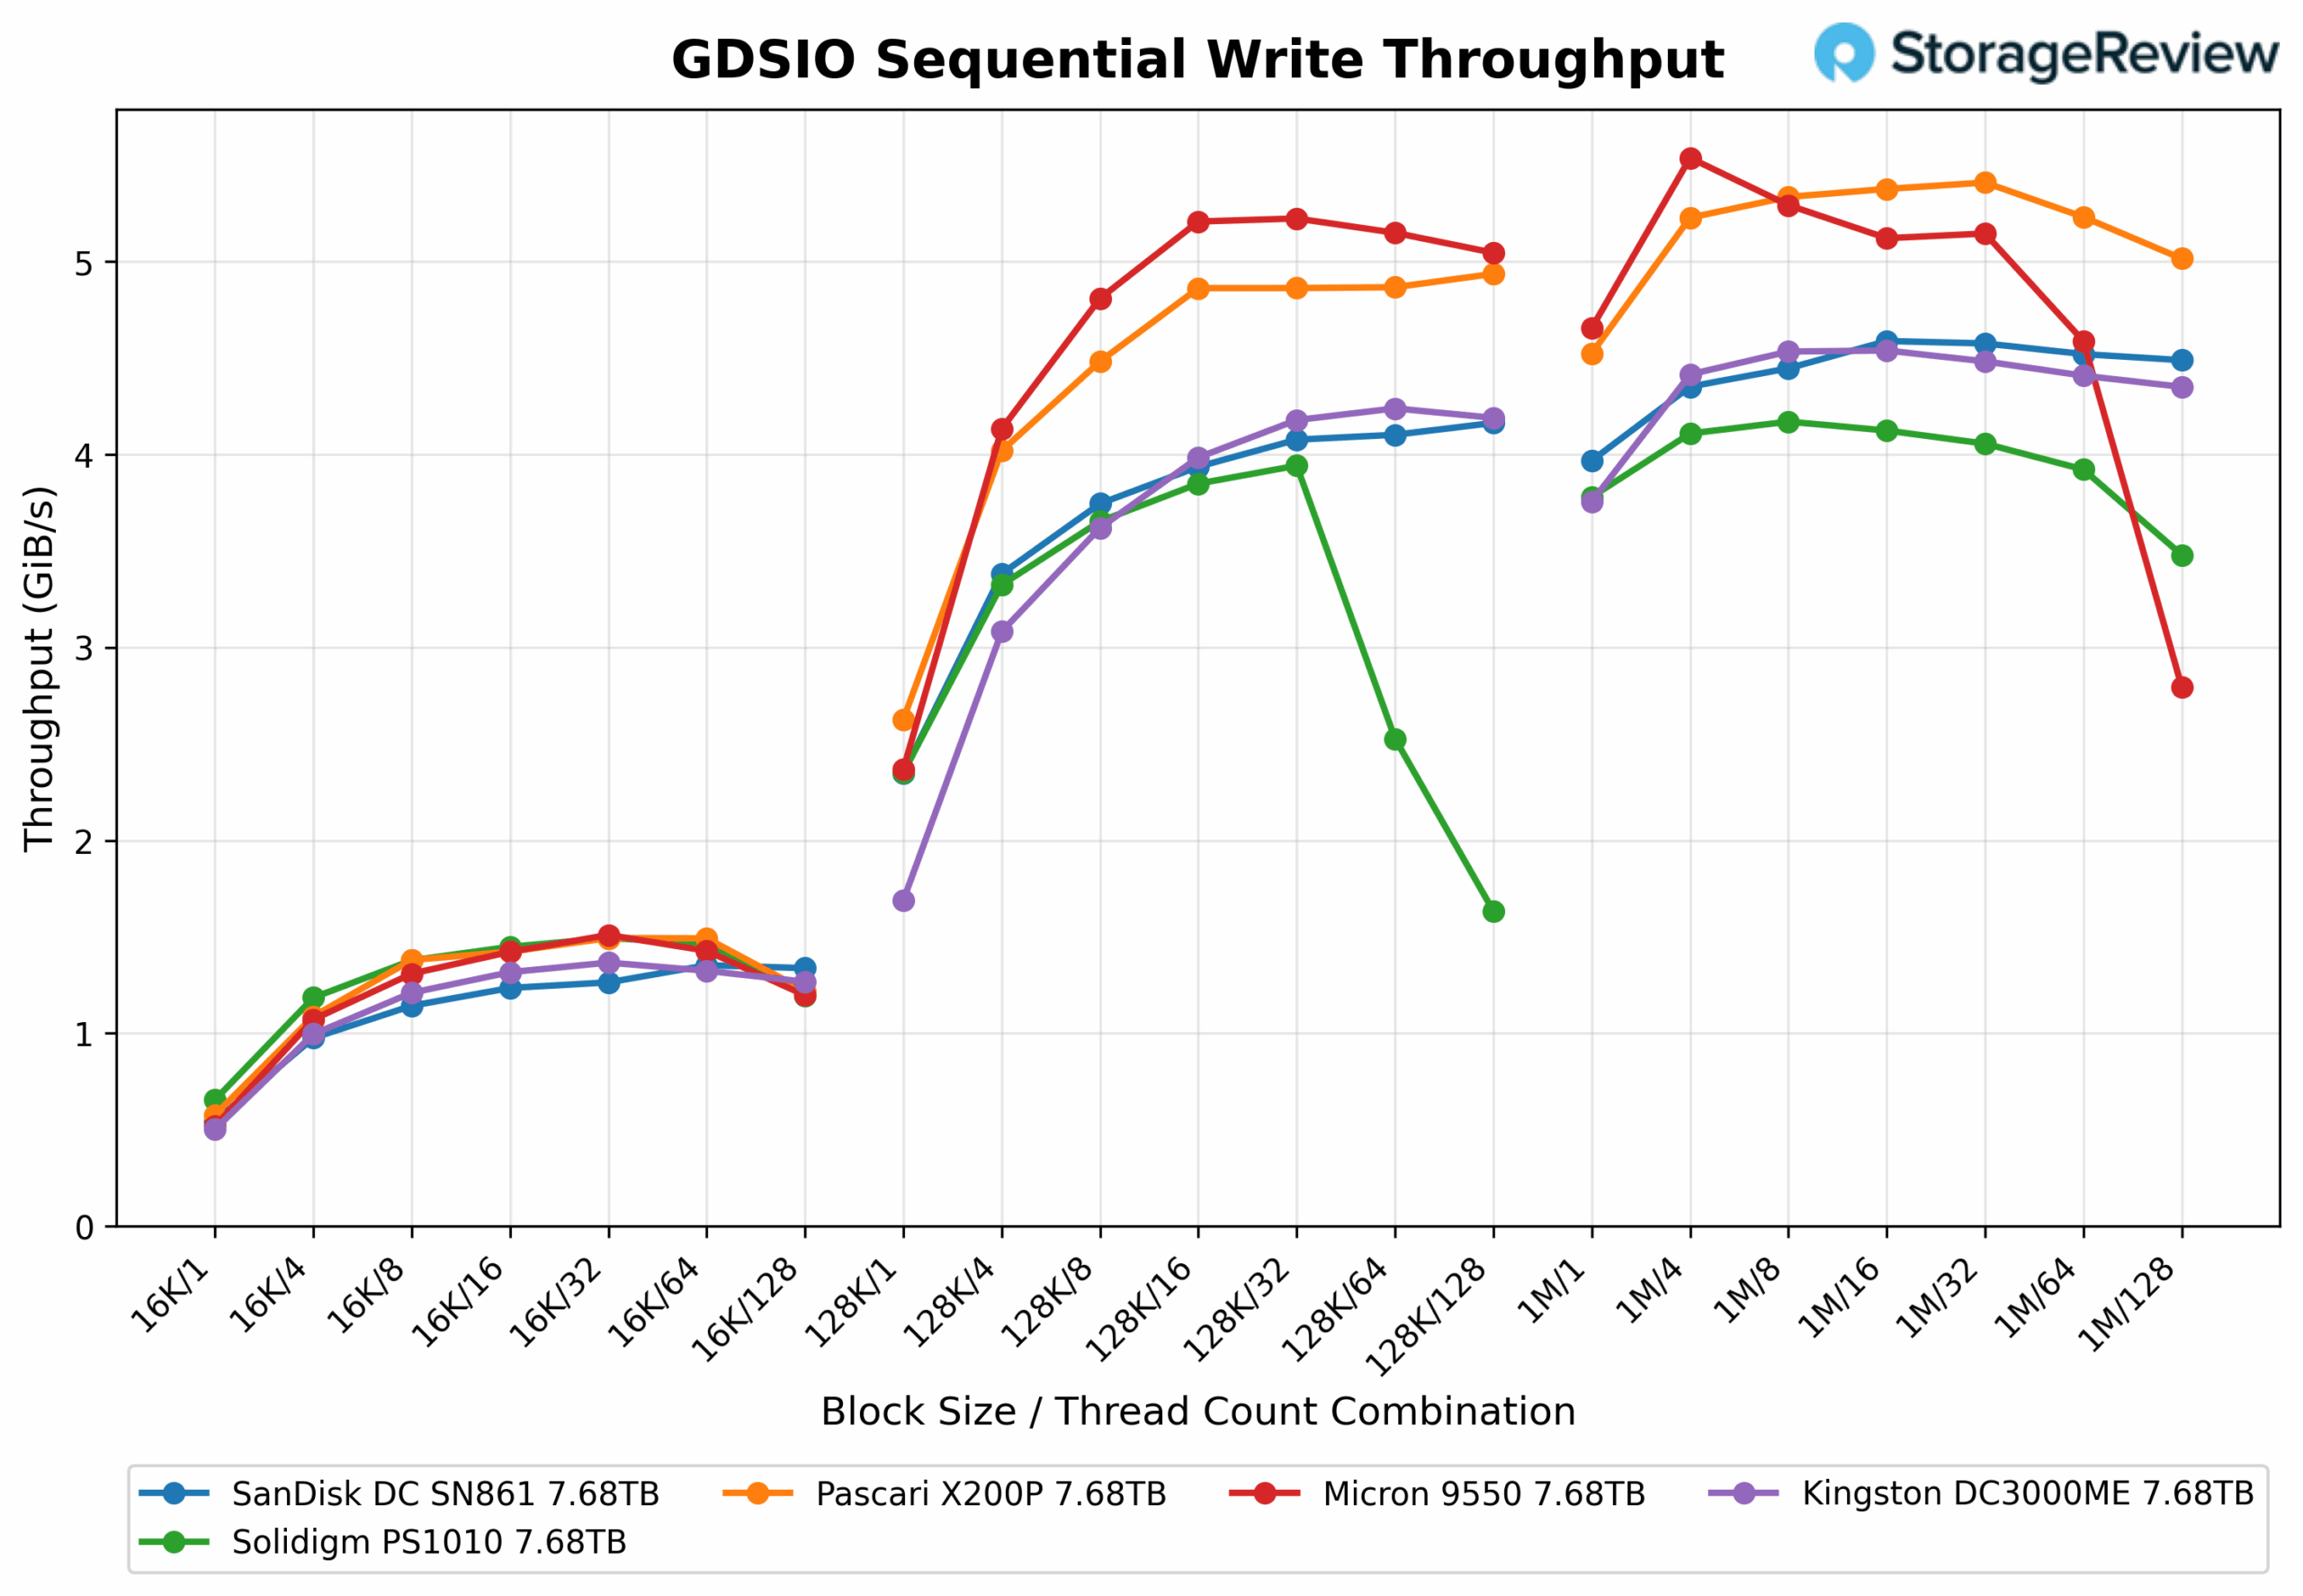
Write Throughput
For read operations, the average latency with 16K blocks started at 2,247µs with a single thread and decreased to 504µs at 128 threads, demonstrating efficient scaling under concurrency. For the 128K block size, latency initially began at 4,035µs and gradually decreased to 2,601µs with 128 threads. With 1M blocks, the Kingston DC3000ME had the lowest latency overall, starting at 2,609µs with one thread and remaining in the 2,500–2,700µs range through 128 threads, demonstrating consistent responsiveness for large sequential reads.
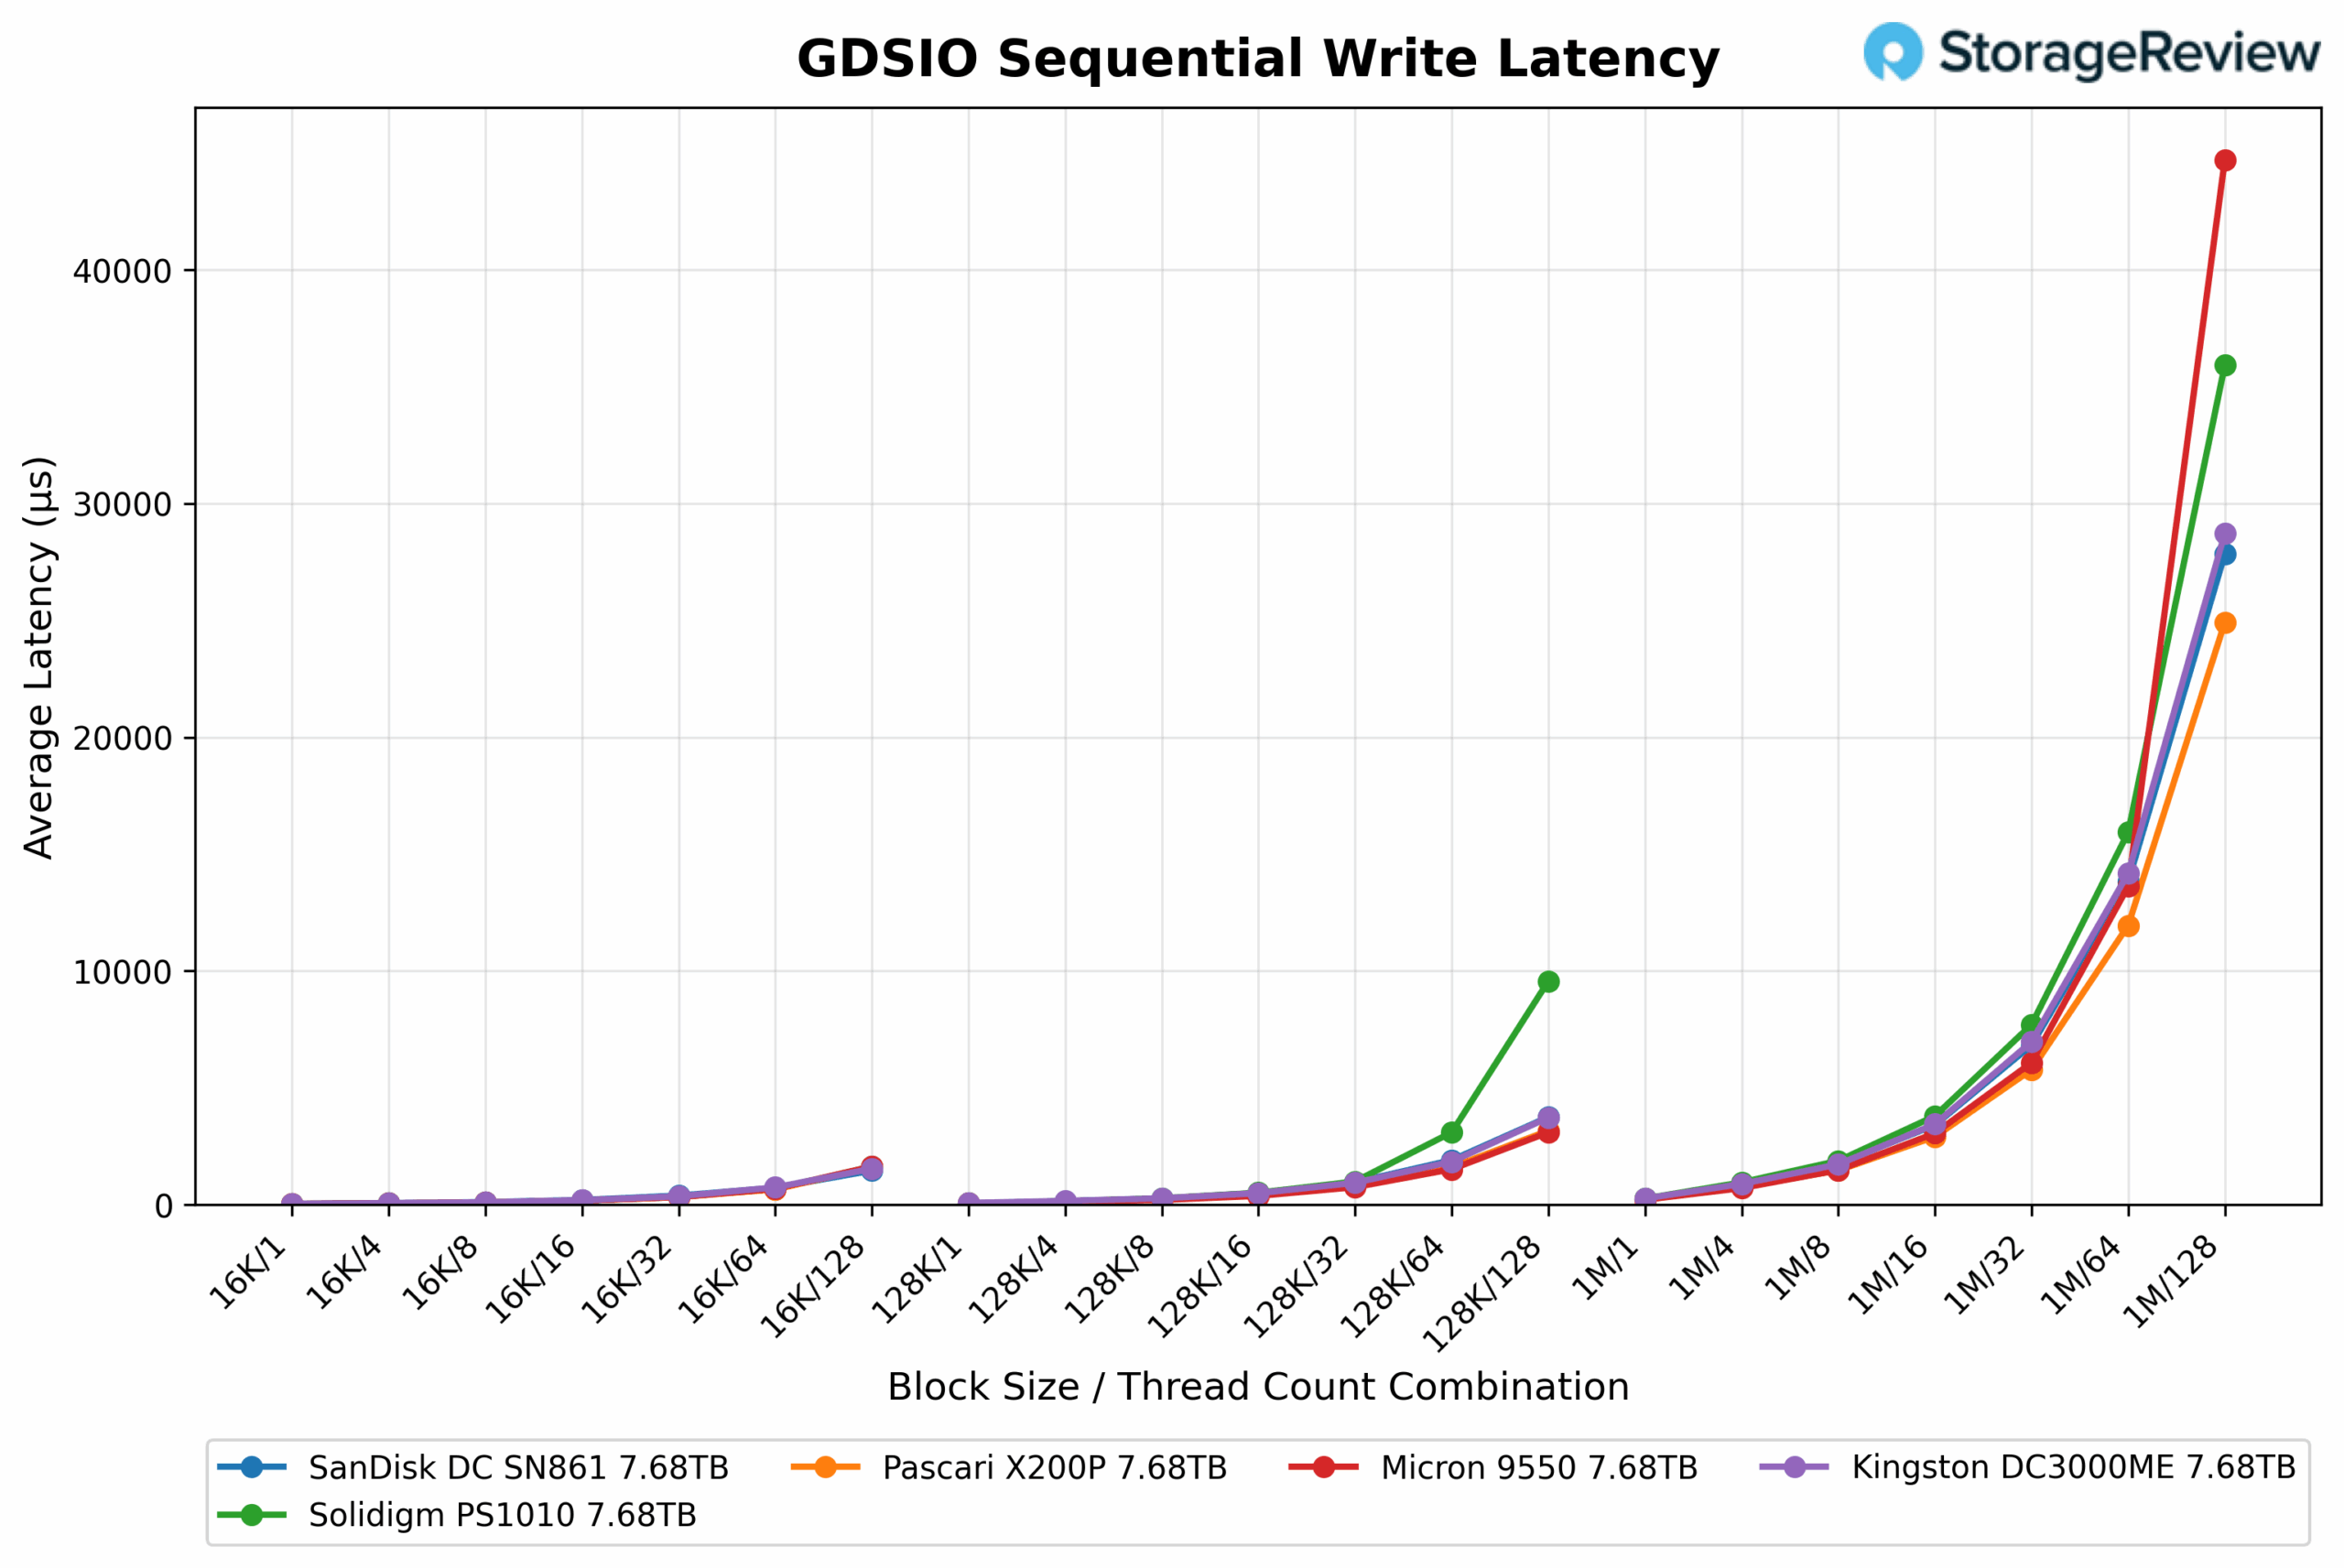
Write Latency
Average latency remained relatively stable across thread counts from 1 to 16, hovering around 12,234 to 14,247µs. At 32 threads, latency slightly increased to 15,559µs and climbed to 20,944µs at 64 threads. A notable spike occurred at 128 threads, where Kingston DC3000ME latency jumped to 28,725µs, more than doubling the prior level.
Conclusion
The Kingston DC3000ME is positioned as a practical solution for mainstream enterprise and data center deployments, where reliability, consistent performance, and a solid set of enterprise features are key requirements. This drive caters to the needs of system integrators, value-added resellers (VARs), and IT teams in SMB and SME environments who build and manage their infrastructure. Its U.2 form factor and PCIe Gen5 support provide broad compatibility and future-ready bandwidth, making it a strong candidate for channel-driven deployments.
From a performance perspective, the DC3000ME delivers competitive throughput and efficiency across a range of workloads. Its strengths lie in solid sequential reads, good write consistency, and consistent latency scaling under mixed and random workloads. While it occasionally trails top Gen5 performers, such as Micron and SanDisk, in certain heavy CDN or checkpointing benchmarks, it remains competitive, especially in sustained mixed-load scenarios and moderate concurrency.
Overall, the DC3000ME is a strong fit for general-purpose enterprise workloads, meeting the needs of organizations looking to deploy high-performance storage without relying on highly customized OEM solutions. VARs and systems builders will find plenty to appreciate here, particularly when balancing cost, performance, and scalability in practical infrastructure deployments.
Engage with StorageReview
Newsletter | YouTube | Podcast iTunes/Spotify | Instagram | Twitter | TikTok | RSS Feed