

Phison’s Pascari X-Series lineup is developed to meet various enterprise storage requirements, offering customized solutions for read- and write-intensive workloads. The X200P is the high-capacity model, supporting up to 30.72TB with one DWPD (Drive Writes Per Day). It uses Gen5 PCIe, TLC NAND, and is available in U.3, U.2, and E3.S form factors. The X200P is designed for a wide range of use cases, including large-scale content delivery, AI inference, and cold data archiving.
Phison also offers the X200E high-endurance models, which are optimized for write-intensive workloads, supporting up to three DWPD and capacities ranging from 1.6TB to 25.6TB, making them well-suited for transactional databases, real-time analytics, and log processing.
For this review, Phison sent over the 7.68TB X200P U.2 model. We put it through our full suite of enterprise benchmarks to evaluate its performance under pressure.
Phison Pascari X200P Series Specifications
| Specifications Phison Pascari X200P Series | 1.92TB | 3.84TB | 7.68TB | 15.36TB | 30.72TB |
|---|---|---|---|---|---|
| Form Factor | U.2 | ||||
| Interface | PCIe 5.0 x4, 2×2 | ||||
| NVMe | 2.0 | ||||
| NAND Flash | 3D TLC | ||||
| Sequential Read (MB/s) | 14,800 | 14,800 | 14,800 | 14,800 | 14,000 (Est.) |
| Sequential Write (MB/s) | 4,300 | 8,600 | 8,700 | 8,350 | 7,500 (Est.) |
| 4K Random Read (IOPS) | 2,400K | 3,000K | 3,000K | 3,000K | 2,300K (Est.) |
| 4K Random Write (IOPS) | 170K | 380K | 500K | 500K | 283K (Est.) |
| Read Latency (μs) | 60 | ||||
| Write Latency (μs) | 10 | ||||
| Power – Active (W) | <25 | ||||
| Power – Idle (W) | 5 | ||||
| DWPD(7) | 1 | ||||
| UBER | <1 sector per 1018 bits read | ||||
| MTBF (million hours) | 2.5 | ||||
| Limited Warranty (years) | 5 | ||||
| Operating Temp. (°C) | 0 to 70 | ||||
| Non-Operating Temp. (°C) | -40 to 85 | ||||
| Dimensions (mm) | 100.10 (L) x 69.85 (W) x 15.00 (H) | ||||
| Weight (g) | 188 | 199 | 201 | 168 | <250 |
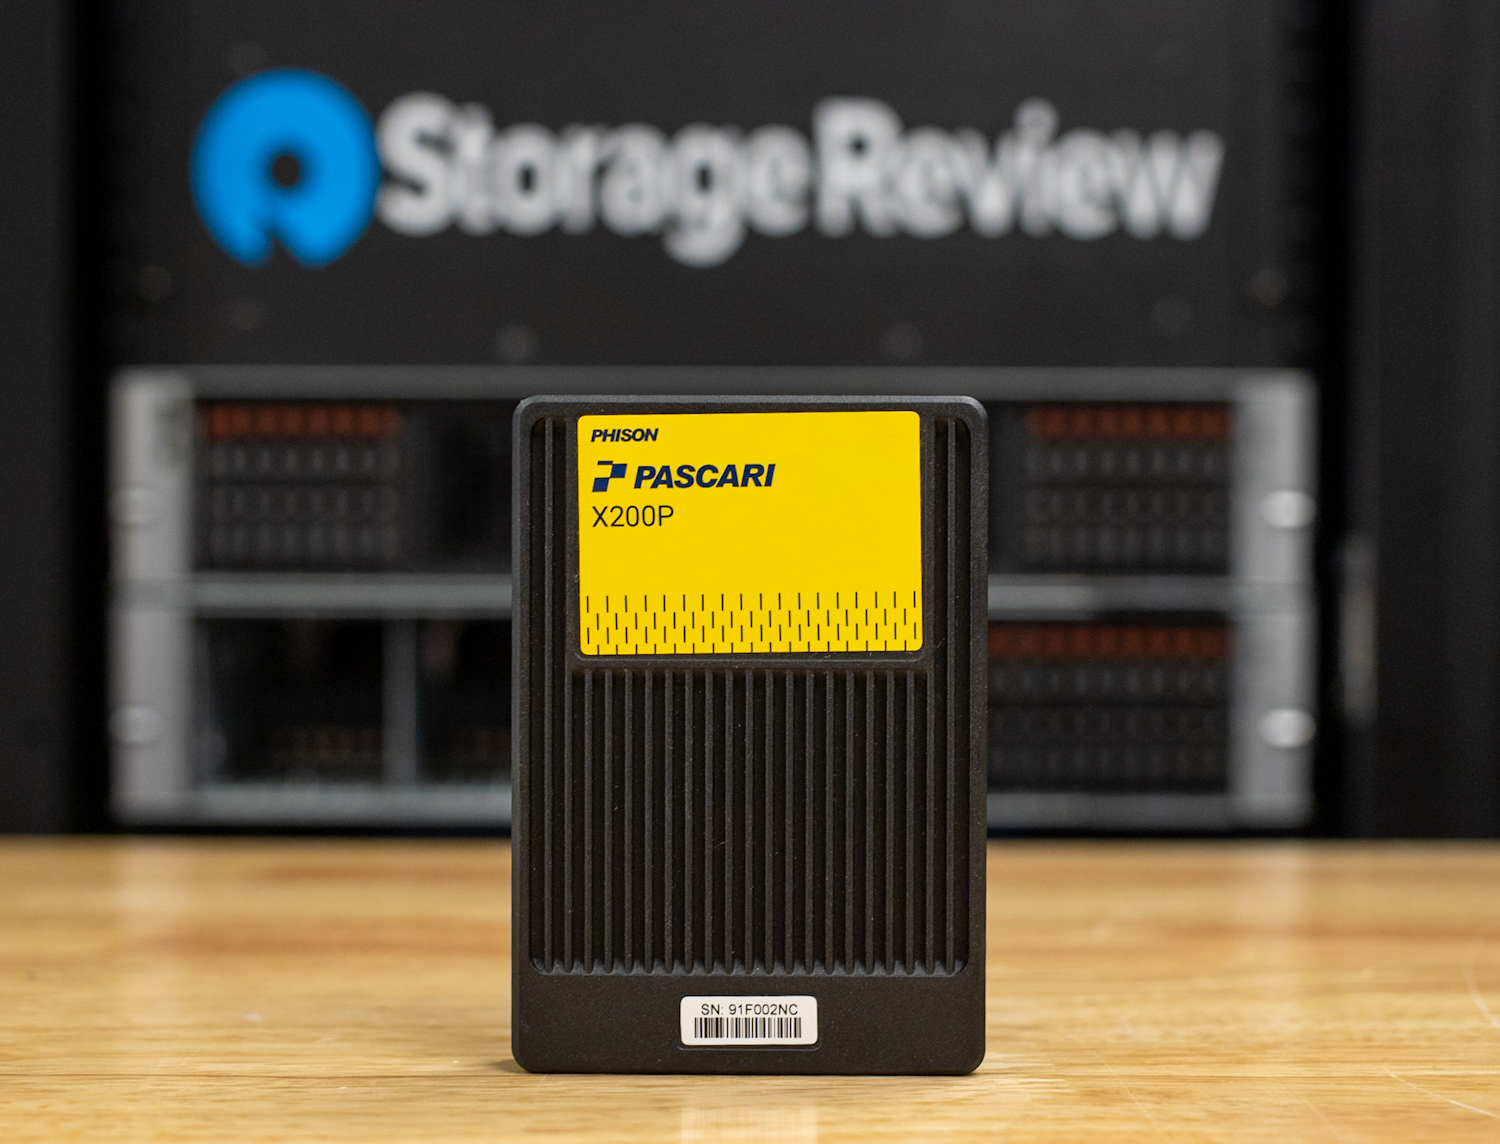
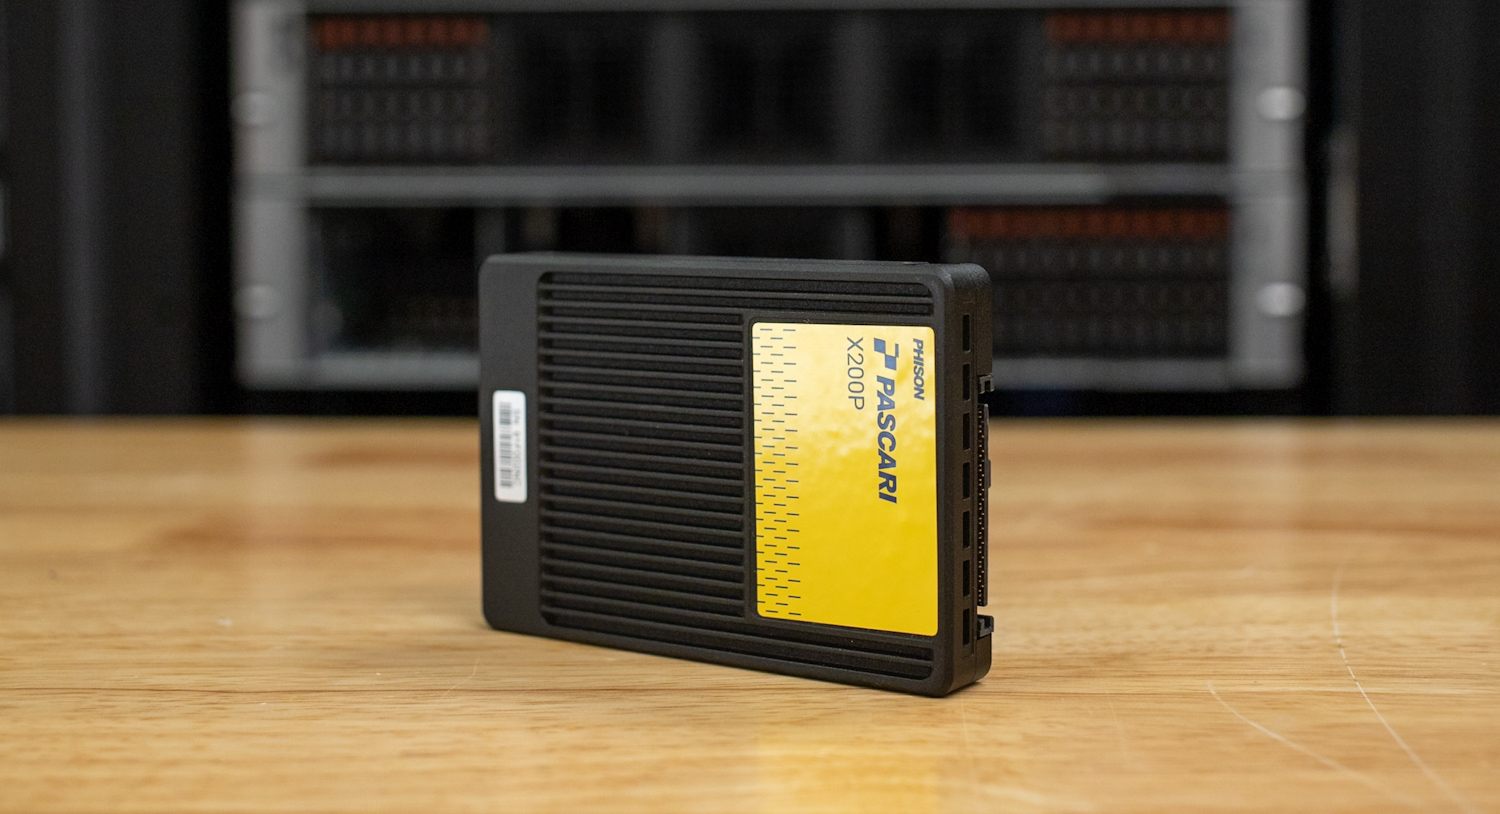
Build and Design Pascari X200P 7.68TB
Our test unit is the 7.68TB U.2 2.5″ version of X200P, designed to tackle high-performance enterprise storage applications. It utilizes a PCIe 5.0 interface, fully compliant with the NVMe 2.0 specification. The drive is built around high-endurance 3D TLC NAND and supports capacities up to 30.72TB.
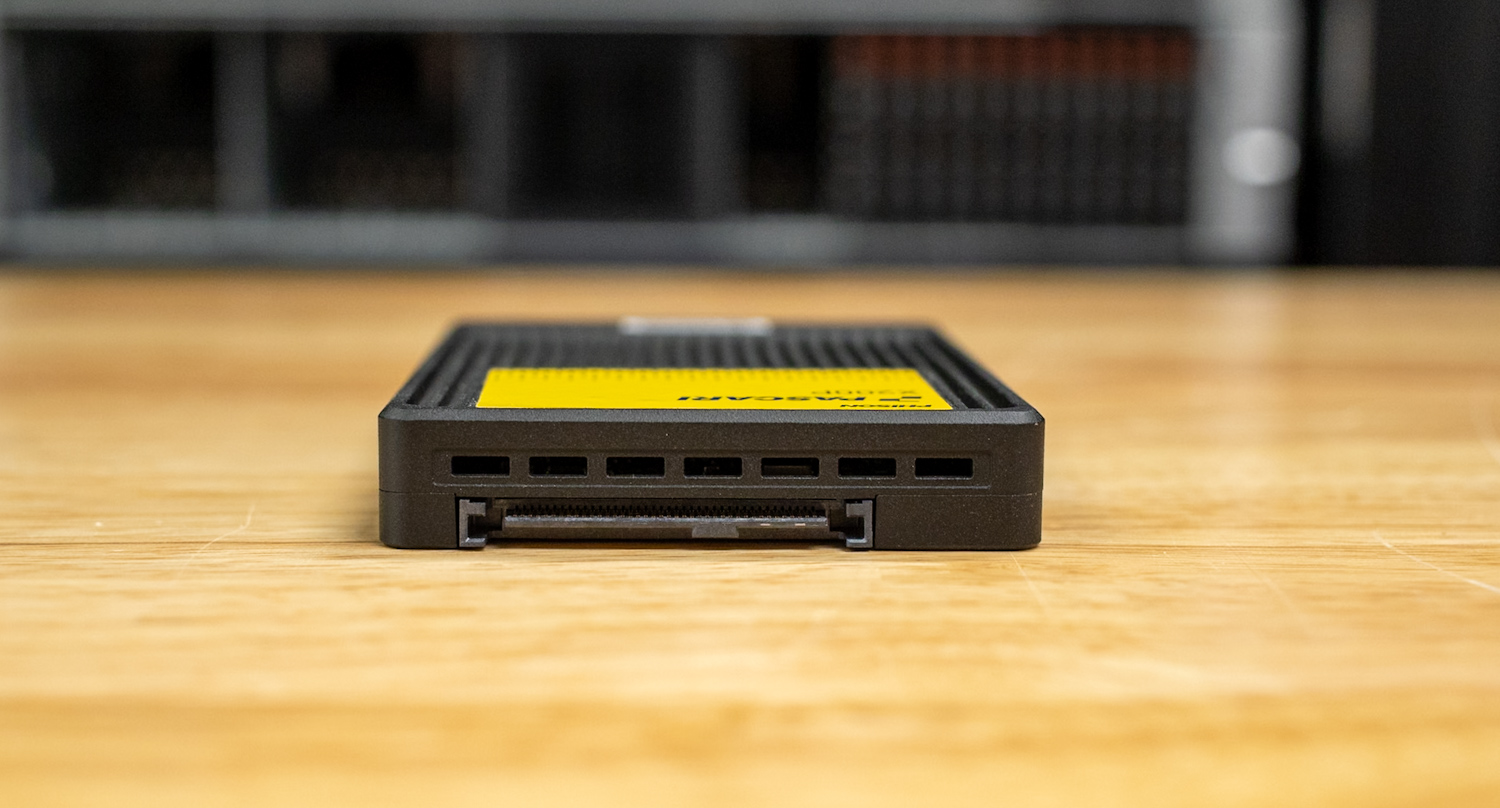
Physically, the X200P features a standard 2.5″ U.2 form factor, measuring 100.10mm in length, 69.85mm in width, and 15.00mm in height, with a weight of 201 grams. The entire assembly is housed in a sleek, black aluminum case with integrated passive cooling, designed to efficiently manage thermals under sustained, heavy workloads. The drive also supports E3.S configurations for flexibility in dense storage environments.
From a performance standpoint, it is rated for up to 14,800MB/s sequential read, 8,700MB/s sequential write, and up to 3 million IOPS random read and 500K IOPS random write. The drive maintains an active power consumption below 25W, idling at just 5W, making it an efficient option for sustained high-throughput operations.
The endurance rating is 1 DWPD, with an MTBF of 2.5 million hours and a 5-year limited warranty. It is designed for 24/7 enterprise workloads with an operating temperature range of 0°C to 70°C.
Phison includes a comprehensive set of enterprise-class data protection and manageability features:
- Power Loss Protection (PLP)
- ISE (Instant Secure Erase), TCG Opal 2.0 Support
- AES-XTS 256-bit Encryption
- End-to-End Data Path Protection
- Metadata Protection
- SECDED (Single Error Correction Double Error Detection)
- Sanitize operations
- NVMe-MI (Management Interface)
- SMBus compatibility
- Support for up to 128 namespaces
Altogether, the Pascari X200P lineup combines robust industrial-grade build quality with cutting-edge performance and enterprise-grade reliability, making it a strong candidate for demanding storage environments such as cloud, AI/ML, and virtualized infrastructures.
Performance Testing
Drive Testing Platform
We leverage a Dell PowerEdge R760 running Ubuntu 22.04.02 LTS as our test platform across all the workloads in this review. Equipped with a Serial Cables Gen5 JBOF, it offers wide compatibility with U.2, E1.S, E3.S and M.2 SSDs Our system configuration is outlined below:
- 2 x Intel Xeon Gold 6430 (32-Core, 2.1GHz)
- 16 x 64GB DDR5-4400
- 480GB Dell BOSS SSD
- Serial Cables Gen5 JBOF
Drives Compared
- Pascari X200P 7.68TB
- Micron 9550 7.68TB
- SanDisk SN861 7.68TB
- Solidigm PS1010 7.68TB
- Kingston DC3000ME 7.68TB
We conducted a comparison of the Pascari X200P with a group of 7.68TB PCIe Gen5 NVMe SSDs that were similar in size and utilized TLC NAND flash. The comparison included the Micron 9550, SanDisk SN861, Solidigm PS1010, and Kingston DC3000ME. These drives represent mid-capacity enterprise-class solutions designed for high-performance environments. Testing was conducted using a range of real-world and synthetic benchmarks, including CDN, FIO, and GDSIO, to measure performance across sustained throughput, latency, mixed I/O patterns, and GPU-accelerated workloads. By standardizing capacity, interface, and NAND type, this evaluation provides a clear comparison of how the Pascari X200P performs against its peers under demanding conditions.
CDN Performance
To simulate a realistic, mixed-content CDN workload, the SSDs were subjected to a multi-phase benchmarking sequence designed to replicate the I/O patterns of content-heavy edge servers. The testing procedure encompasses a range of block sizes, including both large and small, distributed across random and sequential operations, with varying concurrency levels.
Before the main performance tests, each SSD completed a total device fill with a 100% sequential write pass using 1MB blocks. This process utilized synchronous I/O and a queue depth of four, allowing for four simultaneous jobs. This phase ensures the drive enters a steady-state condition representative of real-world usage. Following the sequential fill, a secondary three-hour randomized write saturation stage was executed using a weighted block size split (block size/percentage) distribution, heavily favoring 128K transfers (98.51%), with minor contributions from sub-128K blocks down to 8K. This step emulates fragmented and uneven write patterns often seen in distributed cache environments.
The main testing suite focused on scaled random read and write operations to measure the drive’s behavior under variable queue depths and job concurrency. Each test ran for five minutes (300 seconds) and was followed by a three-minute idle period, allowing internal recovery mechanisms to stabilize performance metrics.
- Executed using a fixed block size distribution favoring 128K (98.51%), with the remaining 1.49% of operations composed of smaller transfer sizes ranging from 64K to 8K. Each configuration varied across 1, 2, and 4 concurrent jobs, with queue depths of 1, 2, 4, 8, 16, and 32, to profile throughput scalability and latency under typical edge-write conditions.
- A heavily mixed block size profile, mimicking CDN content retrieval, was used, starting with a dominant 128K (83.21%) component and followed by a long tail of over 30 smaller block sizes, spanning from 4K to 124K, each with fractional frequency representation. This distribution reflects the diverse request patterns encountered during video segment fetching, thumbnail access, and metadata lookups. These tests were also run across the complete matrix of job counts and queue depths.
This combination of preconditioning, saturation, and mixed-size randomized access tests is designed to reveal how SSDs handle sustained CDN-like environments, emphasizing responsiveness and efficiency in bandwidth-heavy and highly parallelized scenarios.
CDN Workload Read 1
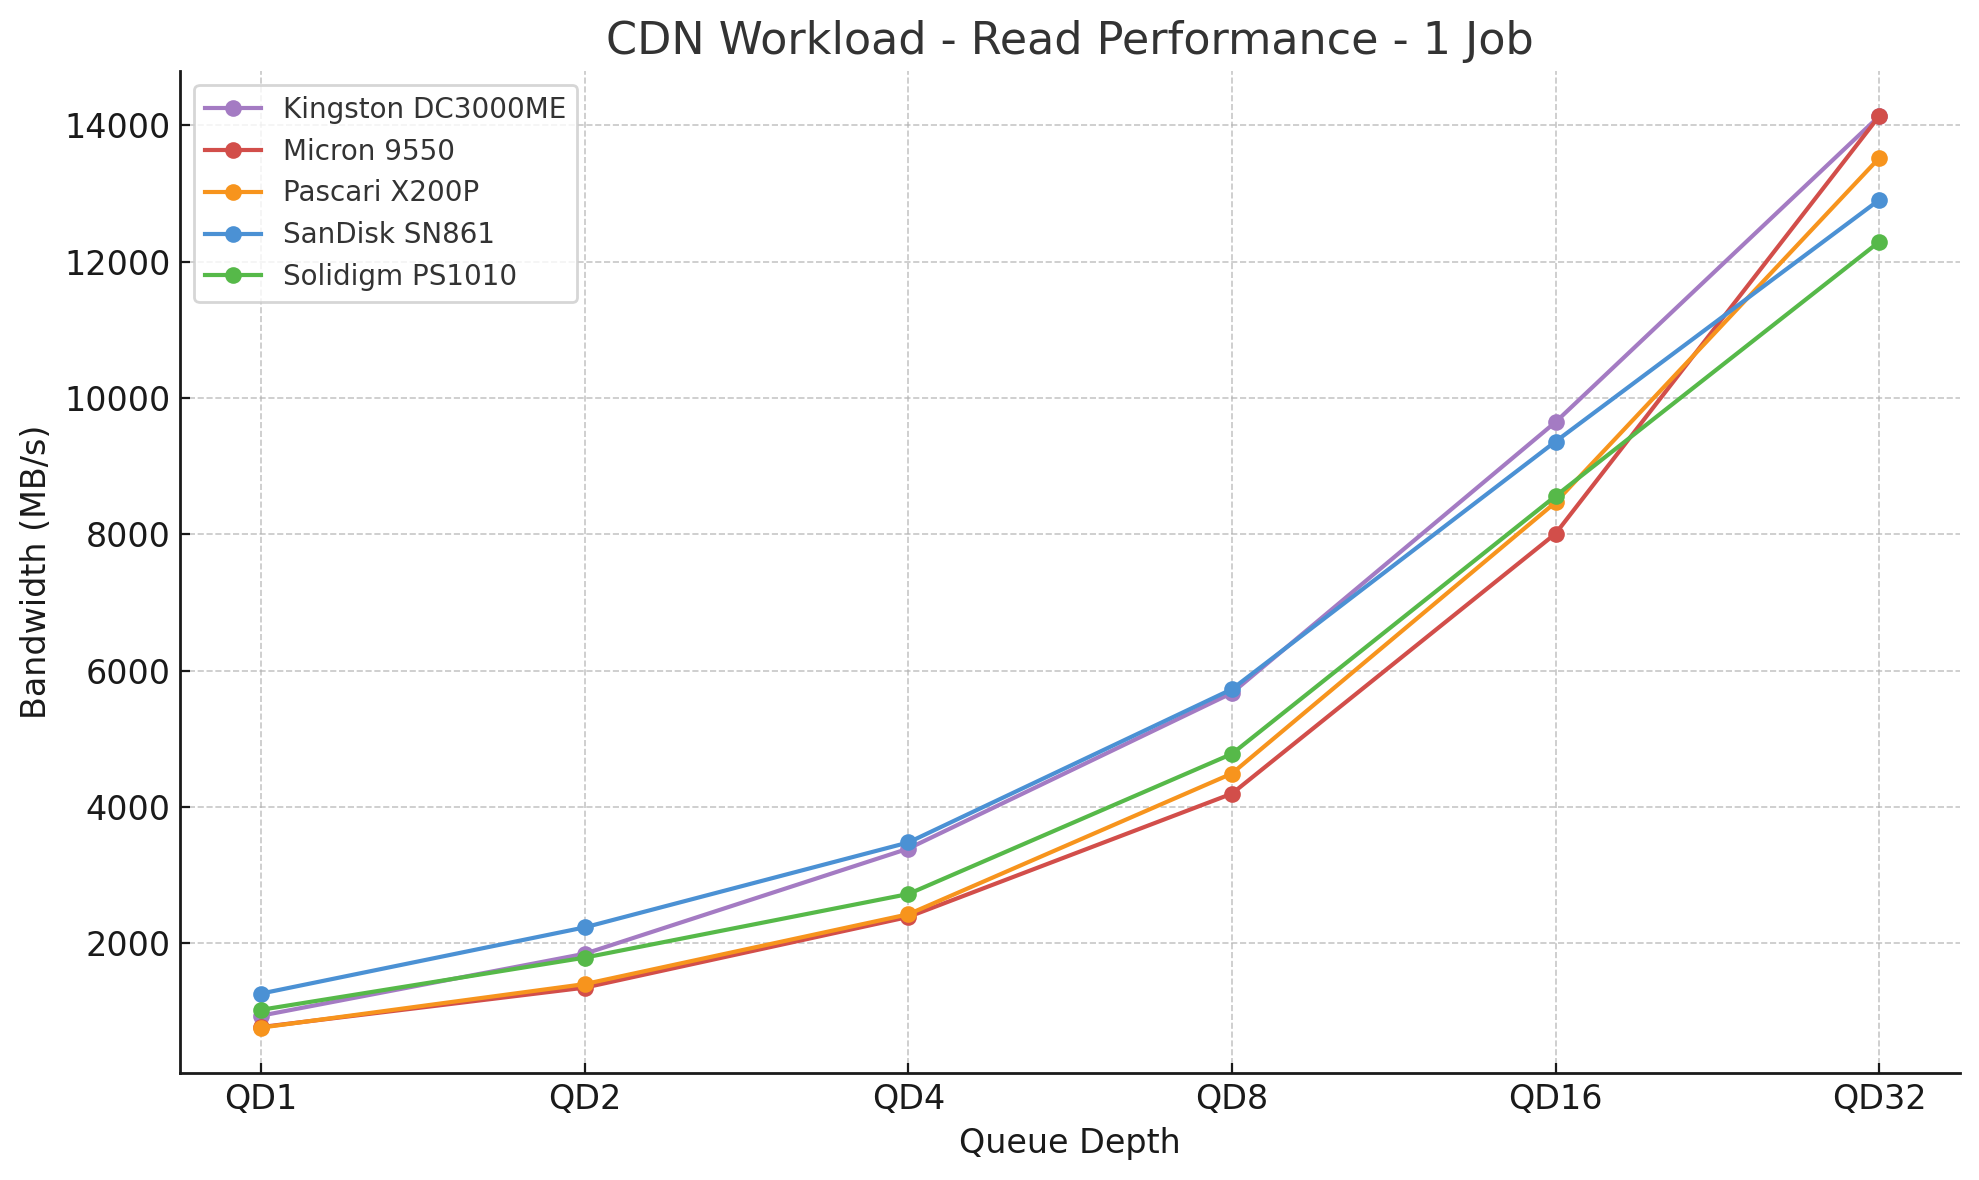
In this single-job read test simulating light content delivery traffic, the Pascari X200P starts at the back of the pack at QD1 with 765MB/s and at QD2 with 1,403MB/s. As the queue depth increases, the drive scales efficiently, moving into the middle of the field through QD8 and QD16. By QD32, the X200P reaches 13,516.8MB/s, finishing third overall behind the Kingston DC3000ME and Micron 9550, while outperforming the SanDisk SN861 and Solidigm PS1010 at the top end.
CDN Workload Read 2
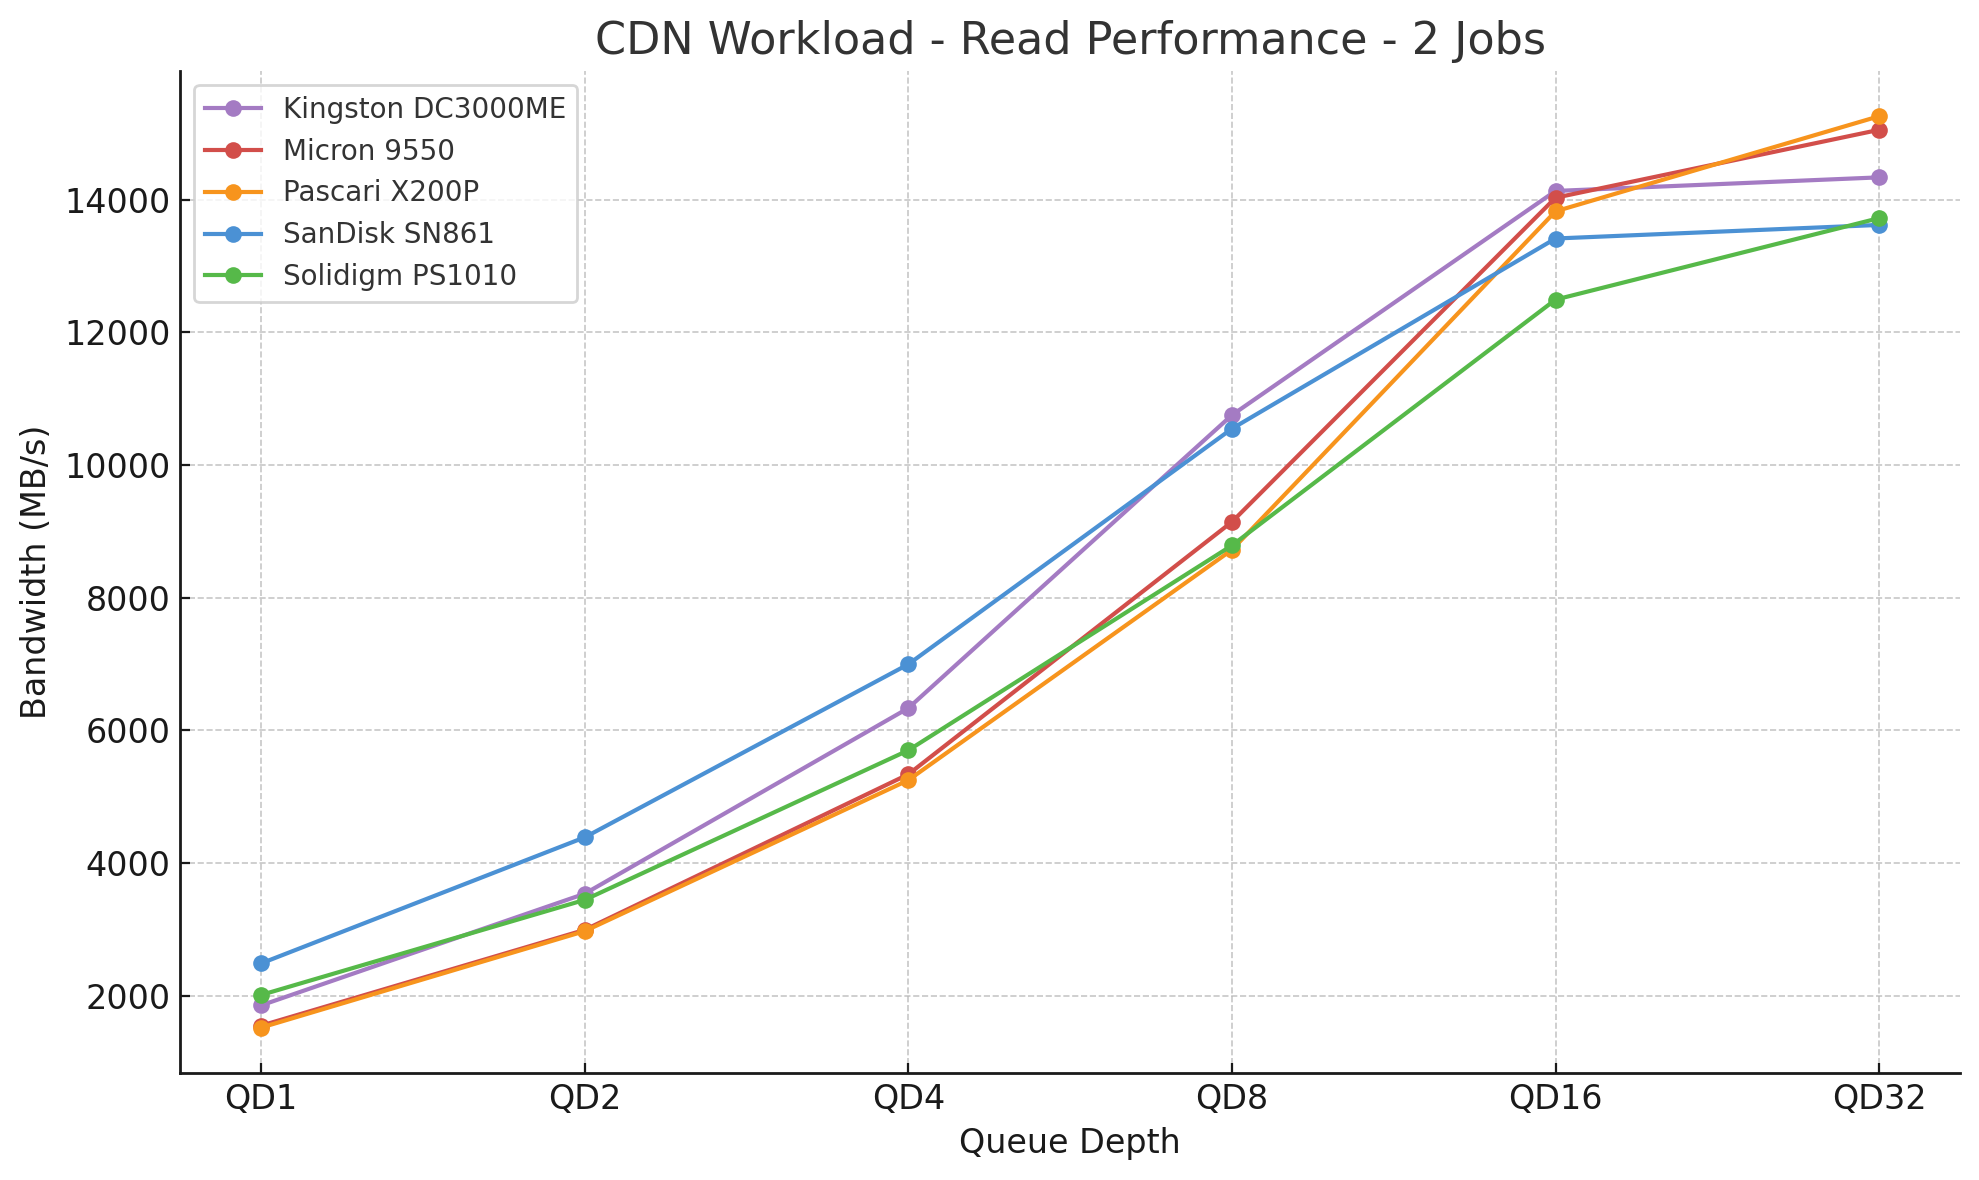
With two jobs applied, the Pascari X200P starts at the back of the field at QD1 with 1,519 MB/s, but scales consistently as the queue depth increases. The drive continues to improve through QD2 and QD4, and by QD8, it closes the gap on the leaders. At QD32, the Pascari X200P finishes first overall with 15,257.6MB/s, ahead of the Micron 9550, Kingston DC3000ME, Solidigm PS1010, and SanDisk SN861.
CDN Workload Read 4
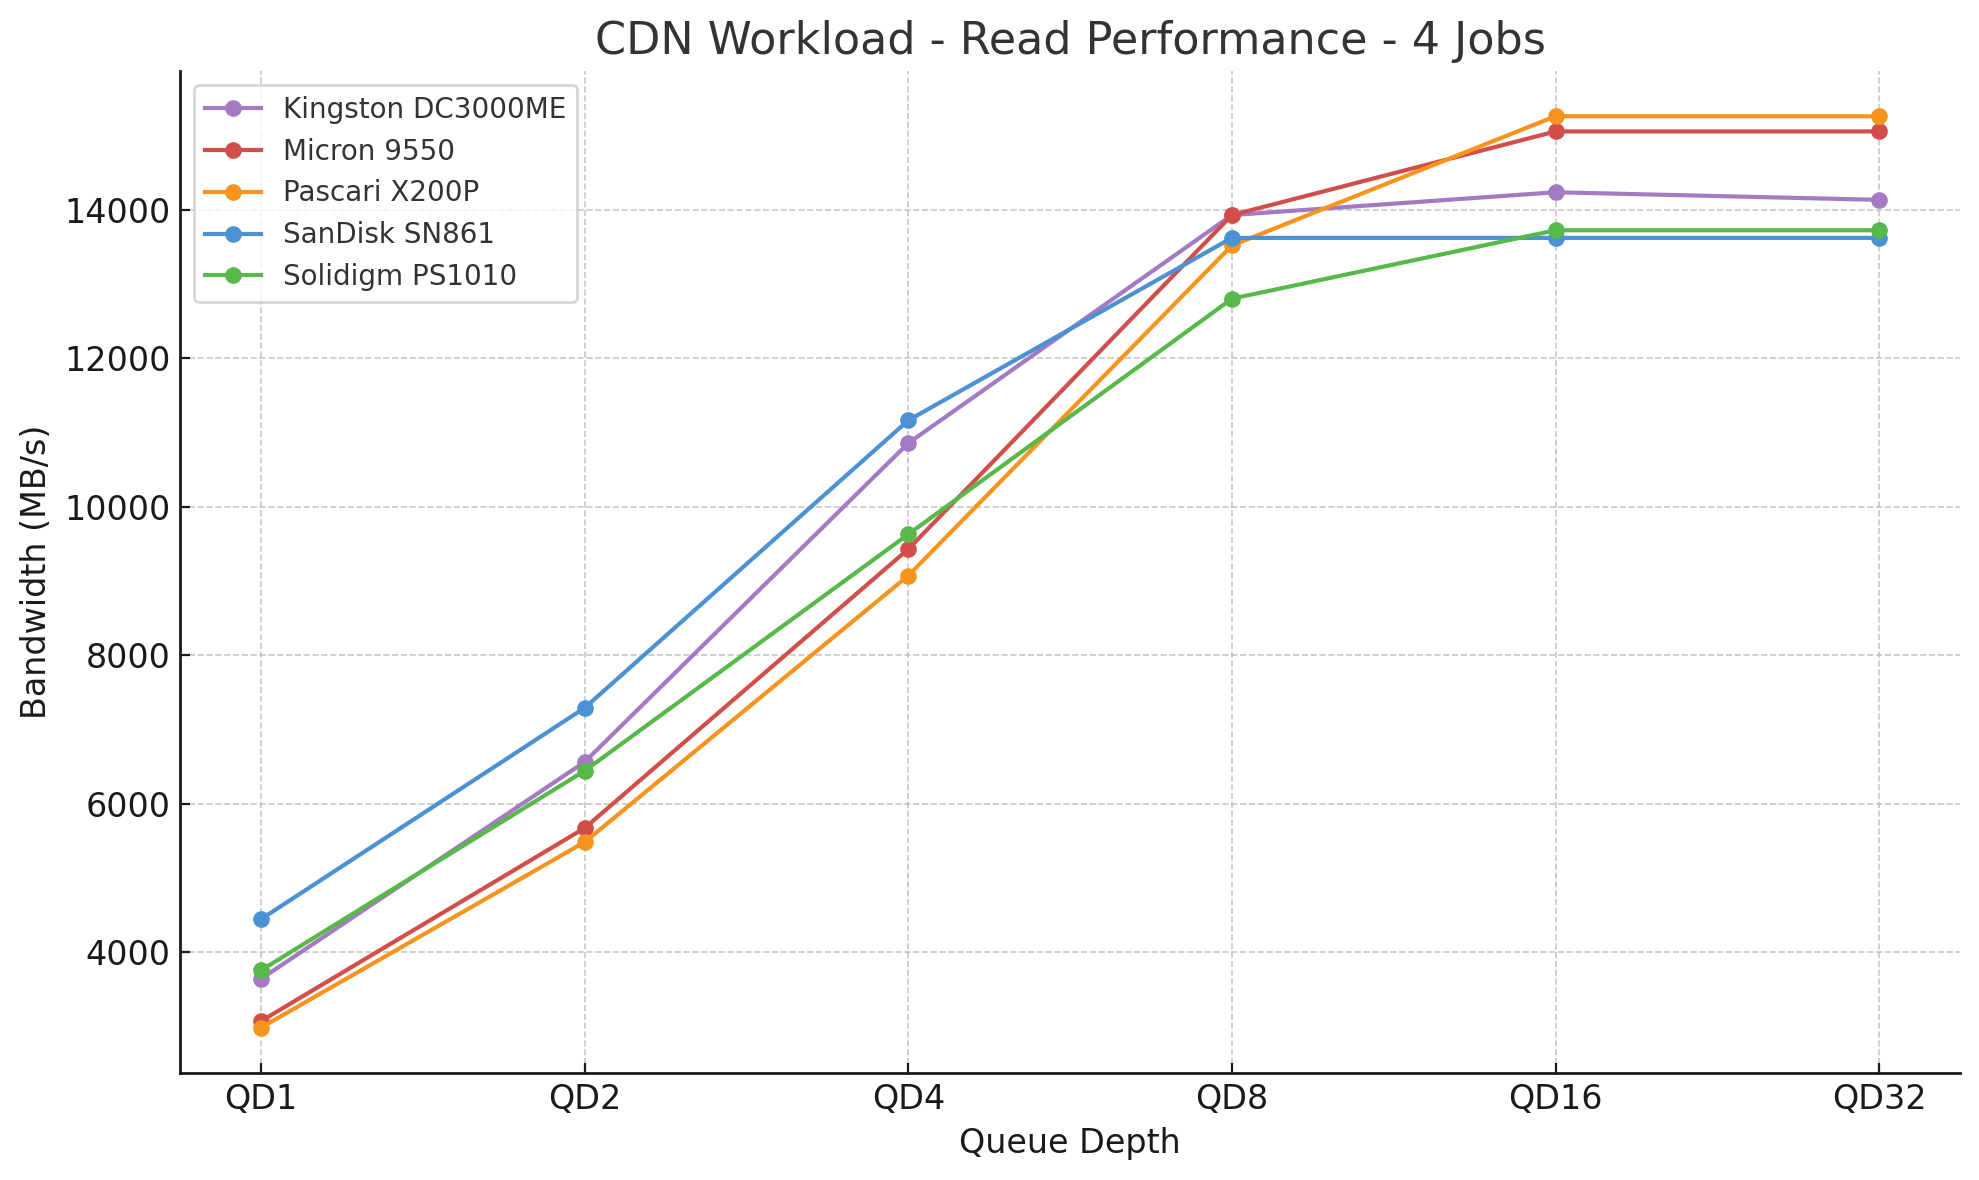
With four jobs applied, the Pascari X200P again shows strong scaling through the queue depths. The drive achieves a maximum speed of 2,982MB/s at QD1, trailing all drives tested, but steadily gains ground through QD2 and QD4. By QD8, the X200P begins to move to the front of the pack and maintains this lead through QD16 and QD32. The Pascari X200P finishes first overall at QD32 with 15,257.6MB/s, ahead of the Micron 9550 and Kingston DC3000ME.
CDN Workload Write 1
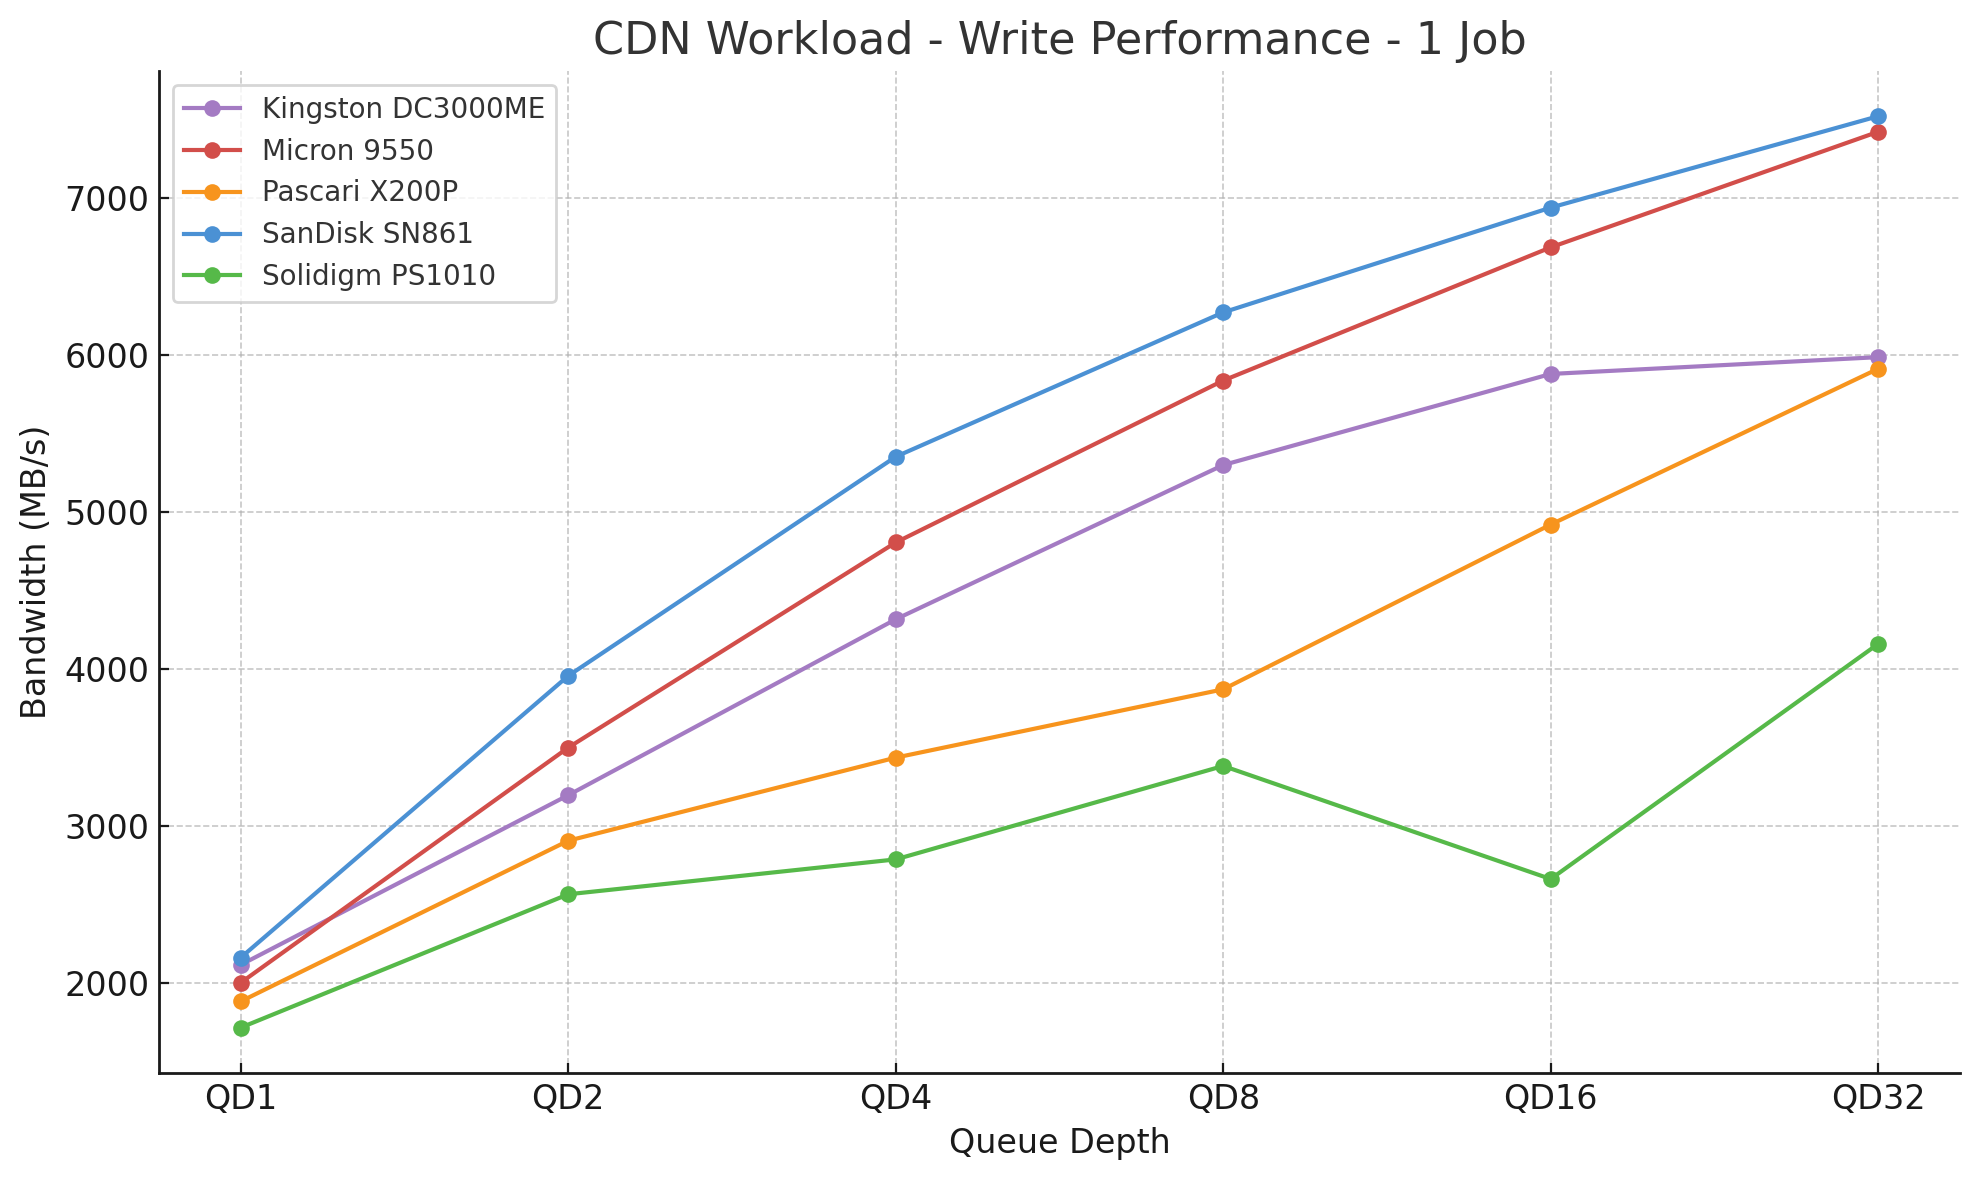
Moving into CDN write, with one job applied, the Pascari X200P trails the pack in this write test. The drive achieves a maximum speed of 1,885MB/s at QD1 and scales gradually through QD32, ultimately finishing fourth overall at 5,913MB/s. The SanDisk SN861 and Micron 9550 lead this group, followed by the Kingston DC3000ME. The Pascari X200P maintains a stable position in 4th place, with consistent scaling, but shows less aggressive write performance in this low-threaded scenario.
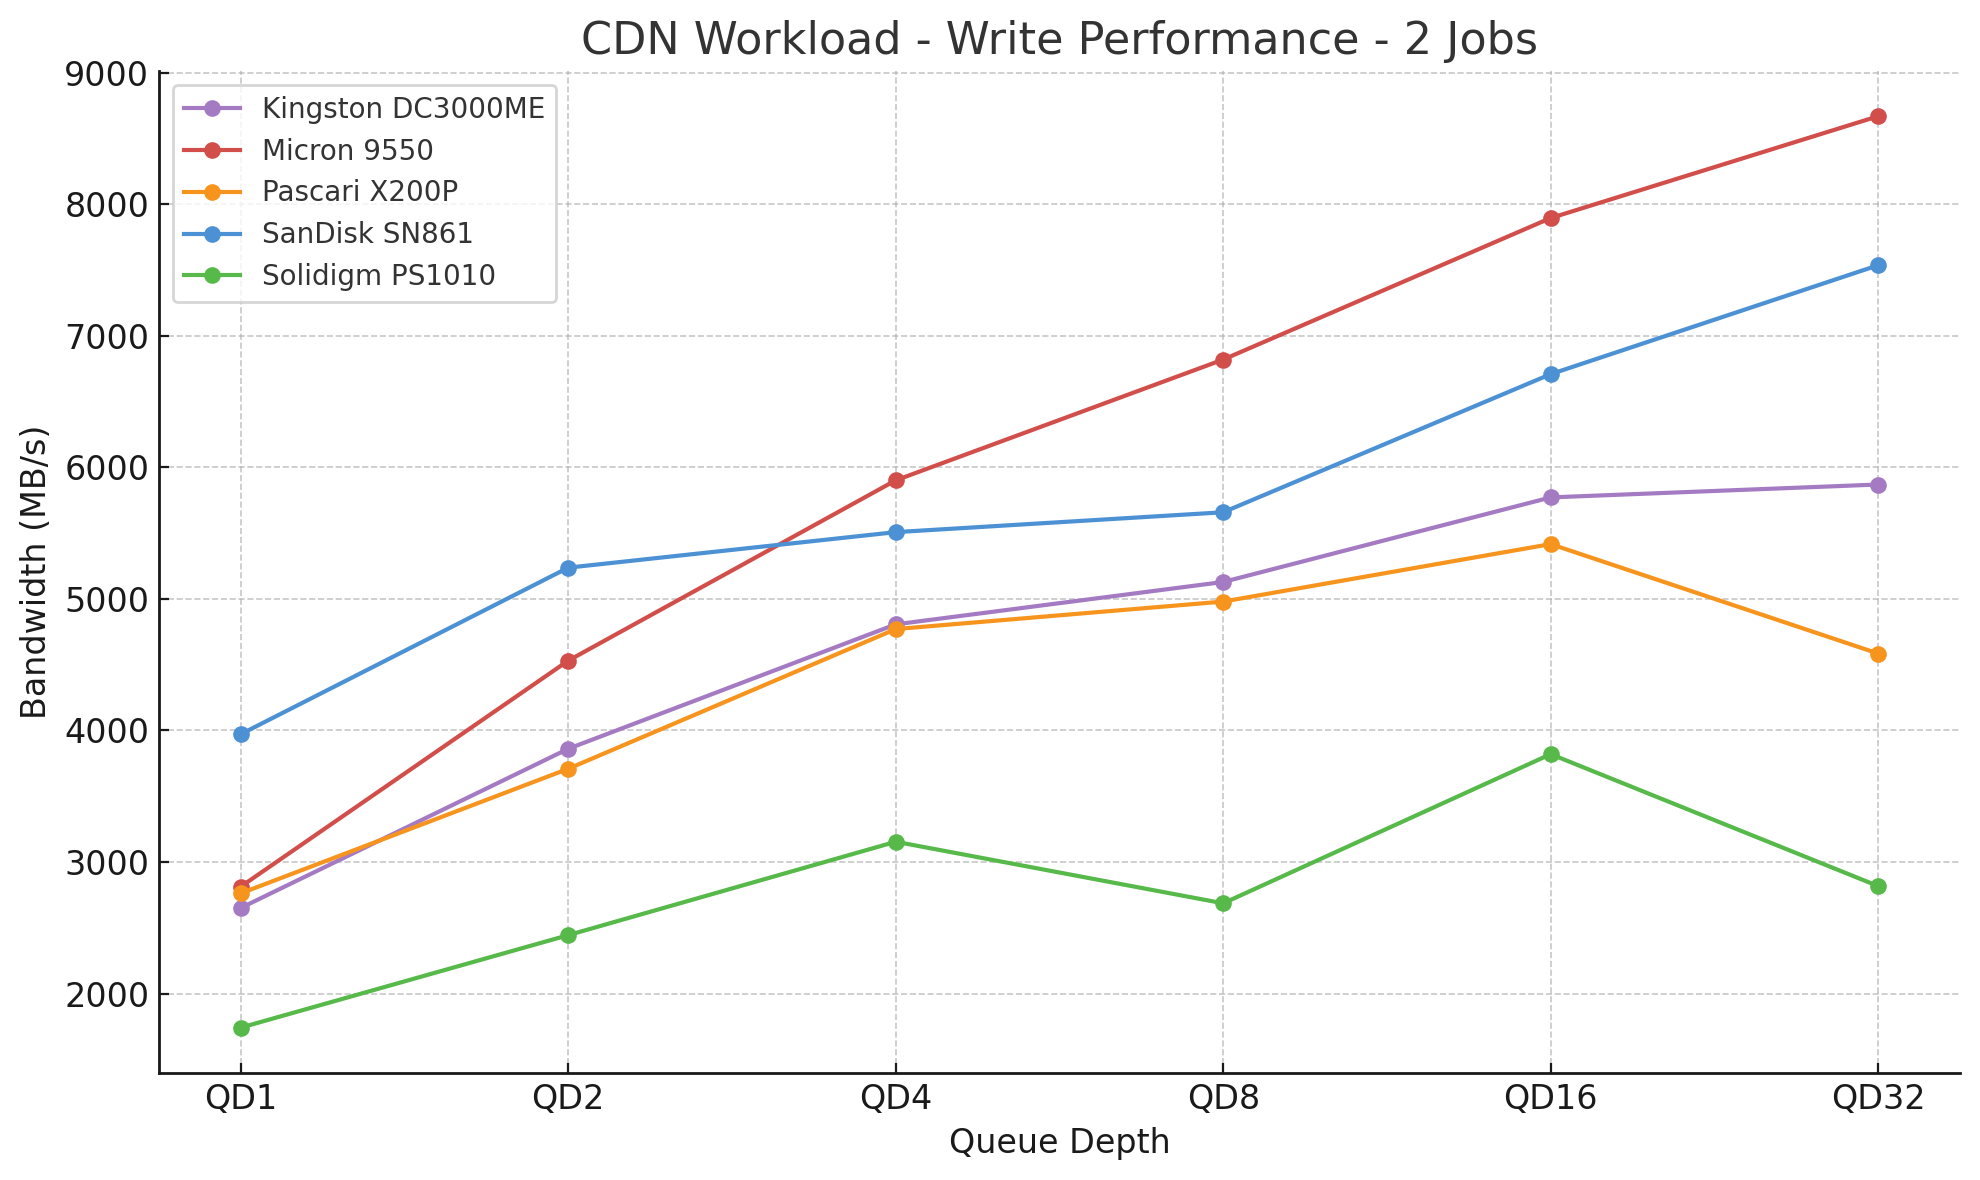
With two jobs applied, the Pascari X200P comes in fourth overall in this CDN write test. The drive achieves a maximum speed of 2,762MB/s at QD1 and scales through QD16, but exhibits some tapering by QD32, where it ultimately reaches a maximum speed of 4,585MB/s. The Micron 9550 and SanDisk SN861 lead here, followed by the Kingston DC3000ME. The X200P maintains stable performance through mid-queue depths but trails the leaders in this two-threaded write workload.
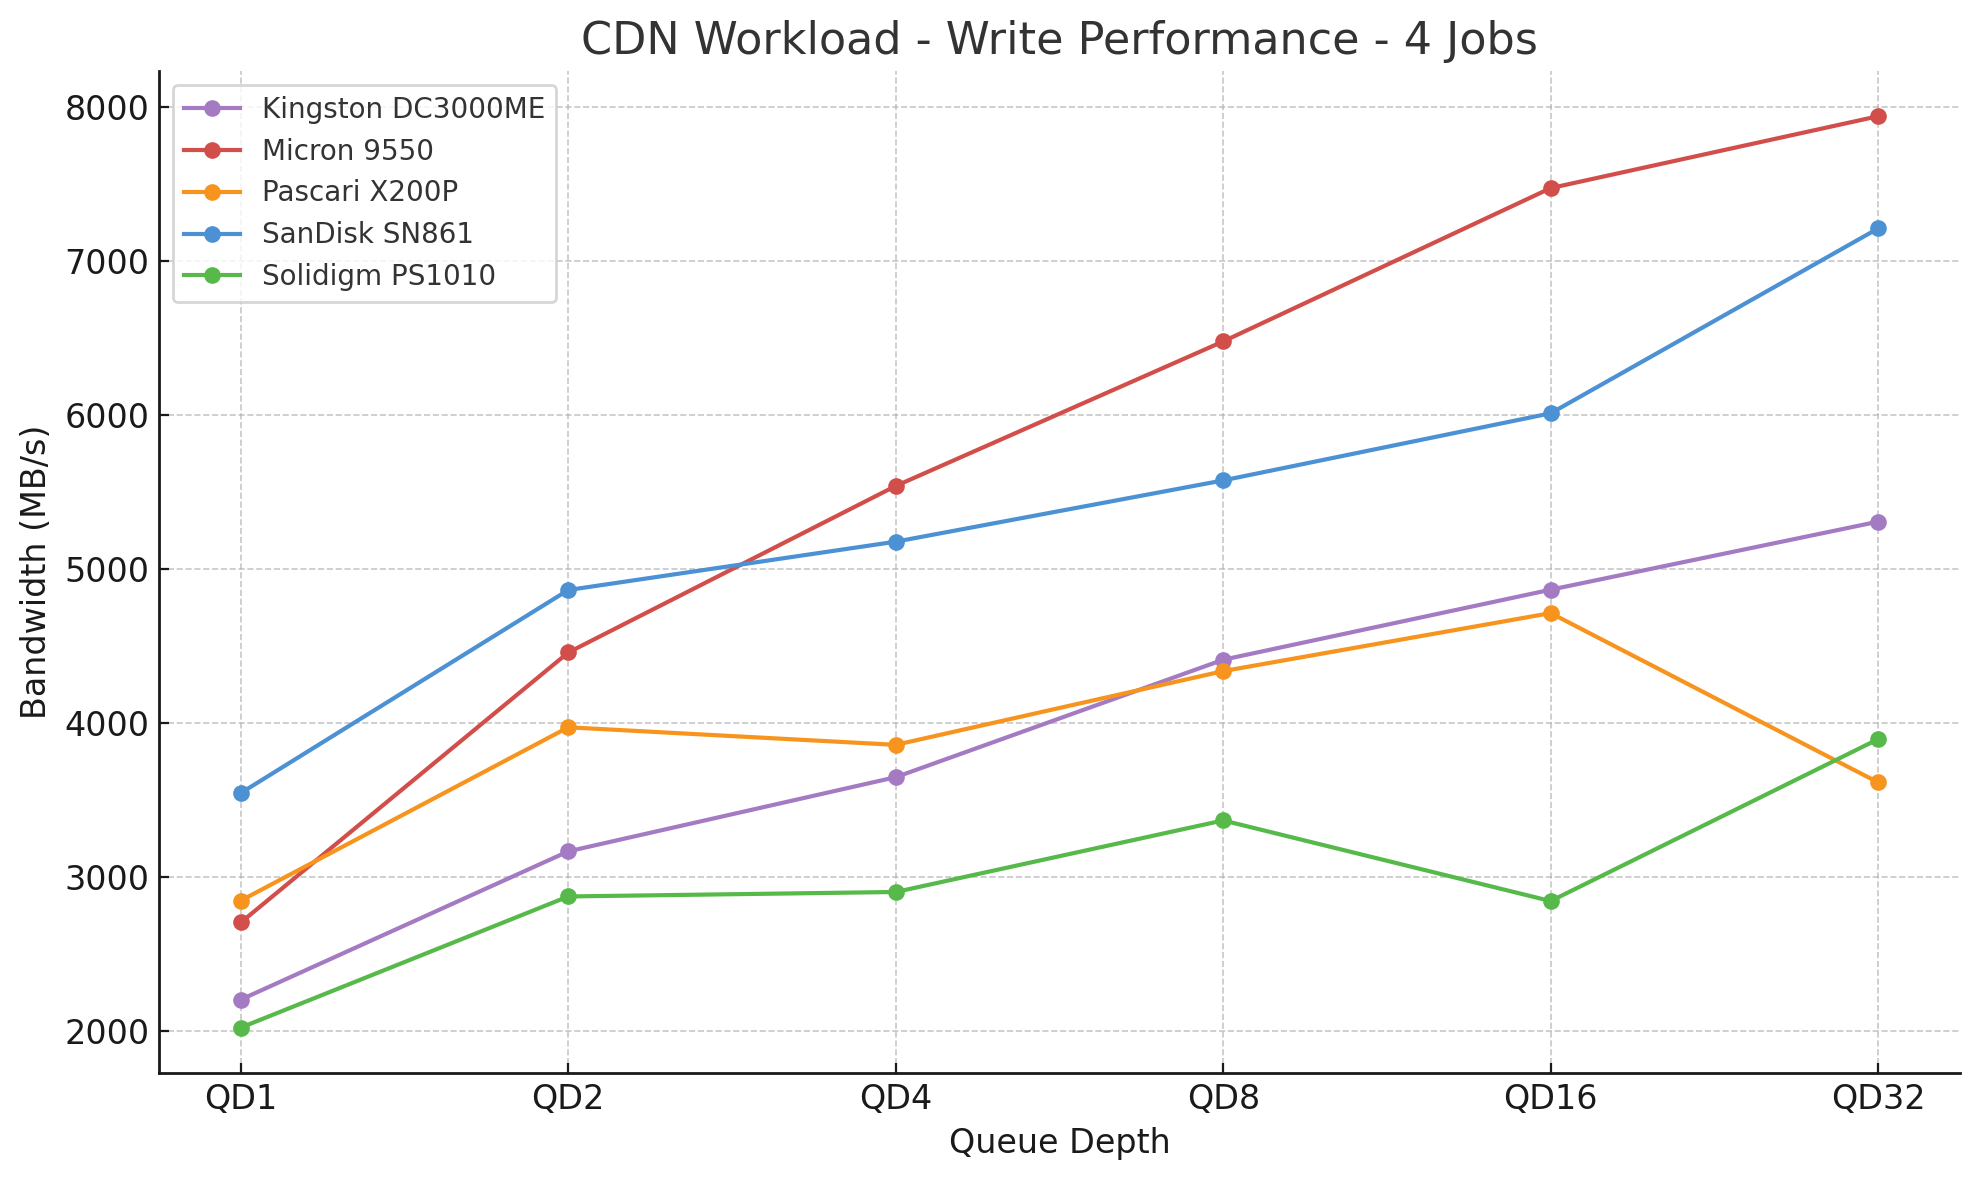
With four jobs applied, the Pascari X200P holds mid-pack performance through most of this CDN write test. The drive achieves a maximum throughput of 2,845MB/s at QD1 and remains competitive with the Kingston DC3000ME and Solidigm PS1010 through mid-queue depths. At QD32, the X200P tails off slightly, finishing fifth overall at 3,613MB/s. The Micron 9550 and SanDisk SN861 lead the field, while the Kingston DC3000ME maintains third. Across the range, the X200P delivers consistent write scaling under moderate loads but shows some limits at deeper queue depths in this four-threaded workload.
DLIO Checkpointing Benchmark
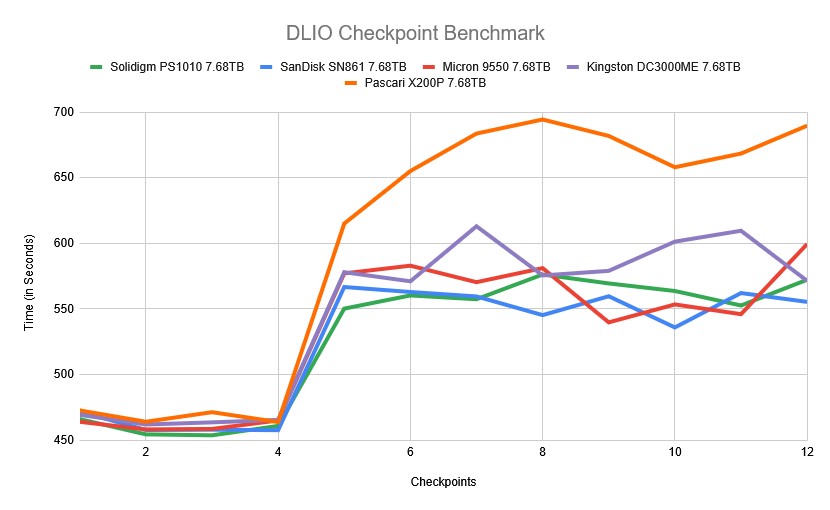
To evaluate SSD real-world performance in AI training environments, we utilized the Data and Learning Input/Output (DLIO) benchmark tool. Developed by Argonne National Laboratory, DLIO is specifically designed to test I/O patterns in deep learning workloads. It provides insights into how storage systems handle challenges such as checkpointing, data ingestion, and model training. The chart below illustrates how both drives handle the process across 36 checkpoints. When training machine learning models, checkpoints are essential for saving the model’s state periodically, preventing loss of progress during interruptions or power failures. This storage demand requires robust performance, especially under sustained or intensive workloads. We used DLIO benchmark version 2.0 from the August 13, 2024, release.
To ensure our benchmarking reflected real-world scenarios, we based our testing on the LLAMA 3.1 405B model architecture. We implemented checkpointing using torch.save() to capture model parameters, optimizer states, and layer states. Our setup simulated an eight-GPU system, implementing a hybrid parallelism strategy with 4-way tensor parallelism and 2-way pipeline parallel processing distributed across the eight GPUs. This configuration resulted in checkpoint sizes of 1,636GB, representative of modern, large language model training requirements.
In the DLIO Checkpoint Benchmark, the Pascari X200P SSD demonstrates strong initial responsiveness but exhibits increased checkpoint times as the workload intensifies. In the early passes (Checkpoints 1–4), the X200P stays close to the rest of the pack, with an average of 467 seconds, keeping pace with drives like the Solidigm PS1010 and Micron 9550.
However, by the midpoint of the benchmark (Checkpoints 5–9), the X200P’s performance begins to diverge. The drive’s checkpoint times rise sharply, peaking at 689.68 seconds by Checkpoint 12, the highest in the group. Across the final three checkpoints, the X200P averages 672 seconds, roughly 19.3% slower than the next-slowest drive (Kingston DC3000ME) and 23% slower than the group average.
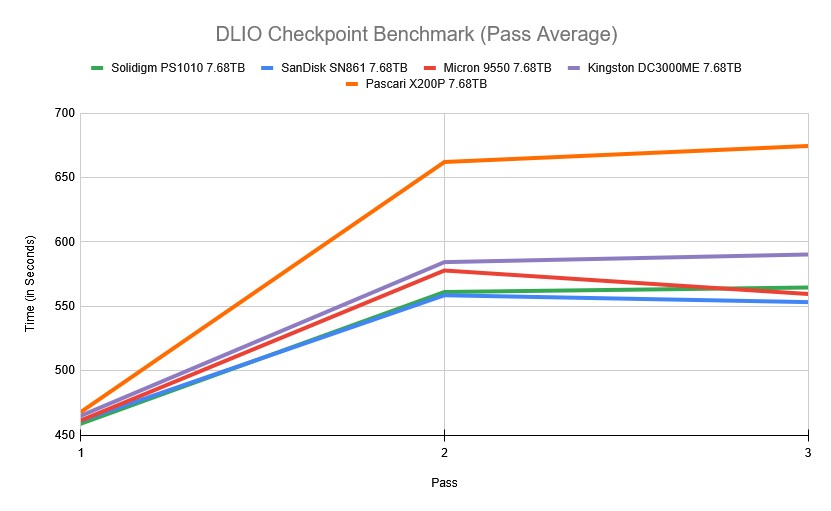
When viewed through the lens of pass averages, the X200P illustrates a clear trajectory of performance degradation over time. In Pass 1, the drive averaged 467.93 seconds, placing it slightly behind the rest of the field but still within a competitive margin.
By Pass 2, the X200P sharply diverged from the group, posting 662.04 seconds, which is 14.5% slower than the next-slowest drive (Kingston DC3000ME) and 17.4% slower than the group average for that pass. This trend continued into Pass 3, where it recorded 674.48 seconds, maintaining its position as the slowest drive. Compared to the average of the other four drives (approx. 567 seconds), the X200P was 18.9% slower to complete.
FIO Performance Benchmark
To measure the storage performance of each SSD across common industry metrics, we leverage FIO. Each drive is run through the same testing process, which includes a preconditioning step of two full drive fills with a sequential write workload, followed by measurement of steady-state performance. As each workload type being measured changes, we run another preconditioning fill of that new transfer size.
In this section, we focus on the following FIO benchmarks:
- 128K Sequential
- 64K Random
- 16K Random
- 4K Random
128K Sequential Precondition (IODepth 256 / NumJobs 1)
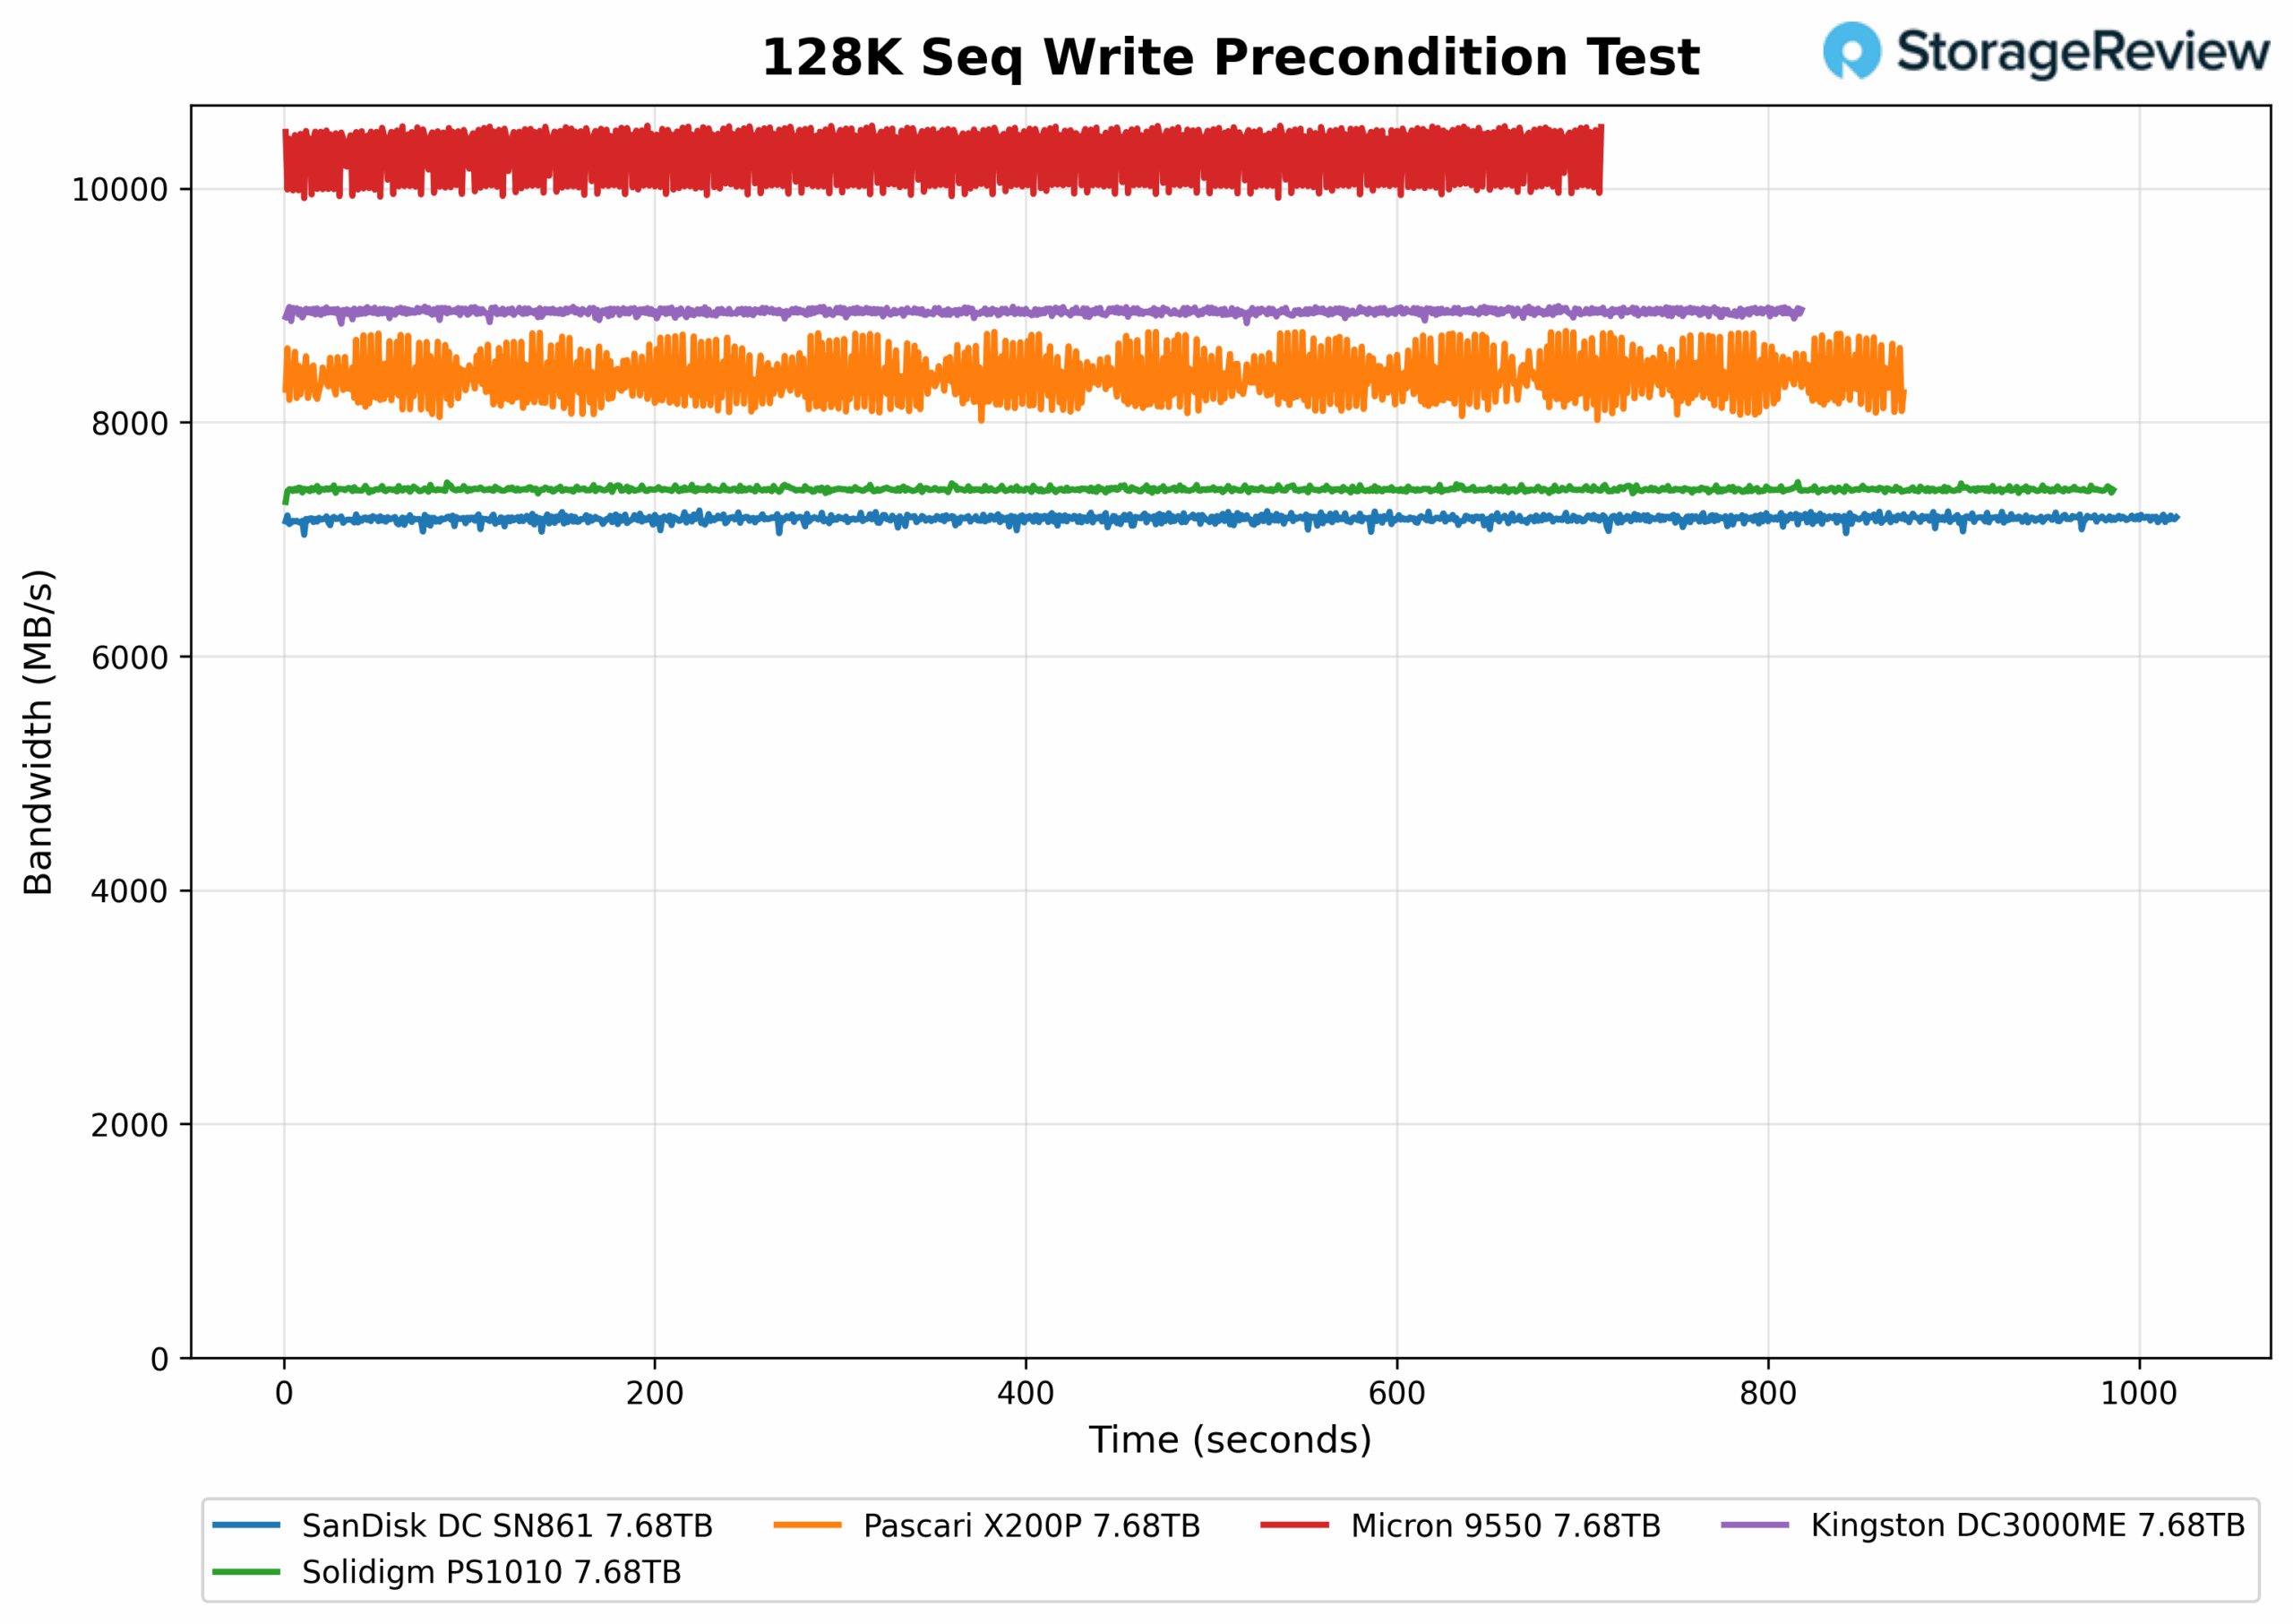
In the 128K Sequential Write Precondition Test, the X200P places third overall, with an average bandwidth of 8,371MB/s. While it maintains strong performance, the drive shows a slight, recurring fluctuation in bandwidth, indicating less consistency compared to the flatter, steadier lines of the Micron 9550 and Kingston DC3000ME above it.
128K Sequential Precondition Latency (IODepth 256 / NumJobs 1)
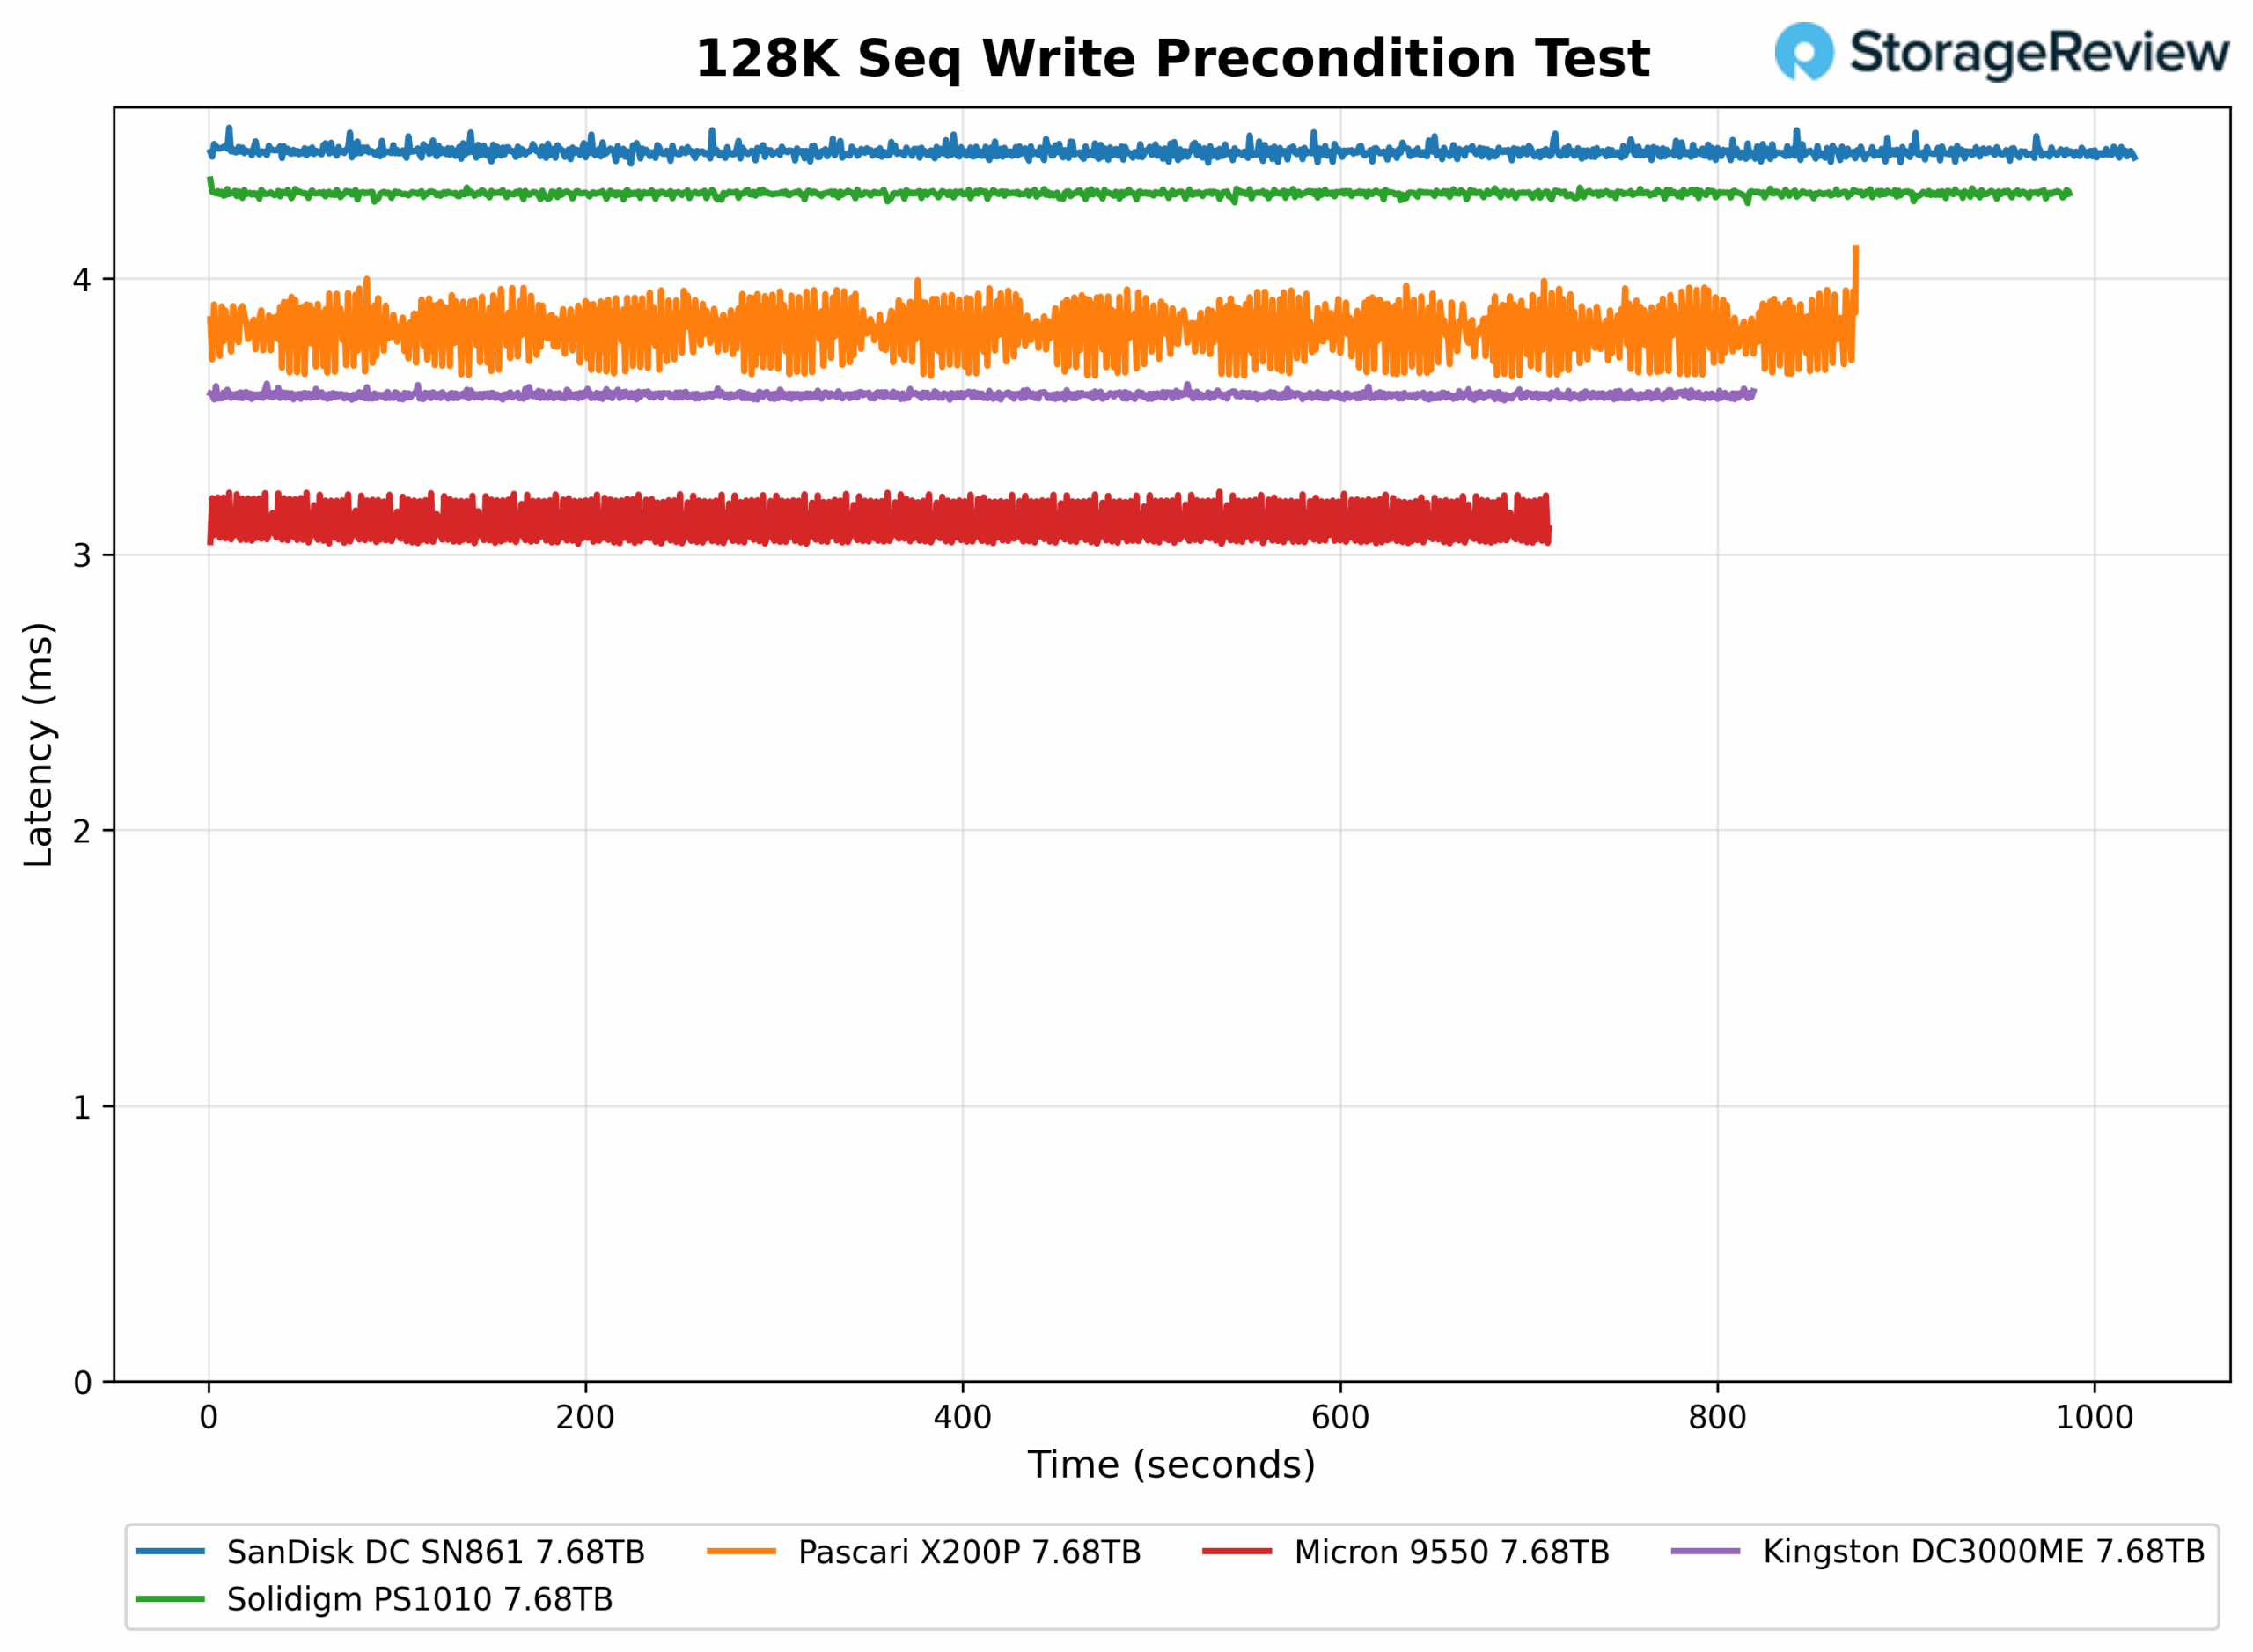
In the 128K Sequential Write Precondition Latency Test, the X200P had a mean latency of 3.822ms, placing it third overall. It sits behind the Micron 9550 and Kingston DC3000ME. Similar to its bandwidth pattern, the Pascari exhibits mild latency fluctuations, indicating some variability during sustained writes while maintaining a strong upper-tier position.
128K Sequential Write (IODepth 16 / NumJobs 1)
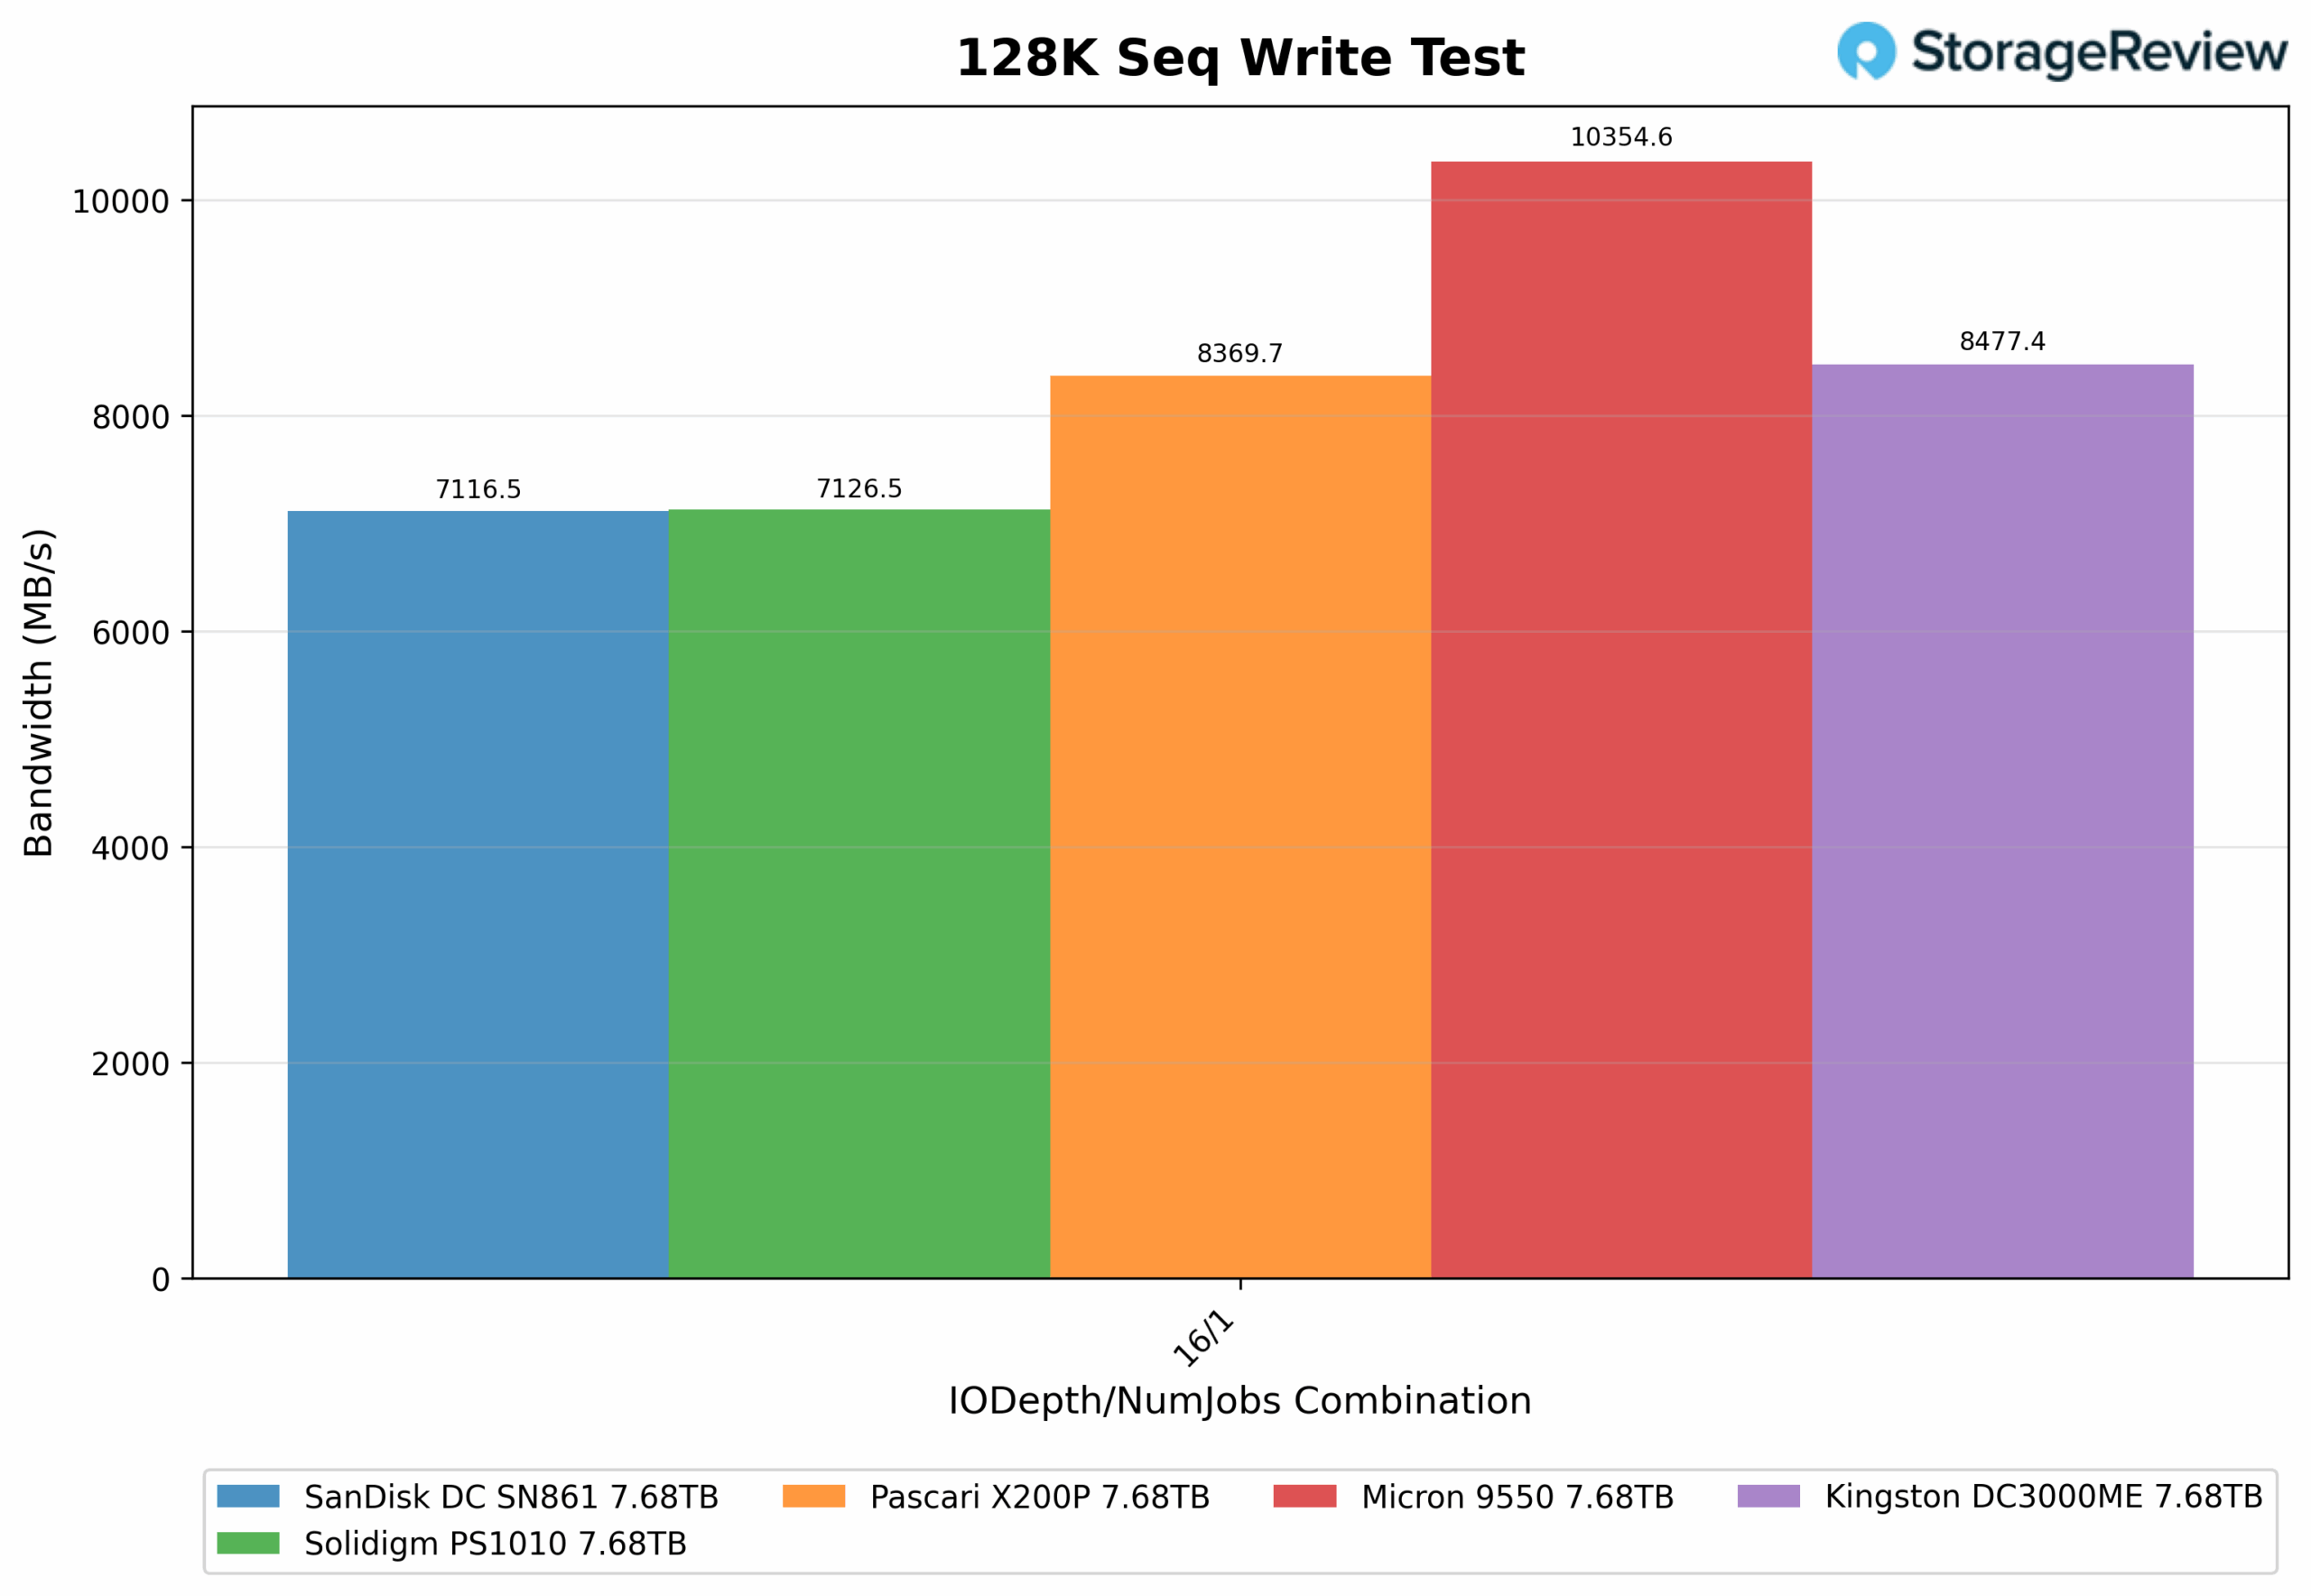
In the 128K Sequential Write Test, the X200P achieved an average bandwidth of 8369.7MB/s, placing it third overall. It lands behind the Micron 9550 and Kingston DC3000ME, but ahead of the Solidigm PS1010 and SanDisk SN861.
128K Sequential Write Latency (IODepth 16 / NumJobs 1)
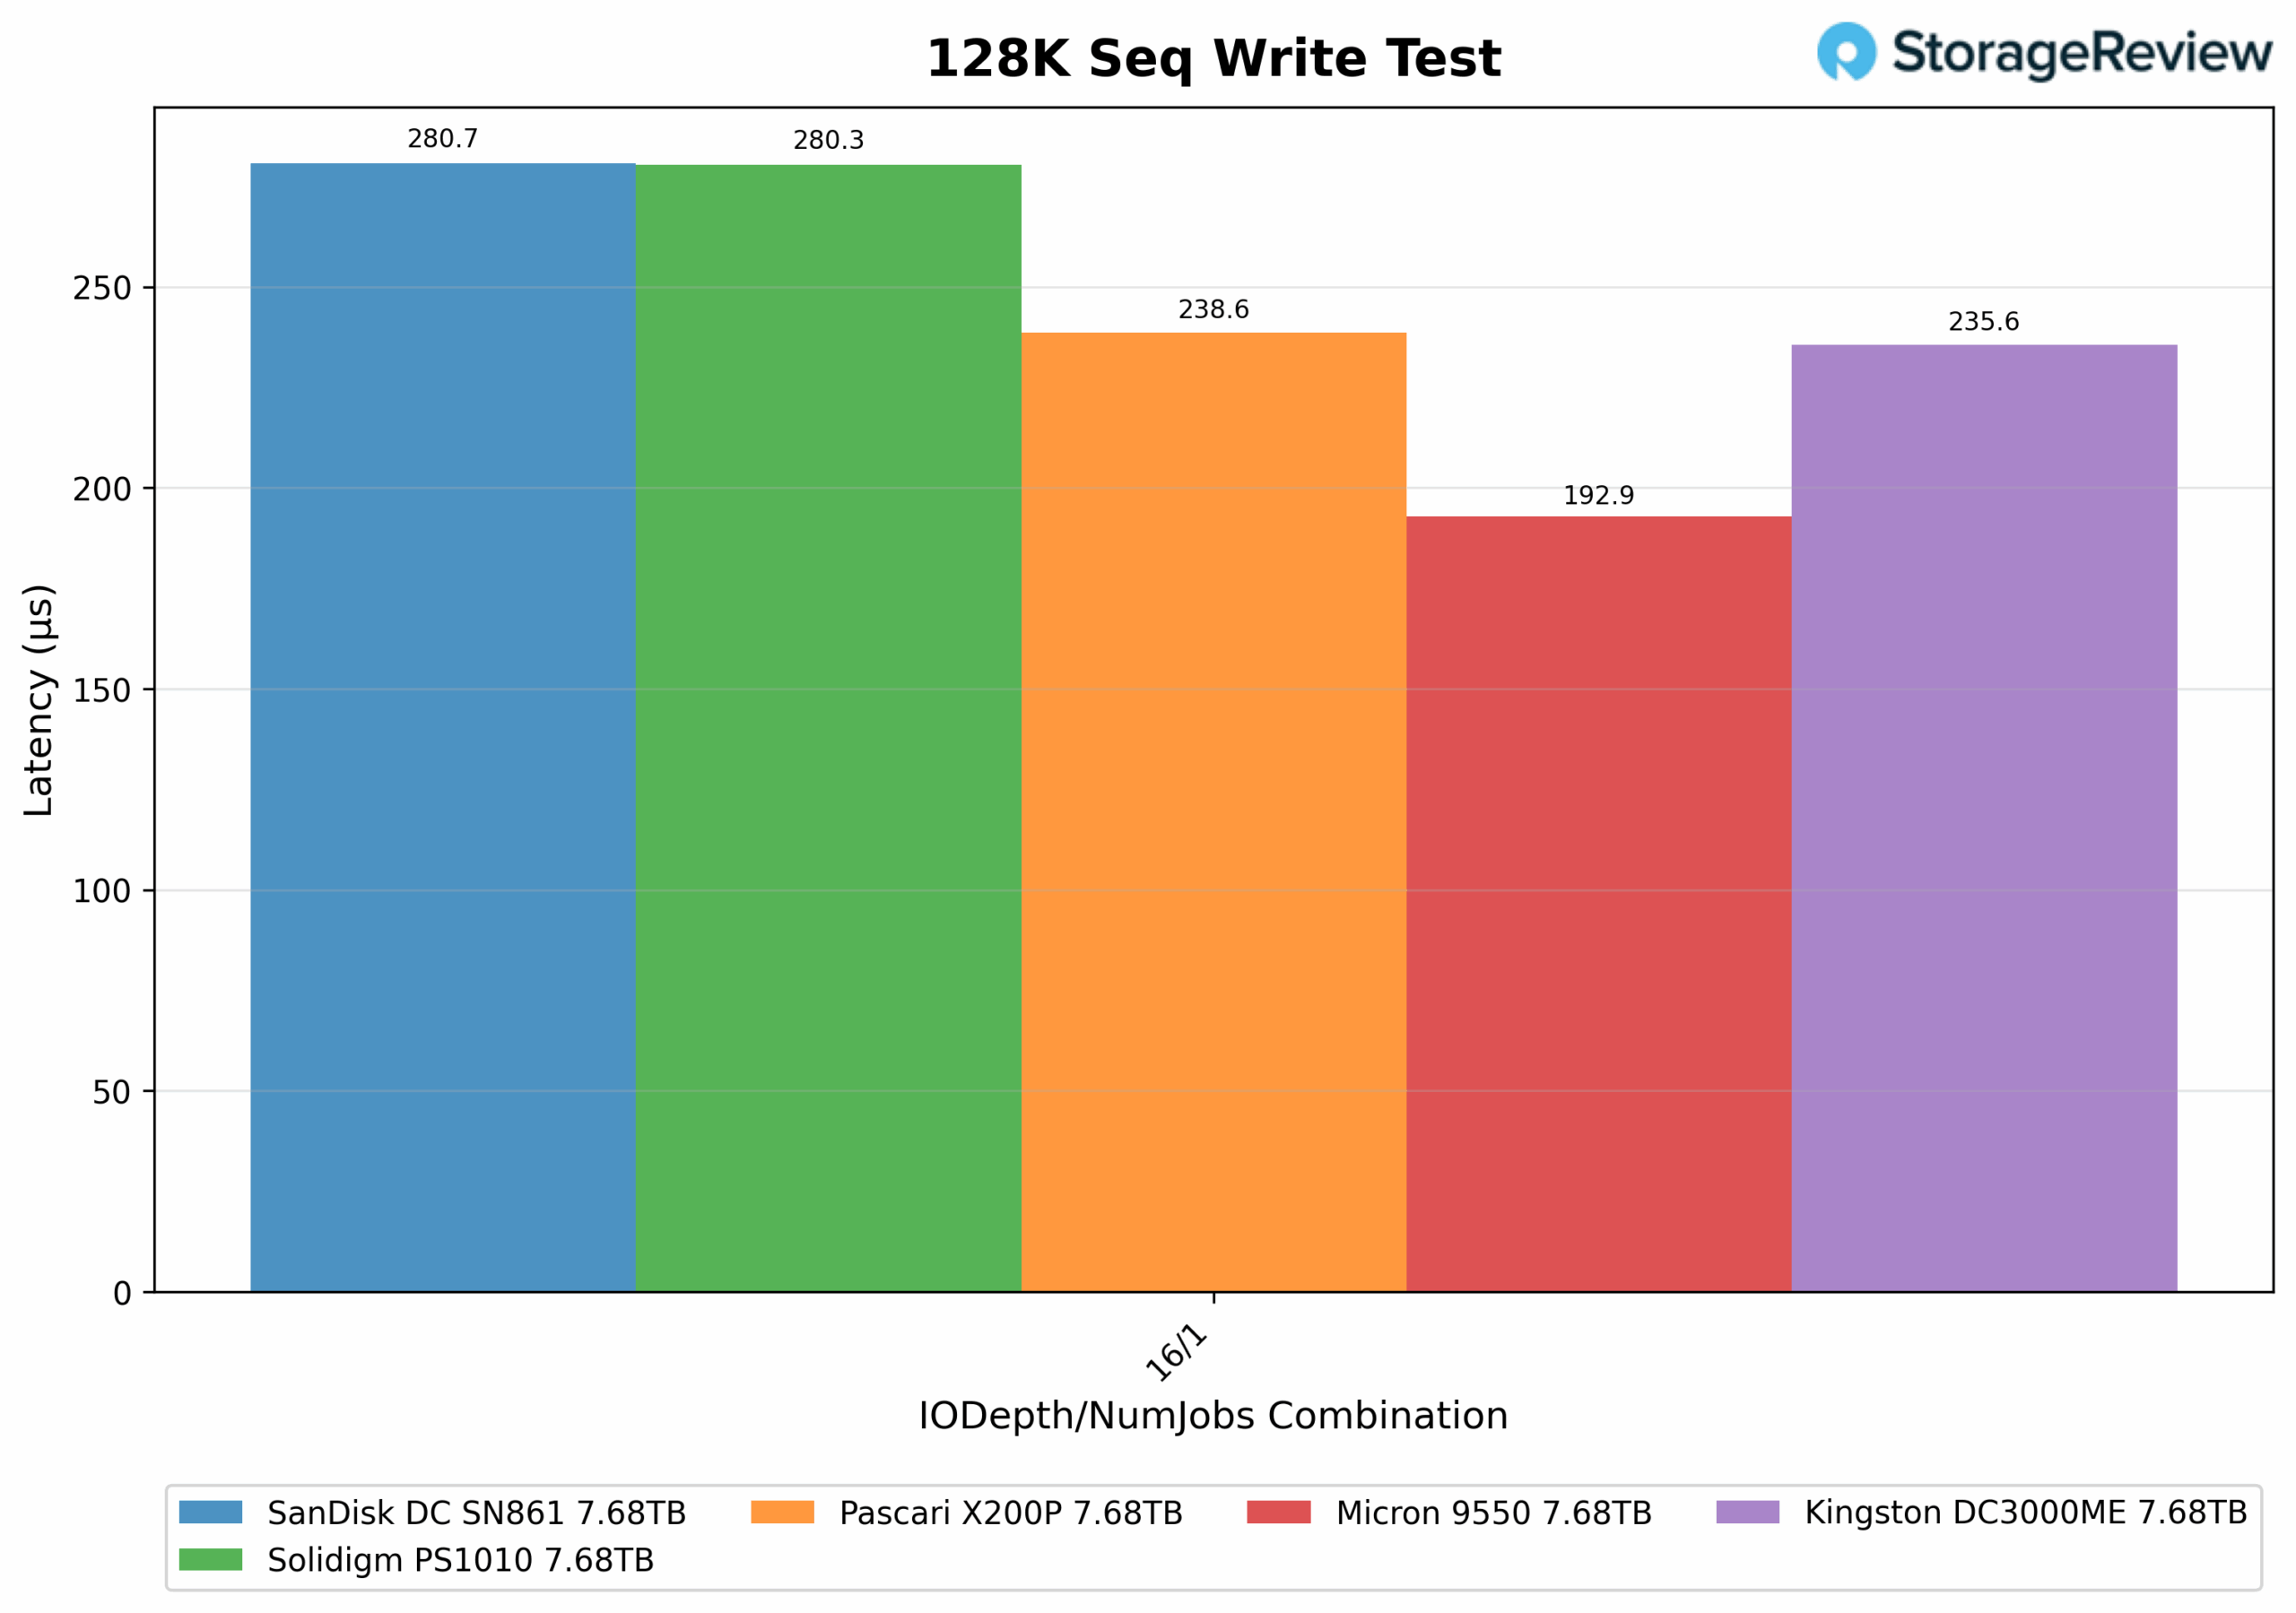
In the 128K Sequential Write Test latency chart, the X200P recorded an average latency of 0.238ms. This places it fourth overall, just behind the Kingston DC3000ME (0.235ms) and ahead of the Solidigm PS1010 and SanDisk SN861. While its latency is lower than most, it still trails the top performer, the Micron 9550.
128K Sequential Read (IODepth 64 / NumJobs 1)
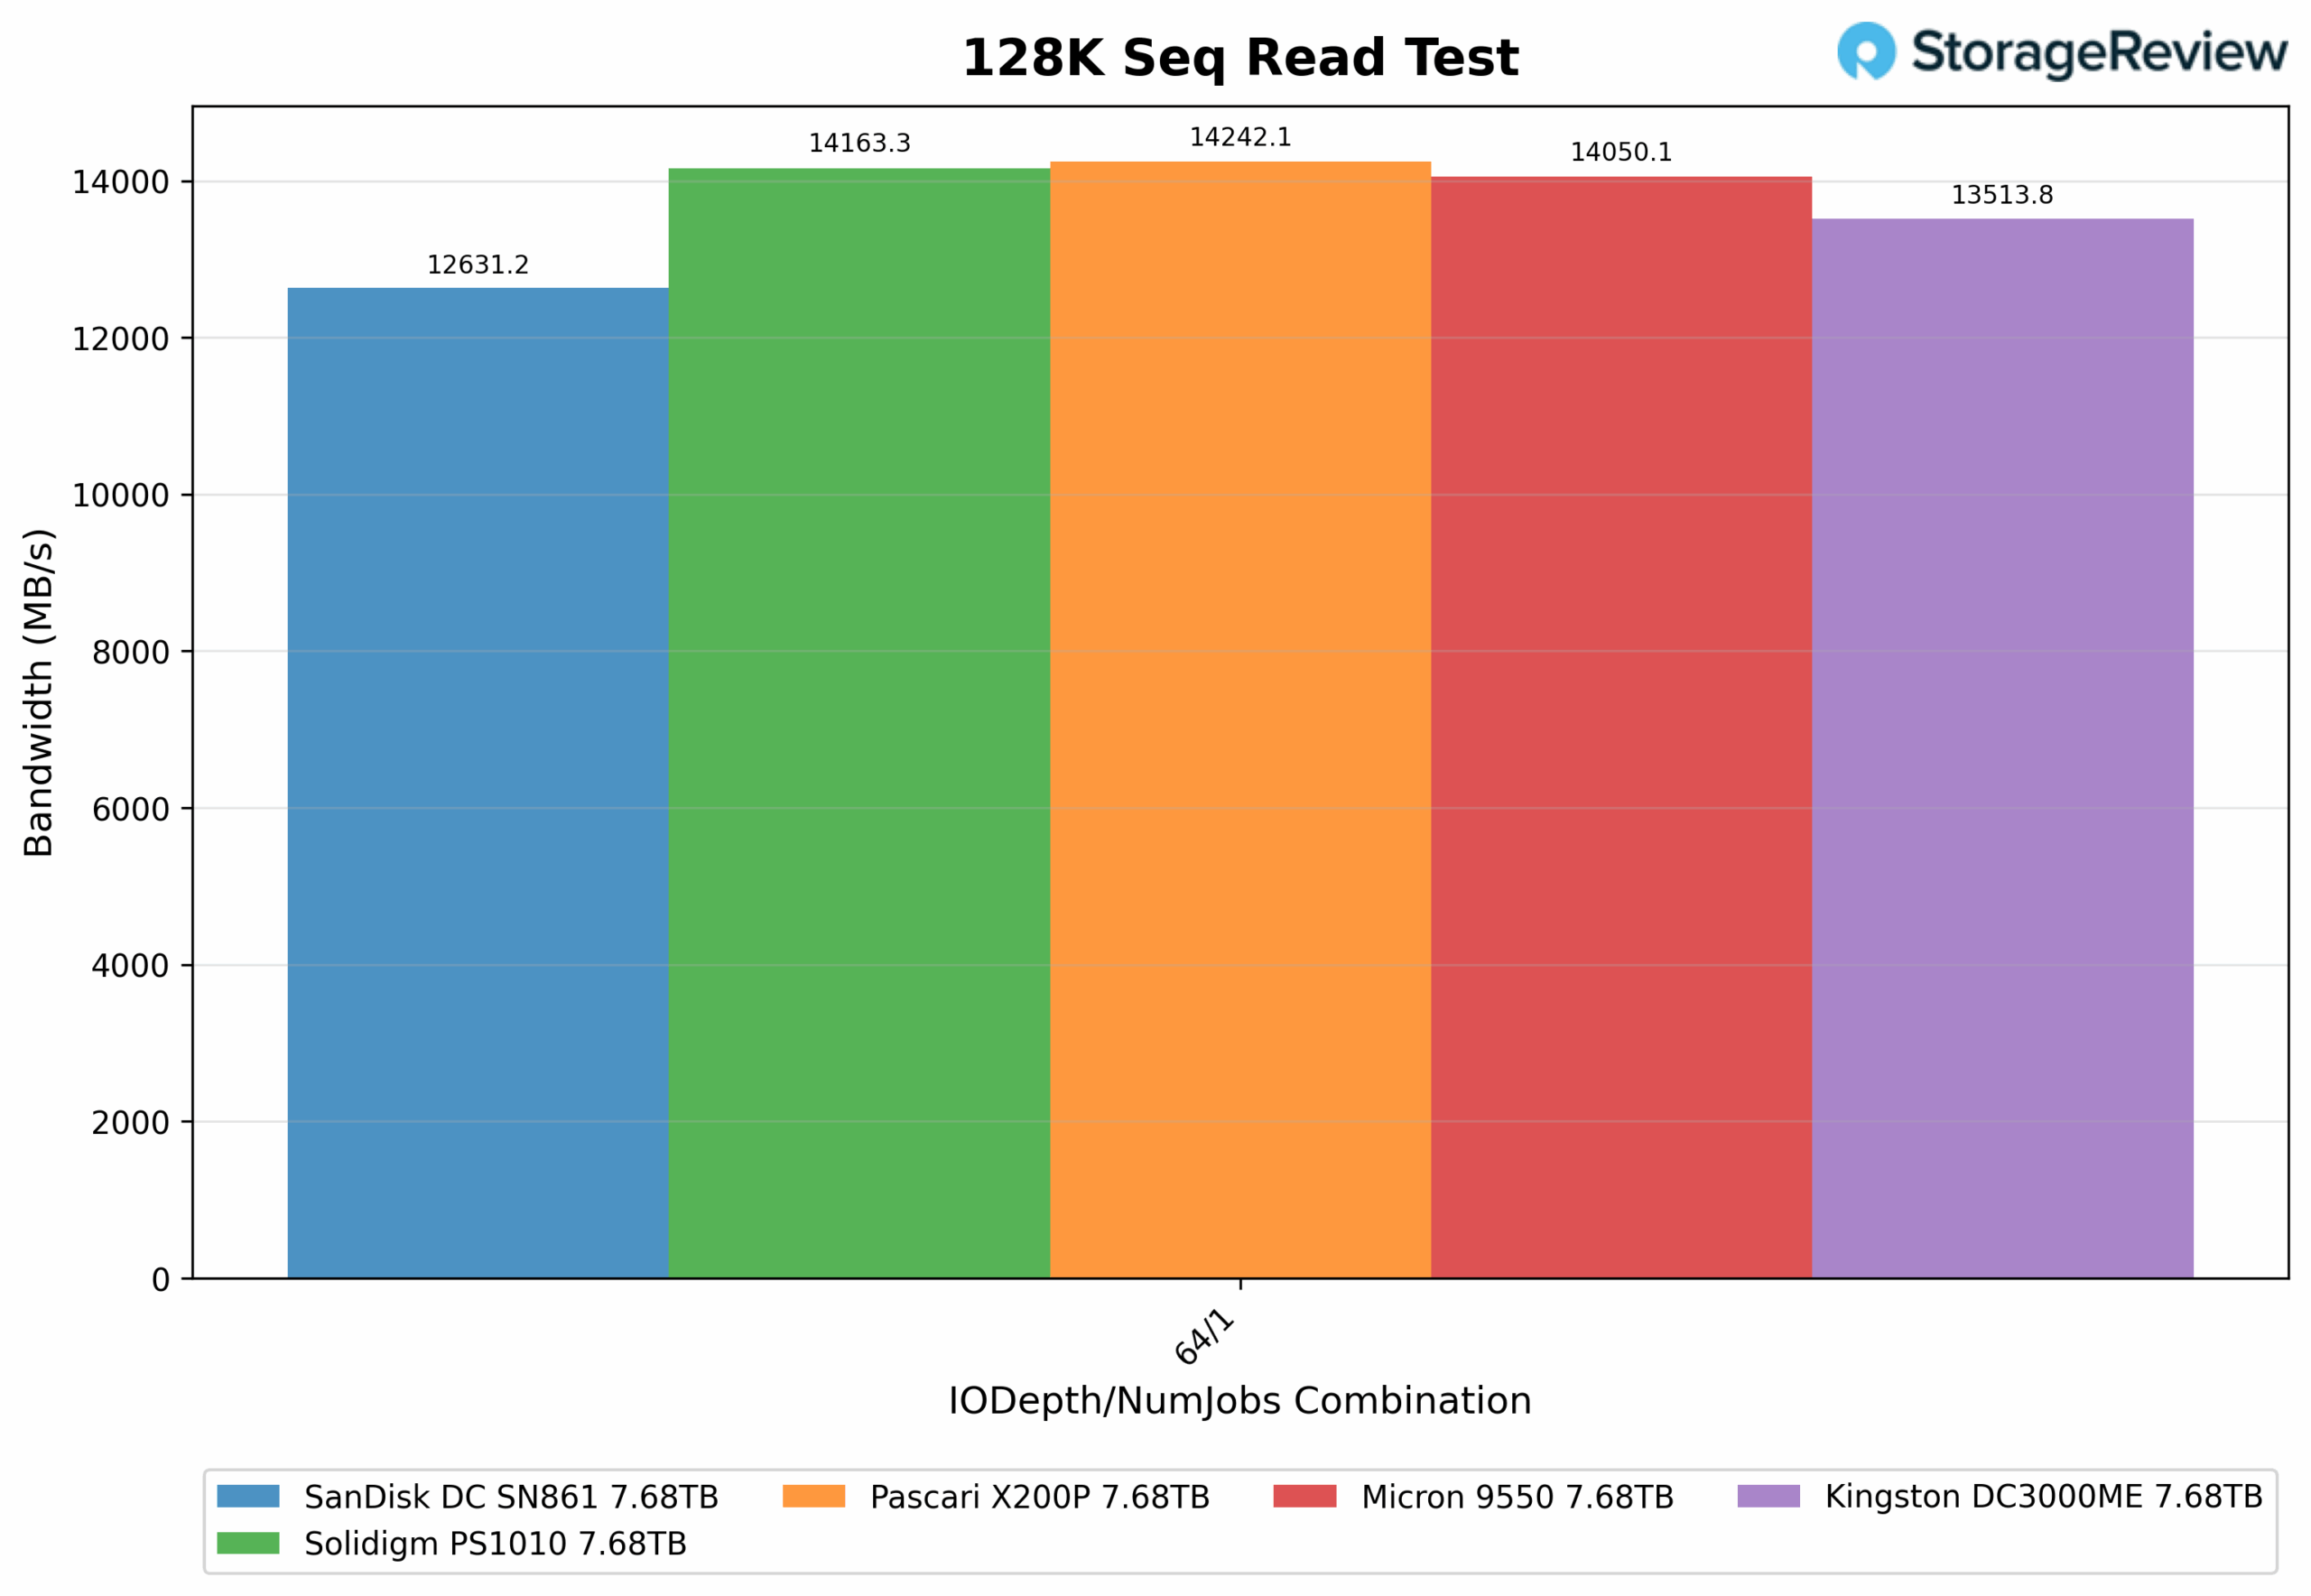
In the 128K Sequential Read Test, the X200P placed first overall with a bandwidth of 14,242.1MB/s, narrowly edging out the Solidigm PS1010 and Micron 9550. It leads the pack in read throughput, showing excellent performance at high queue depth.
128K Sequential Read Latency (IODepth 64 / NumJobs 1)
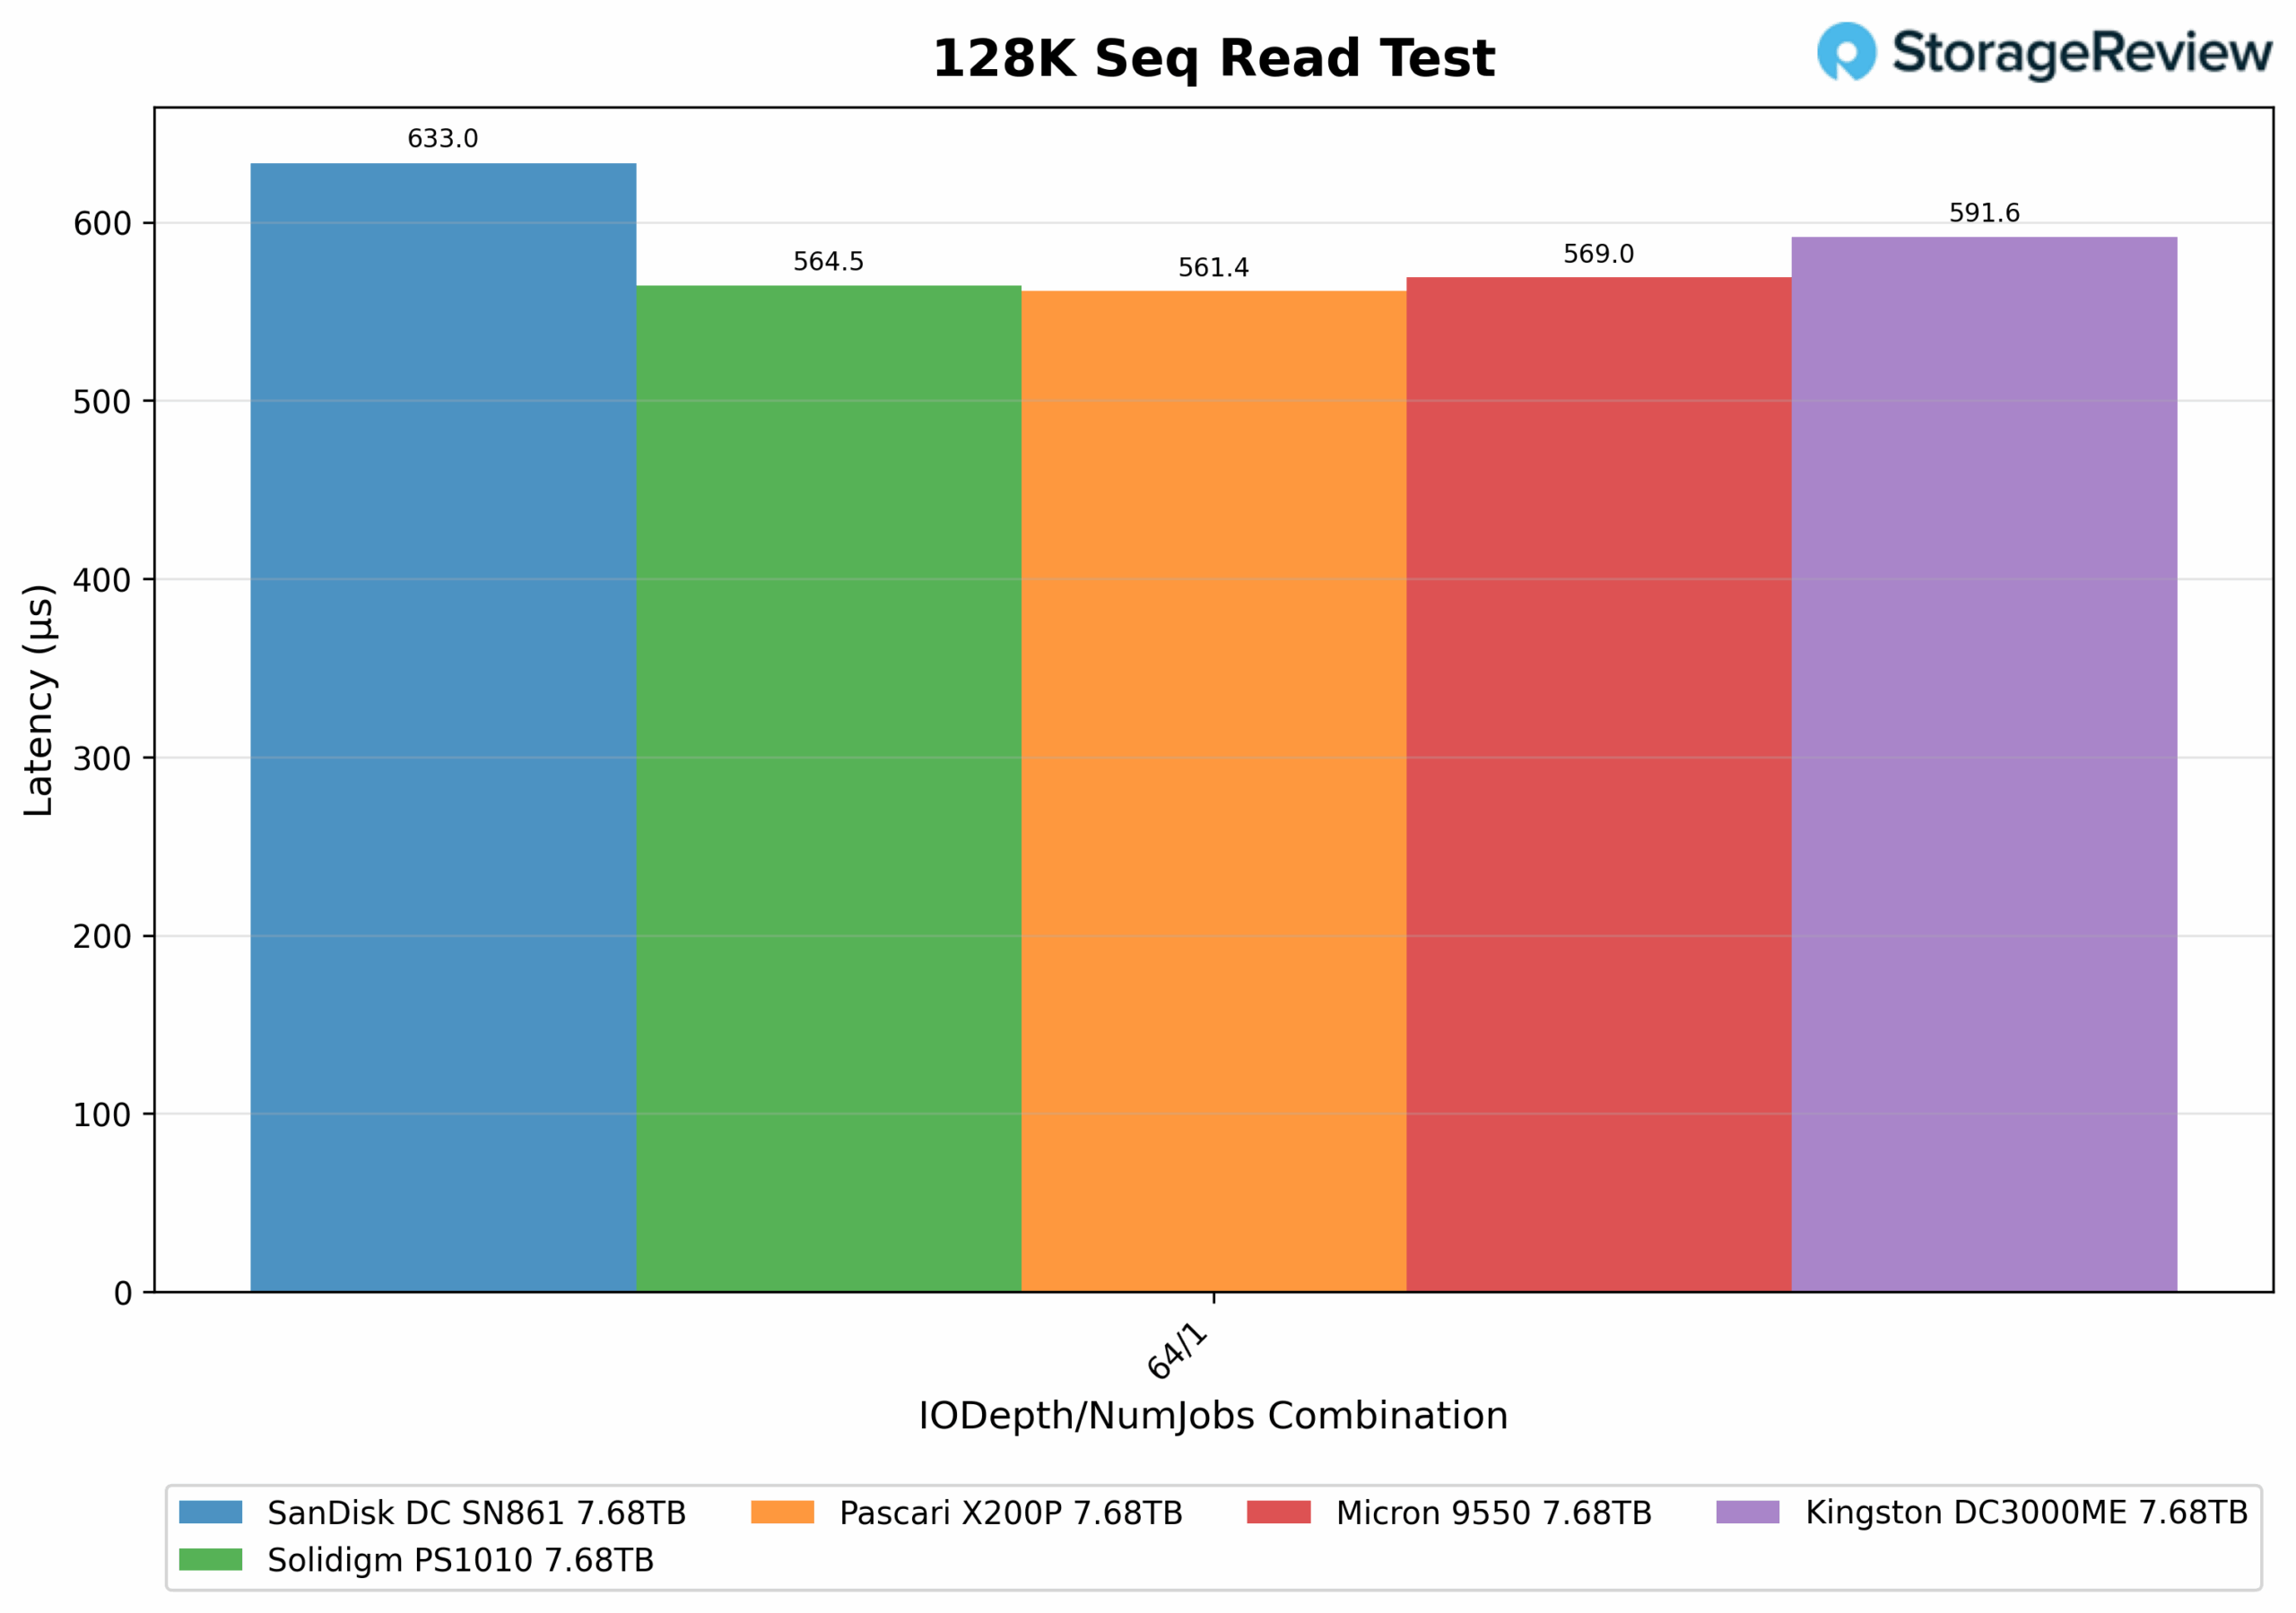
In the 128K Sequential Read Test latency chart, the X200P recorded an average latency of 561.4ms, placing it second in terms of overall latency. It trails the Solidigm PS1010 by a small margin and outperforms the Micron 9550, Kingston DC3000ME, and SanDisk SN861.
64K Random Write
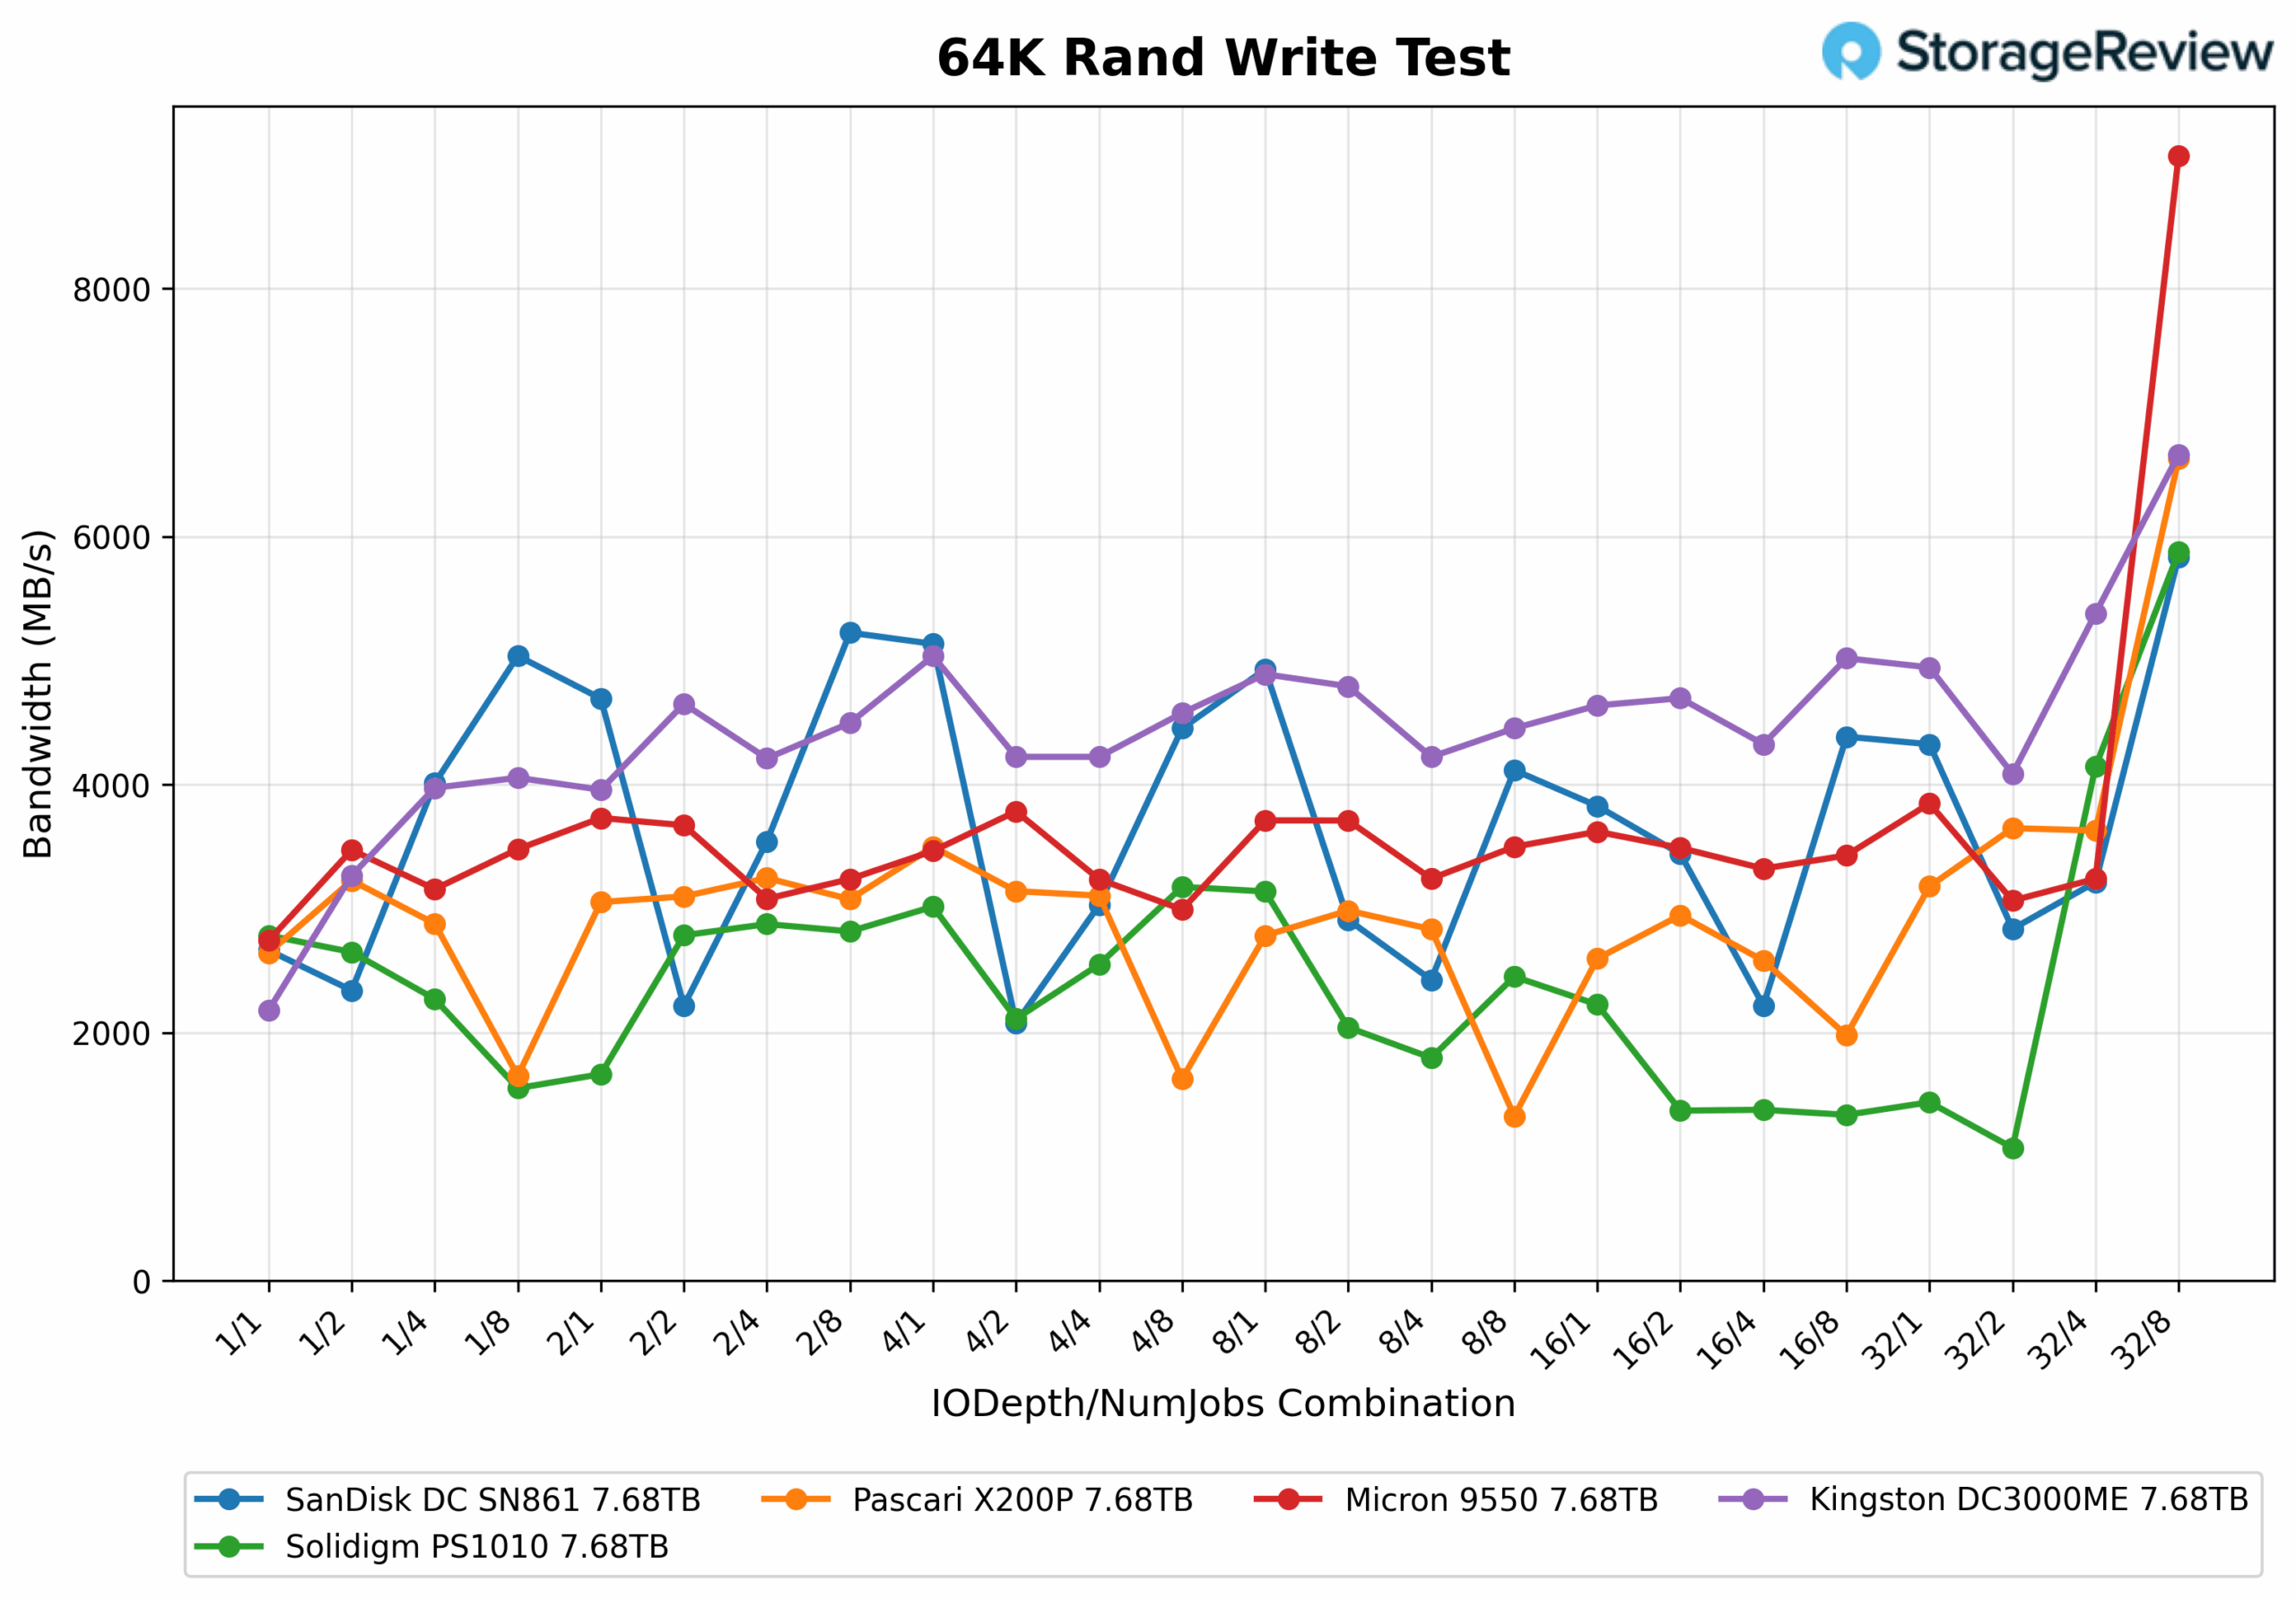
In the 64K Random Write Test, the X200P shows mid-pack performance overall, with some fluctuation across different queue depths and thread combinations. The drive does not yield results within a specific range but maintains generally stable performance between 2,500MB/s and 3,600MB/s across most of the test set. Its peak bandwidth hits 6,625.92 MB/s at the 32/8 IODepth/NumJobs combination, which is among the highest points in the test and gives it a strong finish.
While it isn’t the most consistent performer throughout, the Pascari drive holds its ground in heavier thread loads and performs better toward the higher queue depths.
64K Random Write Latency
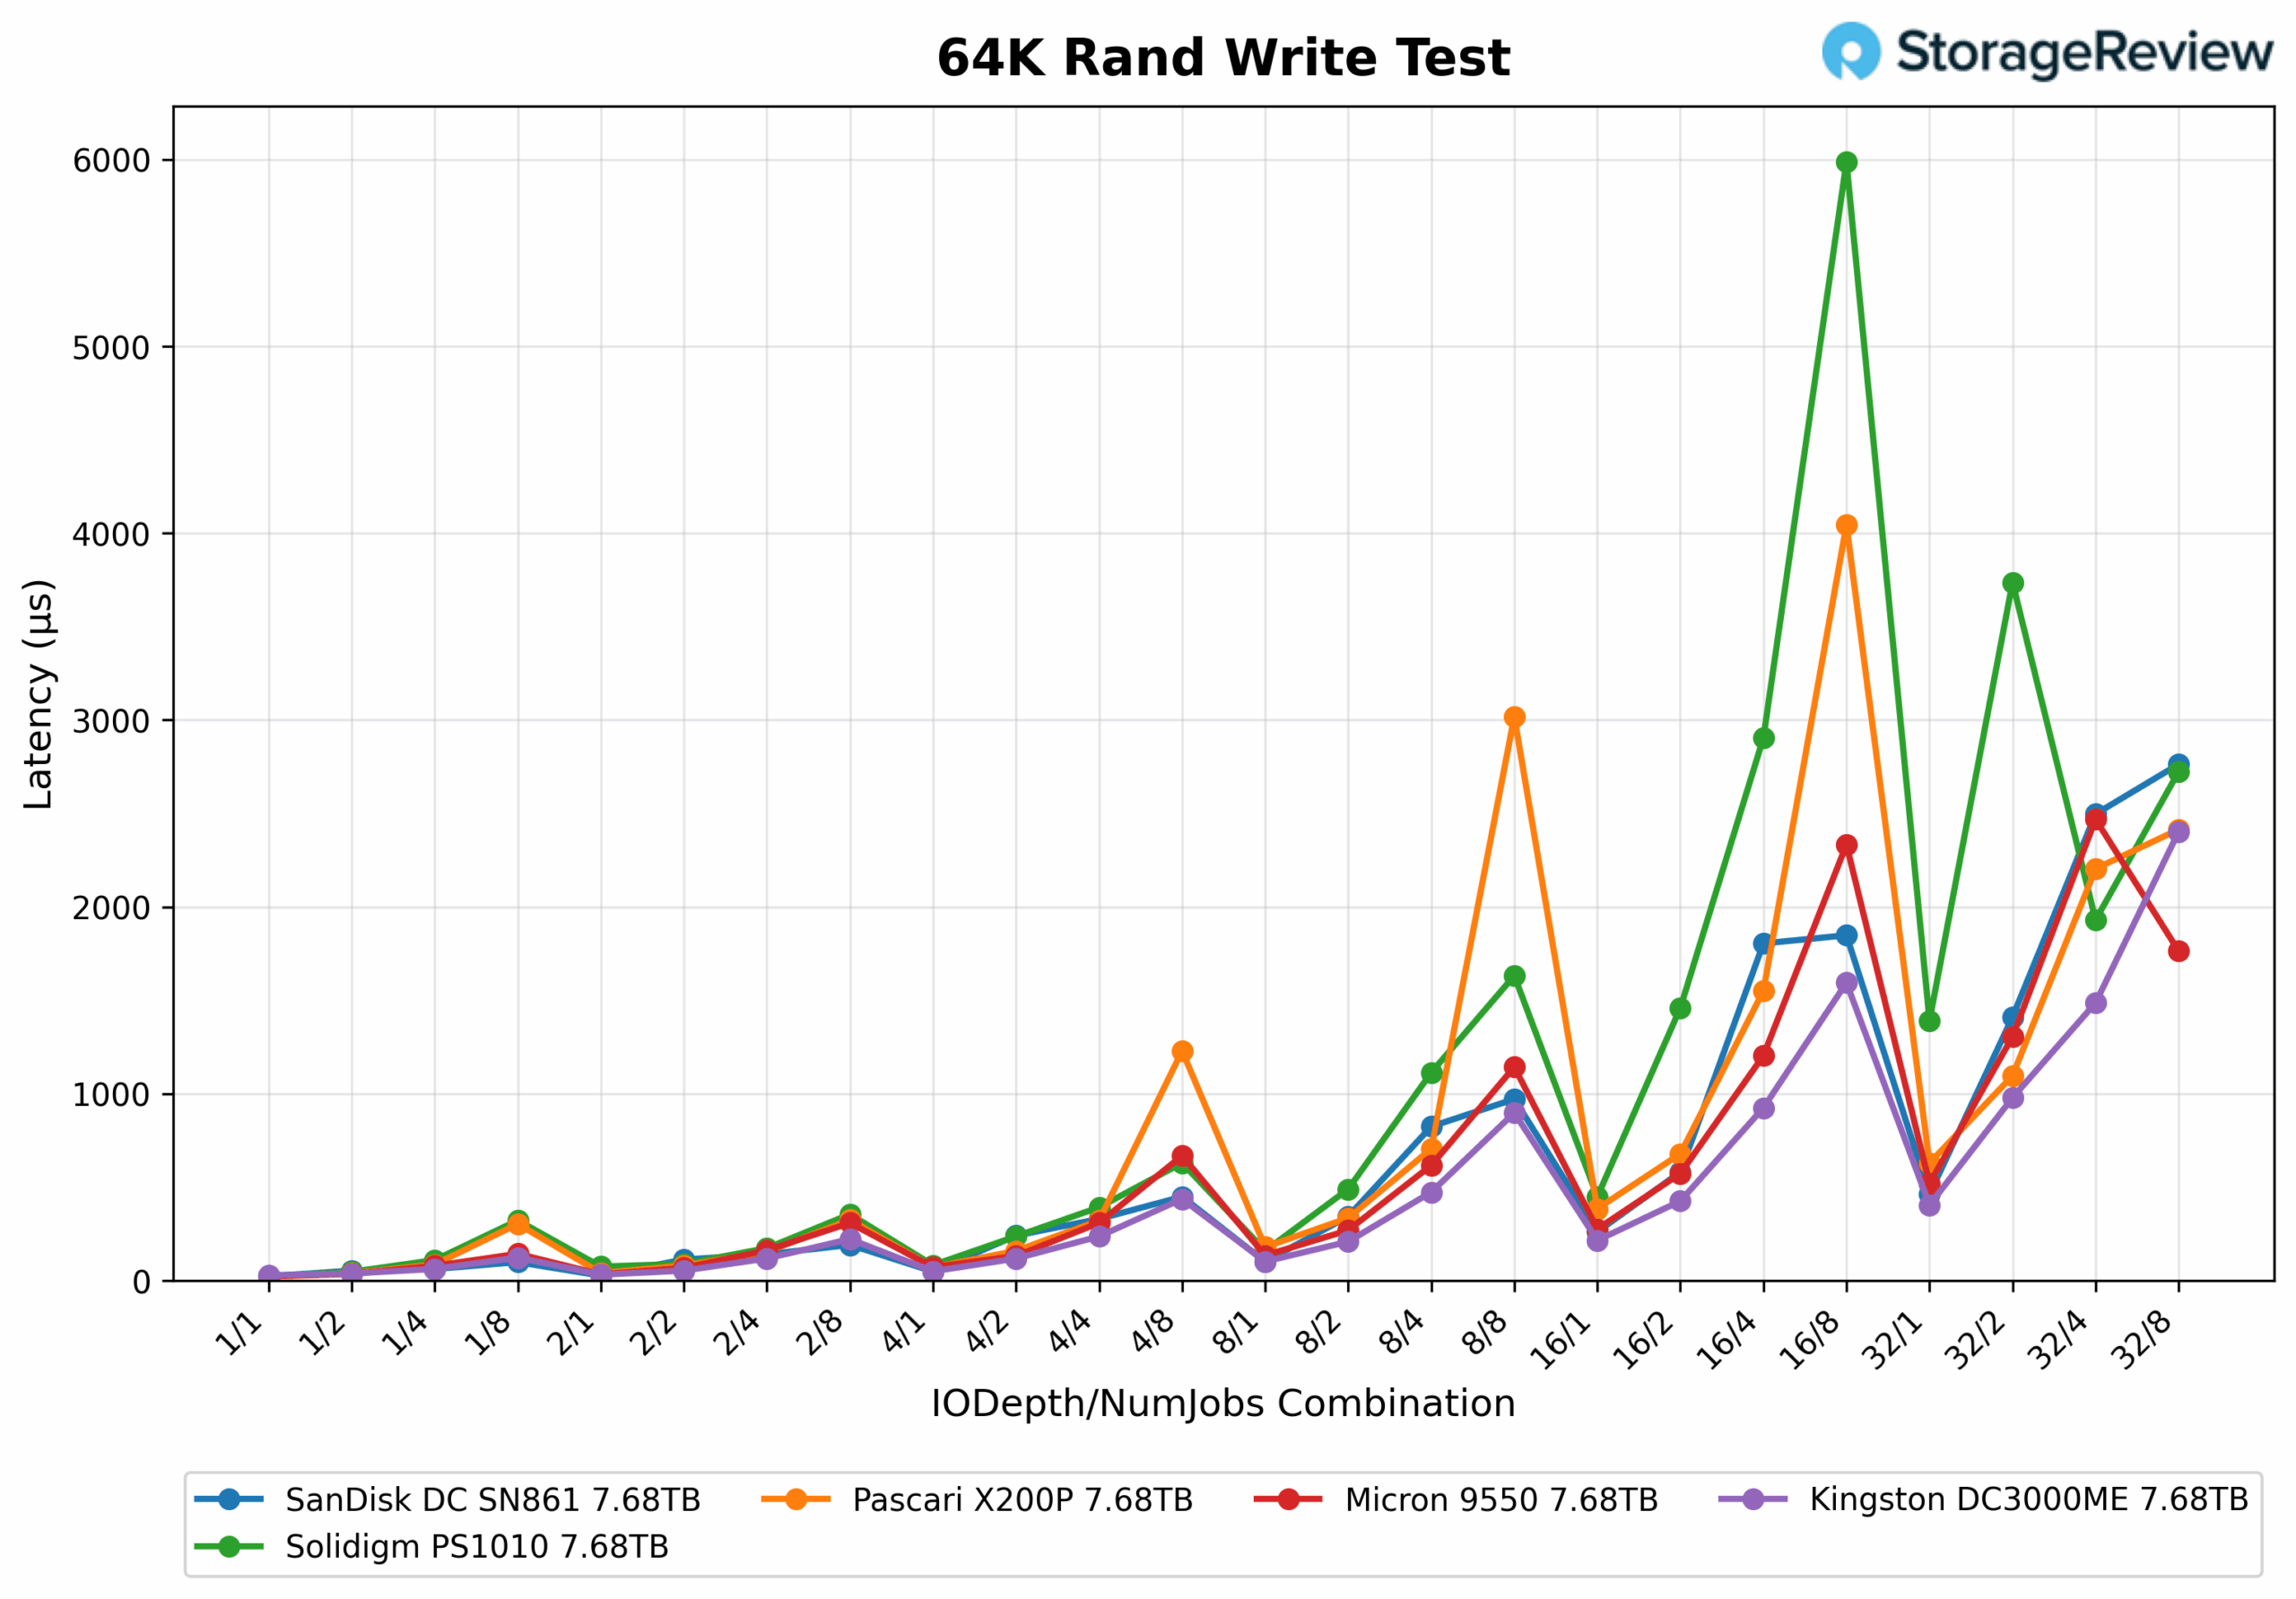
In the 64K Random Write Latency Test, the X200P generally displays low latency under light to moderate queue depths, with standout values of 0.023ms at 1/1 and 0.041ms at 2/1. However, under heavier thread and queue combinations such as 16/8 and 8/8, latency spikes significantly, reaching as high as 4.045ms and 3.019ms, respectively.
64K Random Read
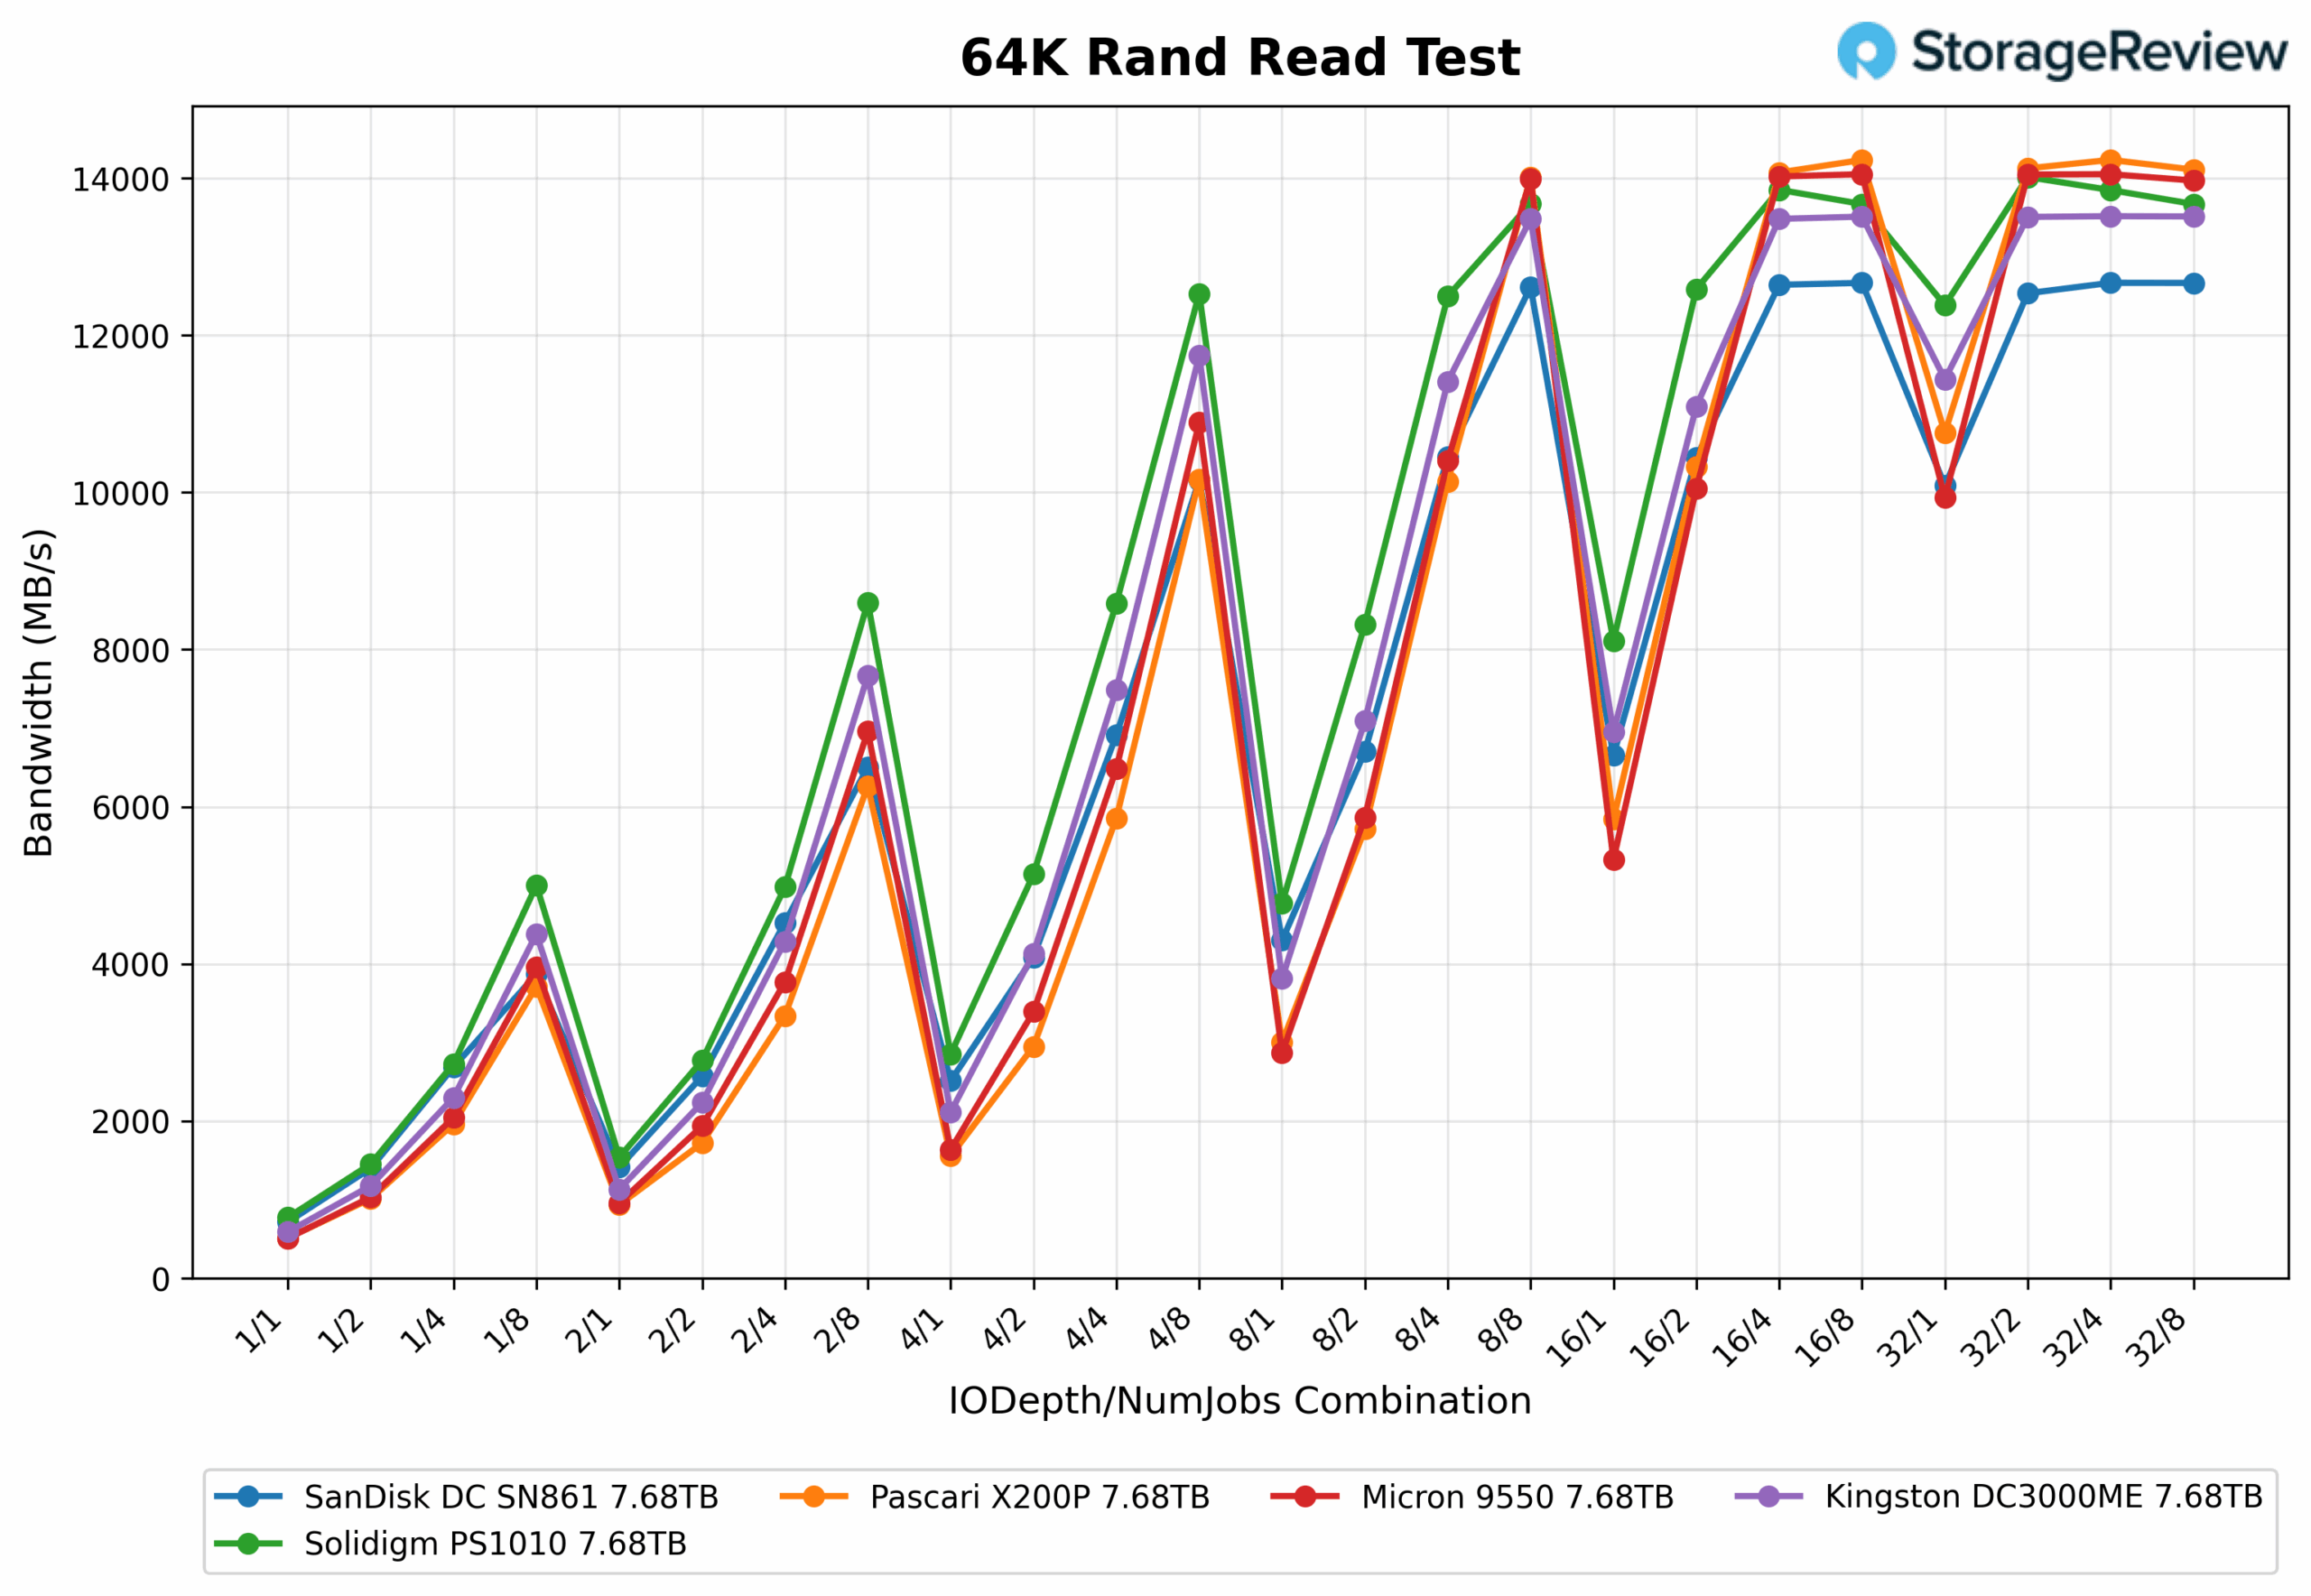
In the 64K Random Read Test, the X200P performs consistently well across the full range of queue depths and thread counts, closely tracking the top drives throughout. While it doesn’t initially claim the top spot, it takes the lead at QD 16/8 and 32/8, reaching a peak bandwidth of 14,232 MB/s, tying or edging out the competition at the highest levels of load. This demonstrates the drive’s ability to scale under heavy parallel access.
64K Random Read Latency
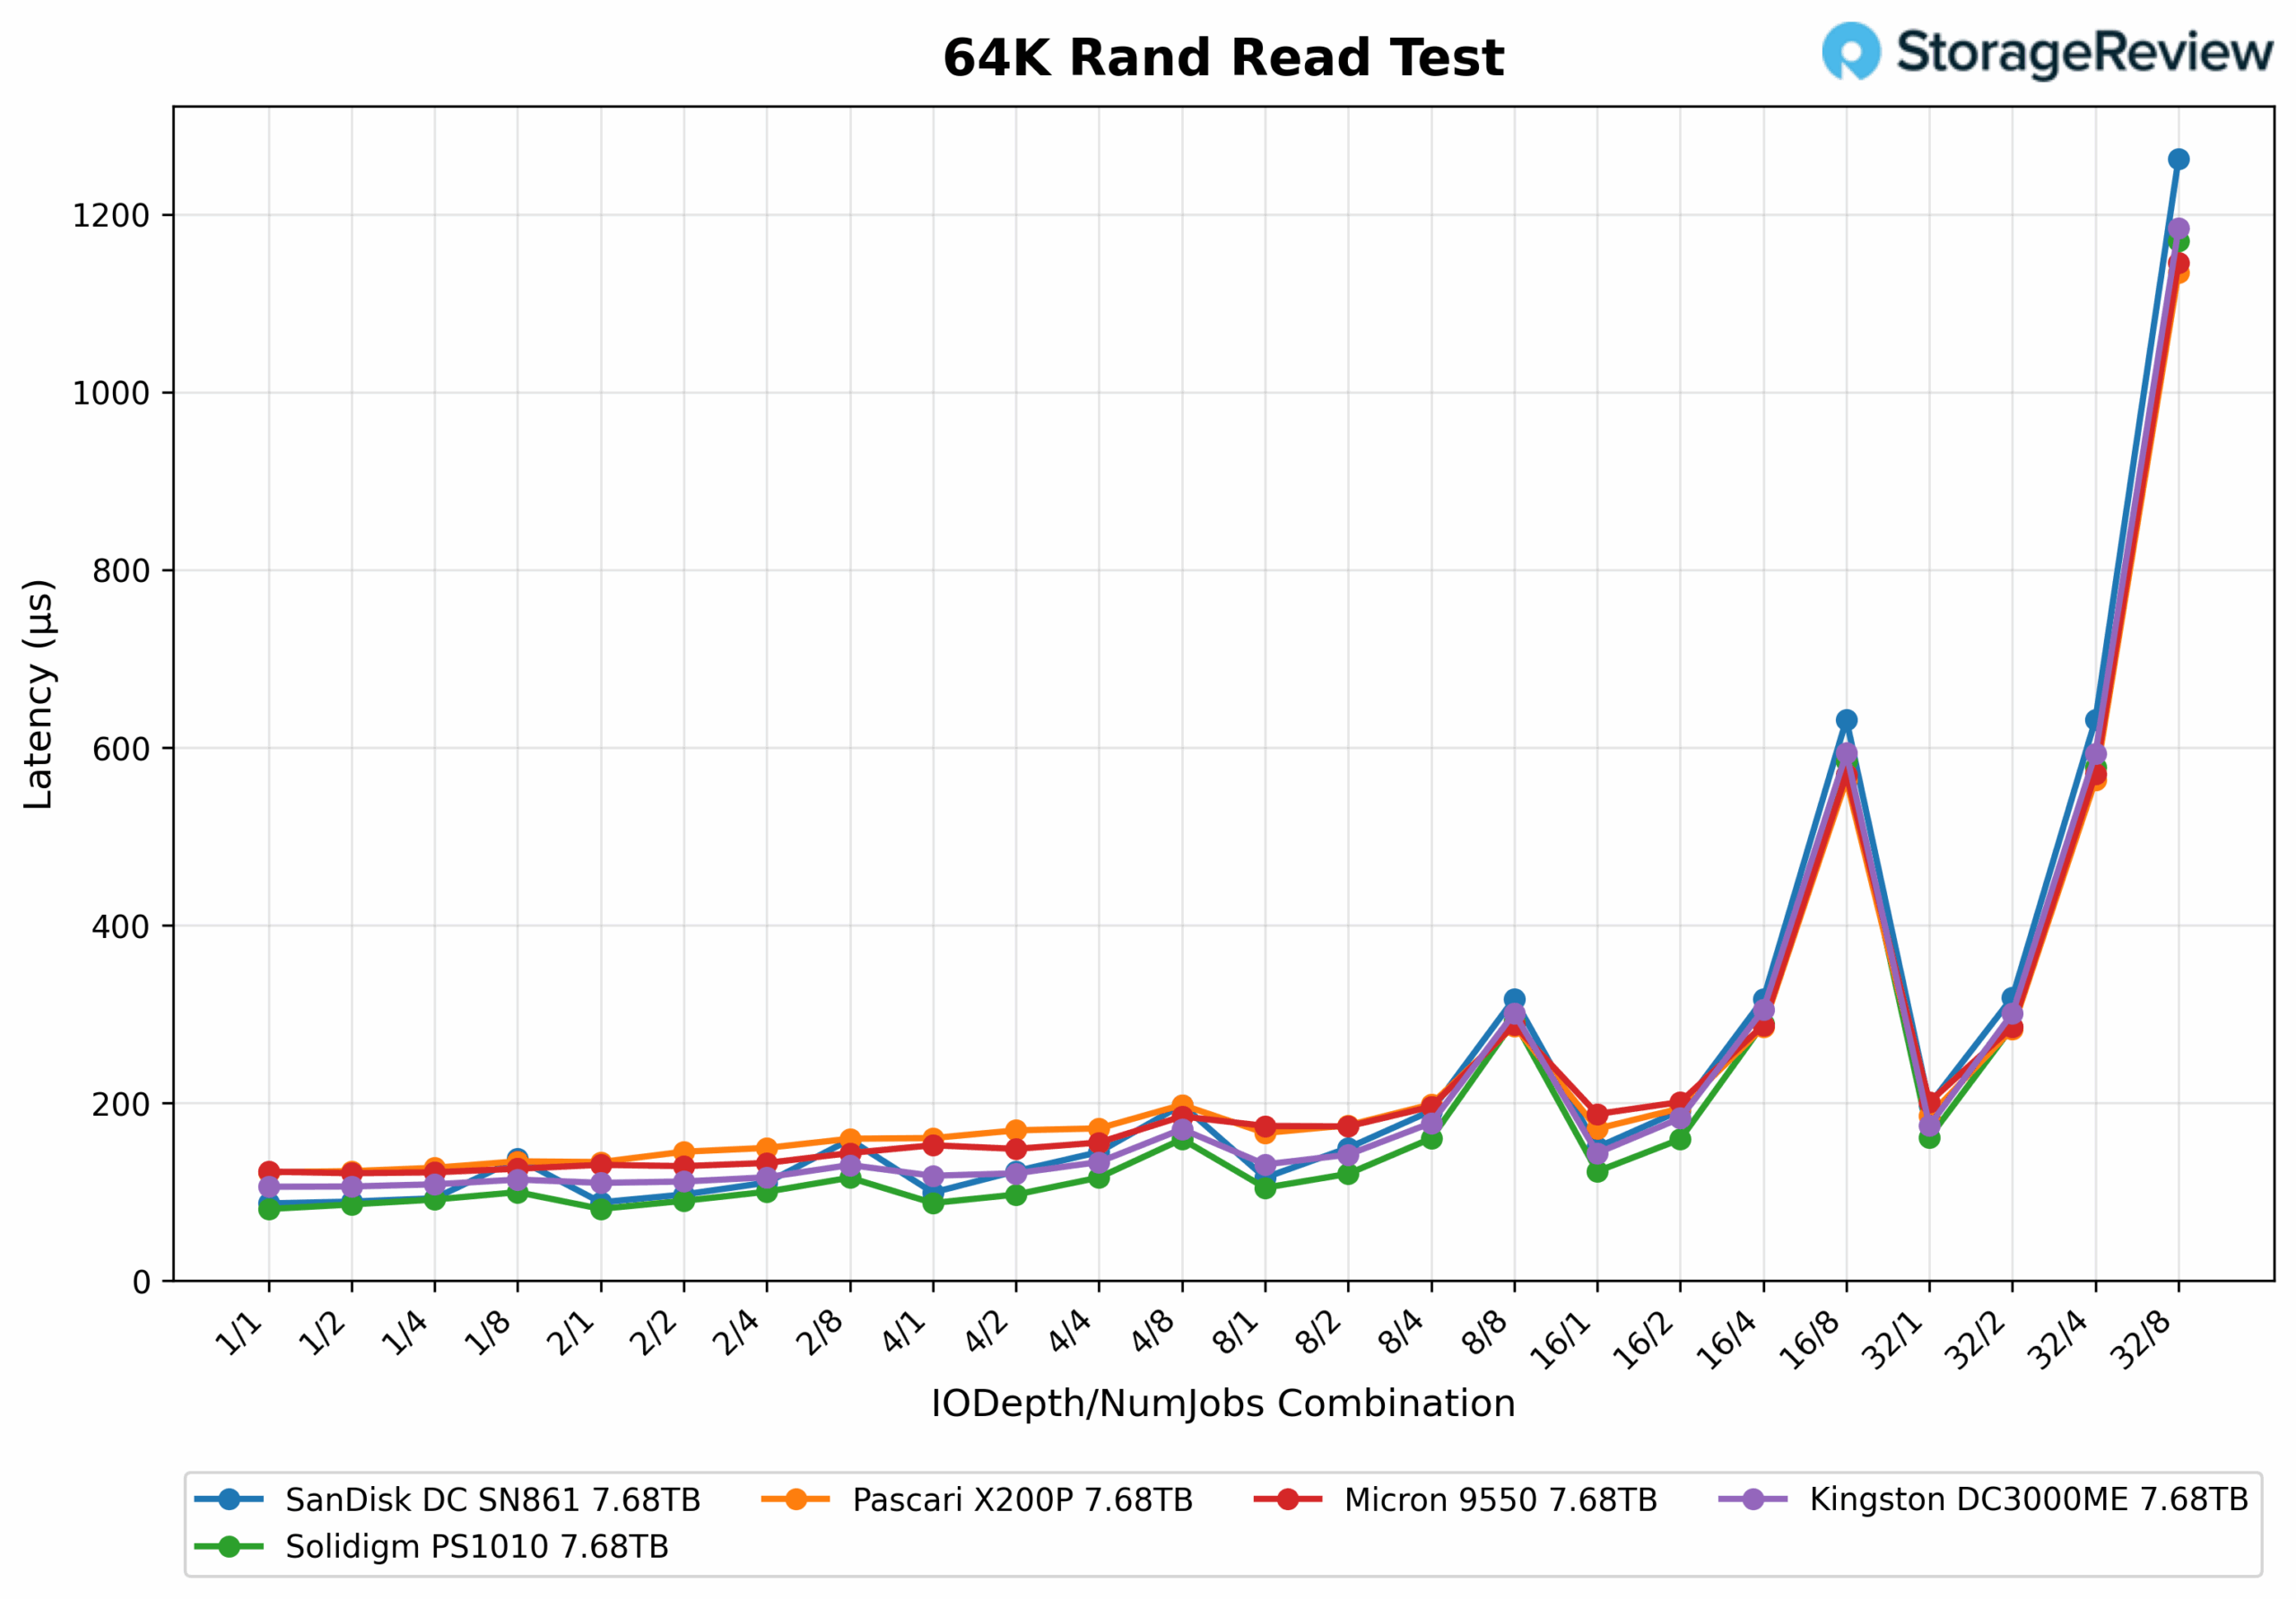
In the 64K Random Read latency test, the X200P consistently maintains low latency across light to moderate queue depths and thread counts, typically staying below 0.2 milliseconds. Latency begins to rise more noticeably at QD16/4, reaching 0.285ms, and then climbs further at QD32/4 to 0.563ms. The most significant increase occurs at QD32/8, where latency peaks at 1.135ms.
16K Random Write
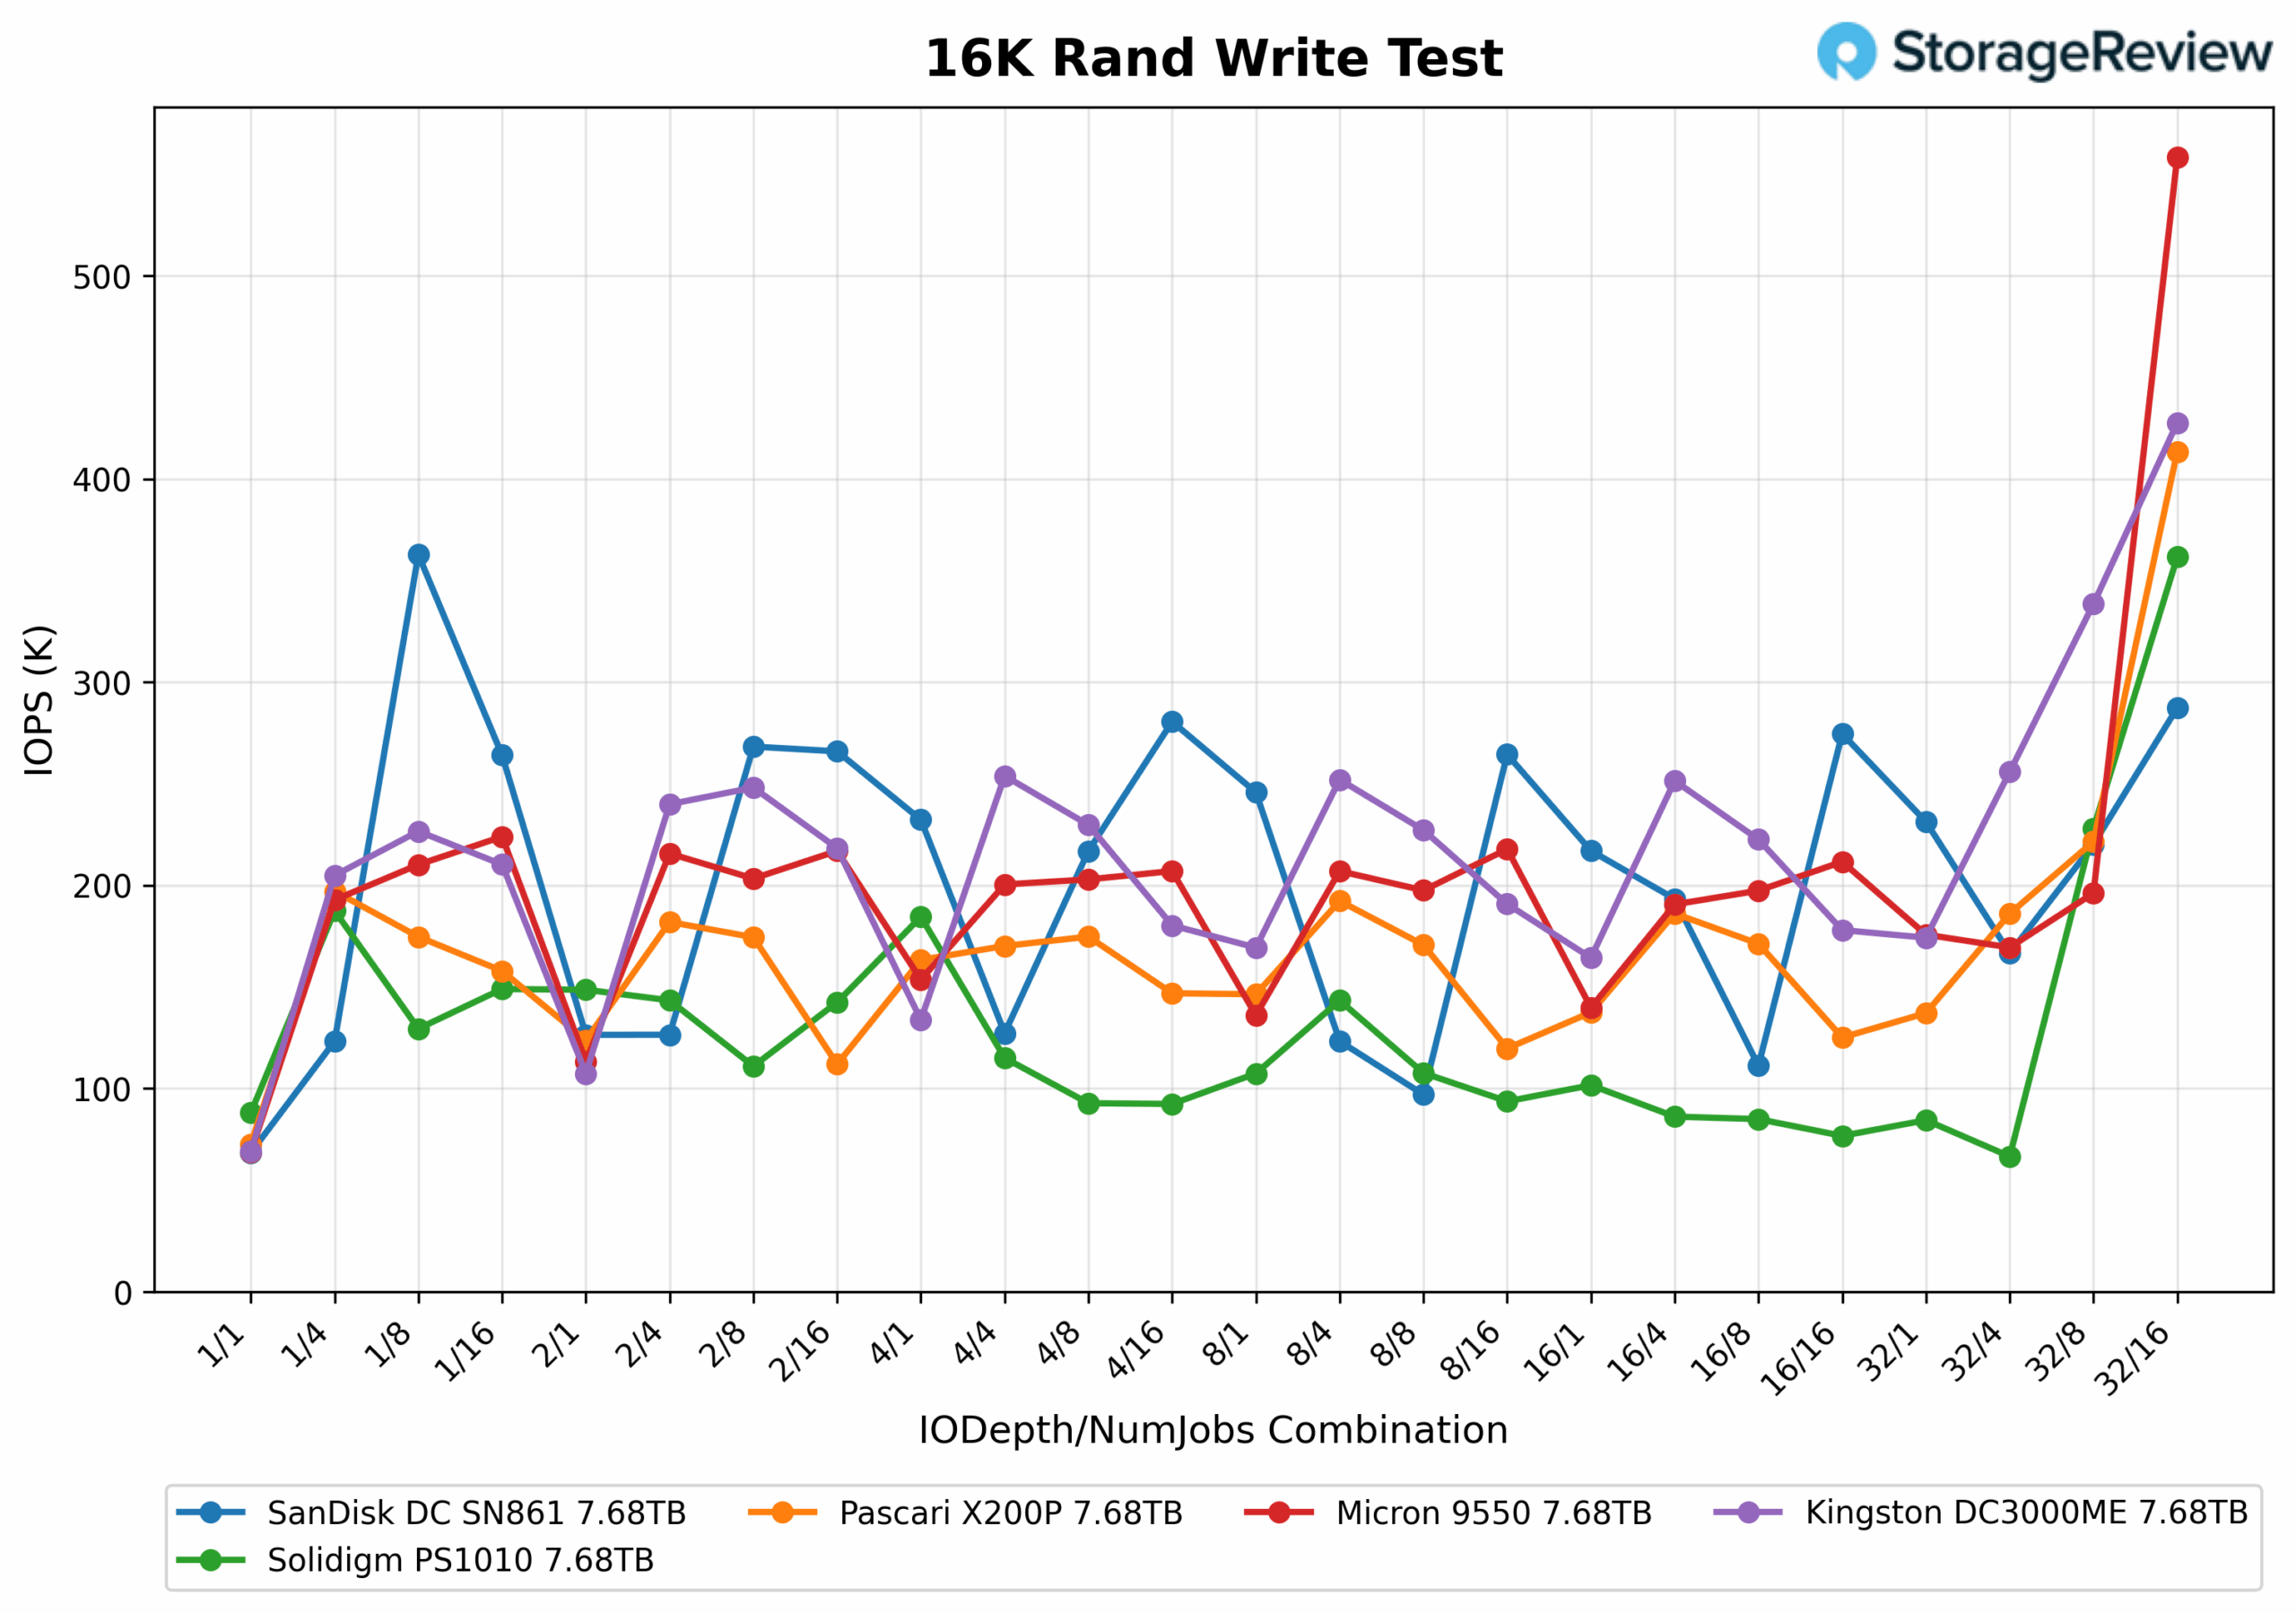
In the 16K Random Write Test, the X200P maintains a solid mid-pack position across most queue and thread combinations, delivering between 170K and 190K IOPS in typical configurations like 4/4, 8/4, and 4/8. Performance begins to scale meaningfully at heavier loads, jumping to 221K IOPS at 32/8 and peaking at 413K IOPS at 32/16. At that point, it finishes just below the Kingston DC3000ME (428K IOPS), which leads by a slight margin. This strong finish demonstrates Pascari’s ability to scale effectively under maximum write pressure, even if it doesn’t take the top spot.
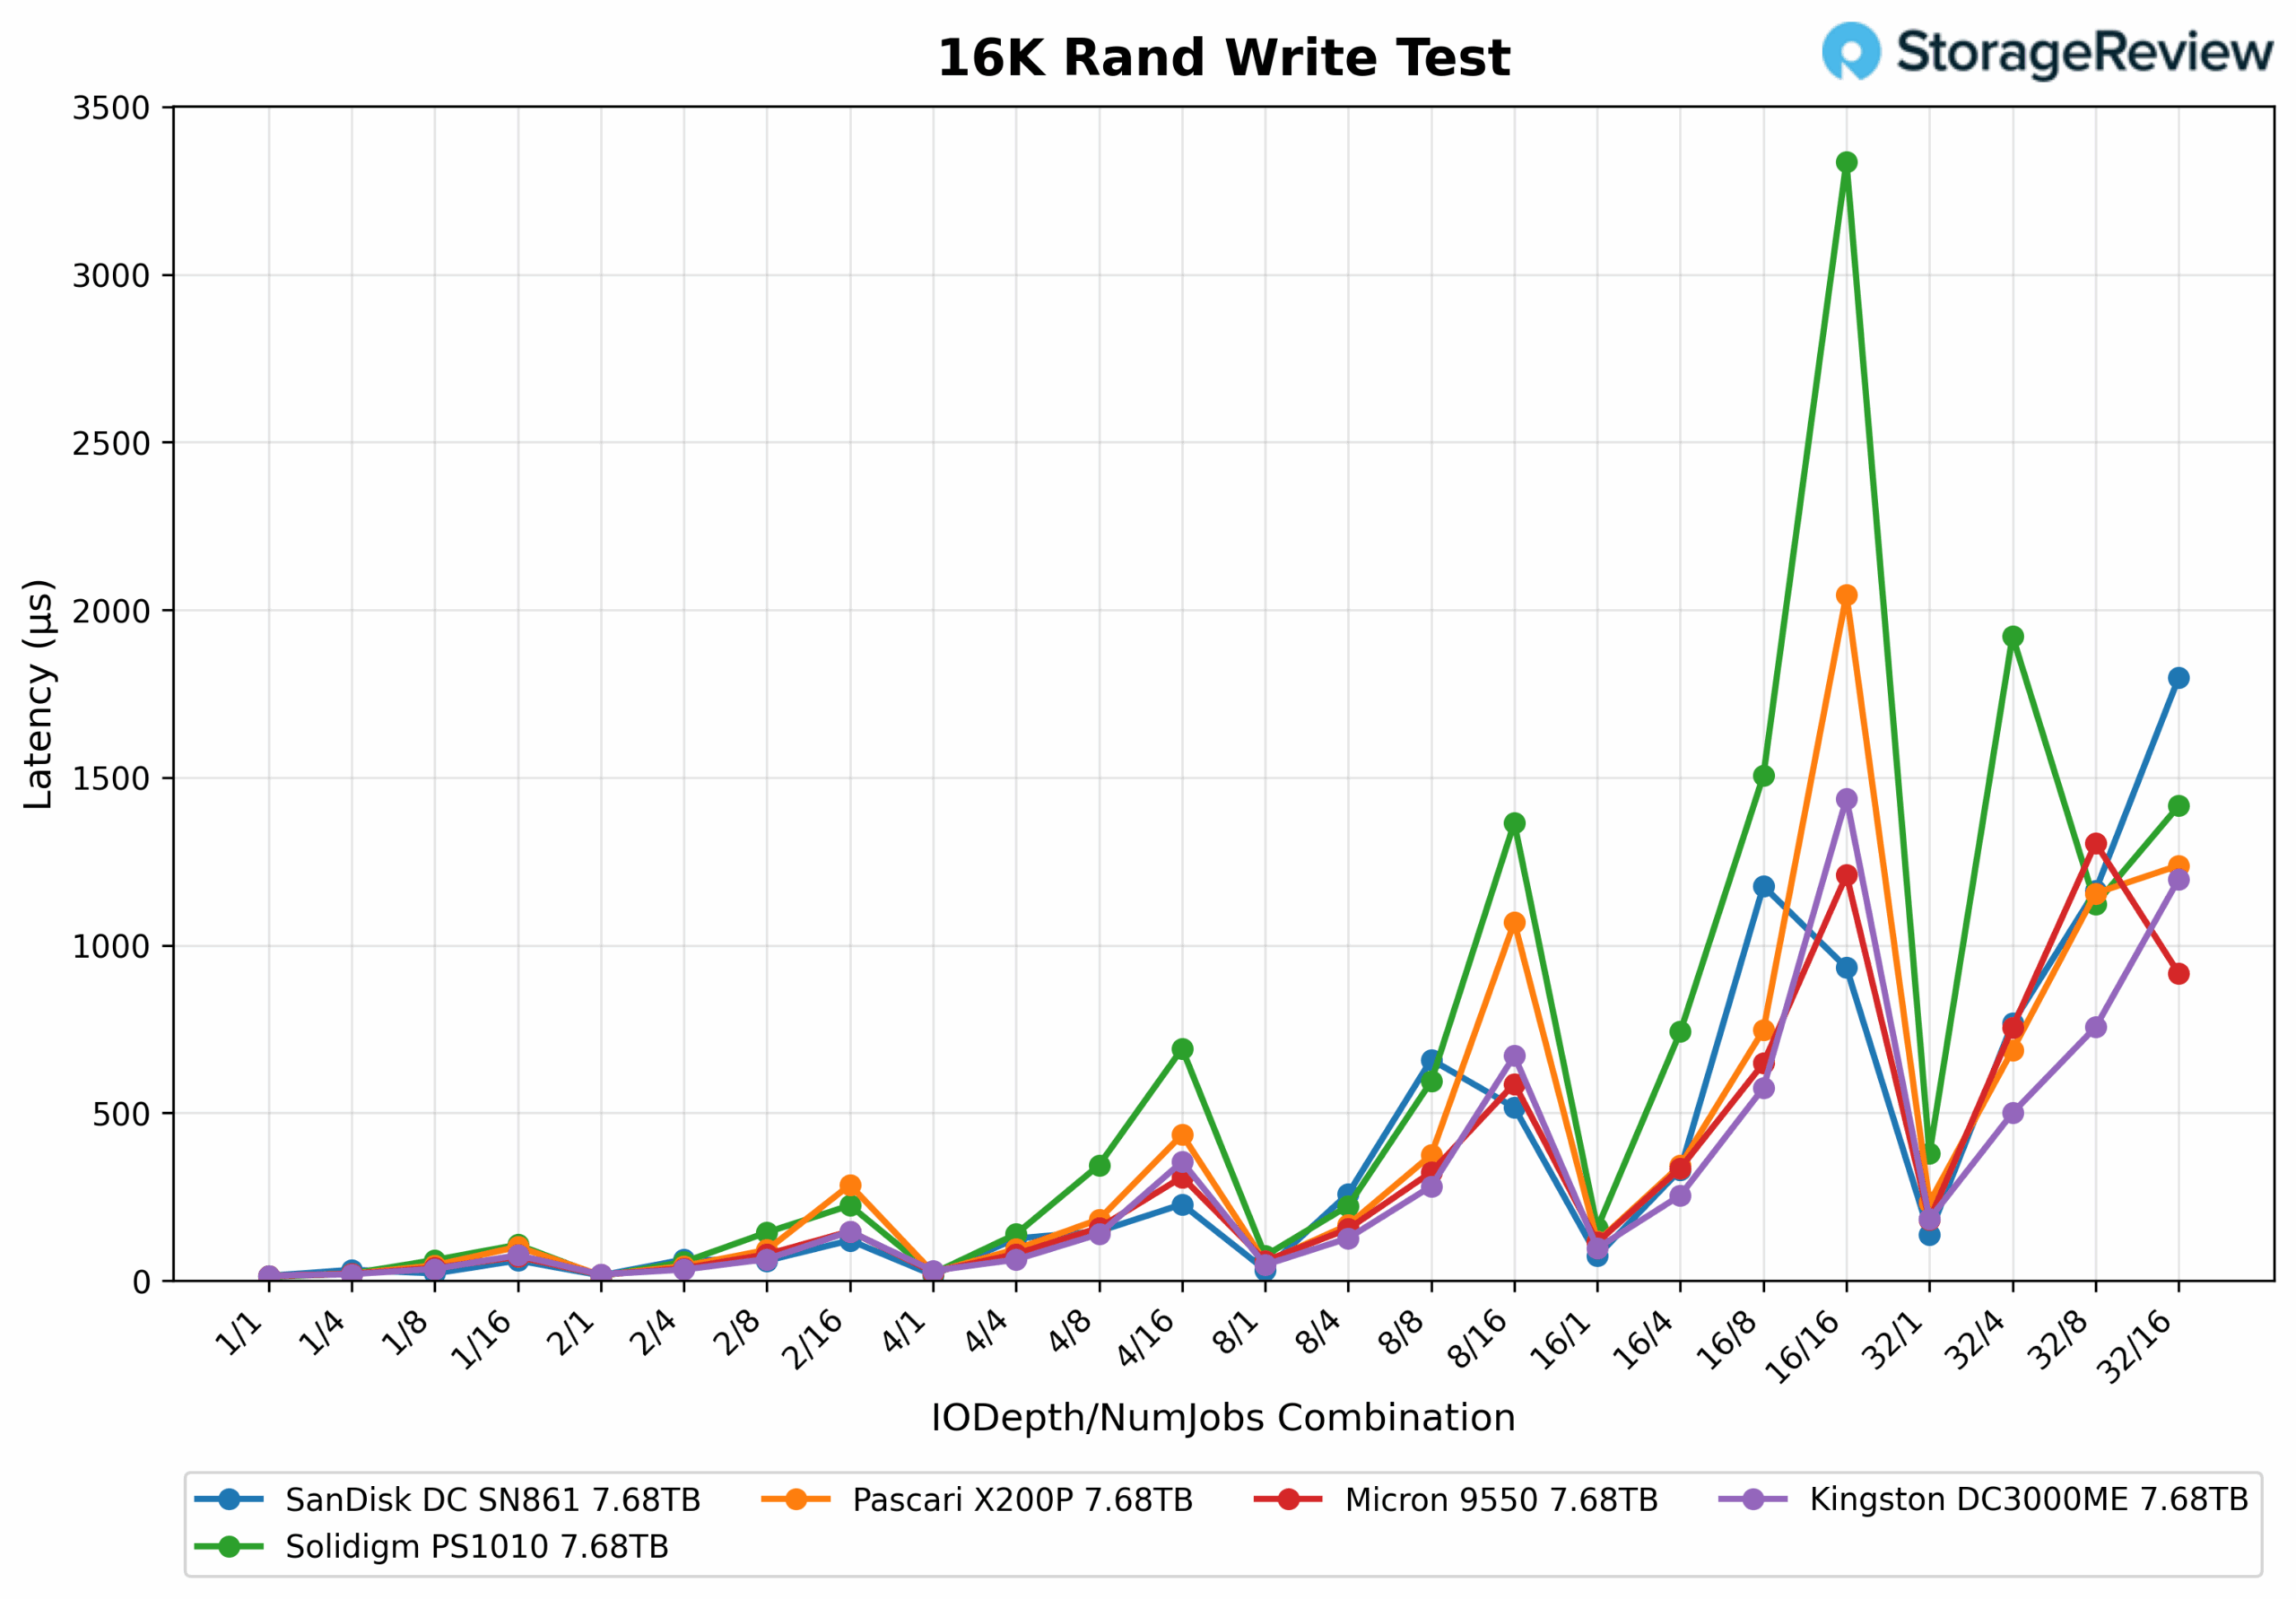
In the 16K Random Write latency test, the X200P maintains very low latency across most configurations, typically staying below 0.2ms in settings such as 4/4, 8/4, and 2/8. It begins to climb moderately at QD16/4, reaching 0.343ms, and more sharply at QD32/4, where it hits 0.687ms. At the highest loads, QD16/16 and QD32/8 exhibit further latency increases to 1.068ms and 1.155ms, respectively. Its peak latency occurs at QD16/16 with 2.045ms, just before it settles again slightly at QD32/16 with 1.238ms. Overall, the Pascari doesn’t have the flattest latency curve, but it maintains reasonable control, placing it just behind Kingston at the top of the chart.
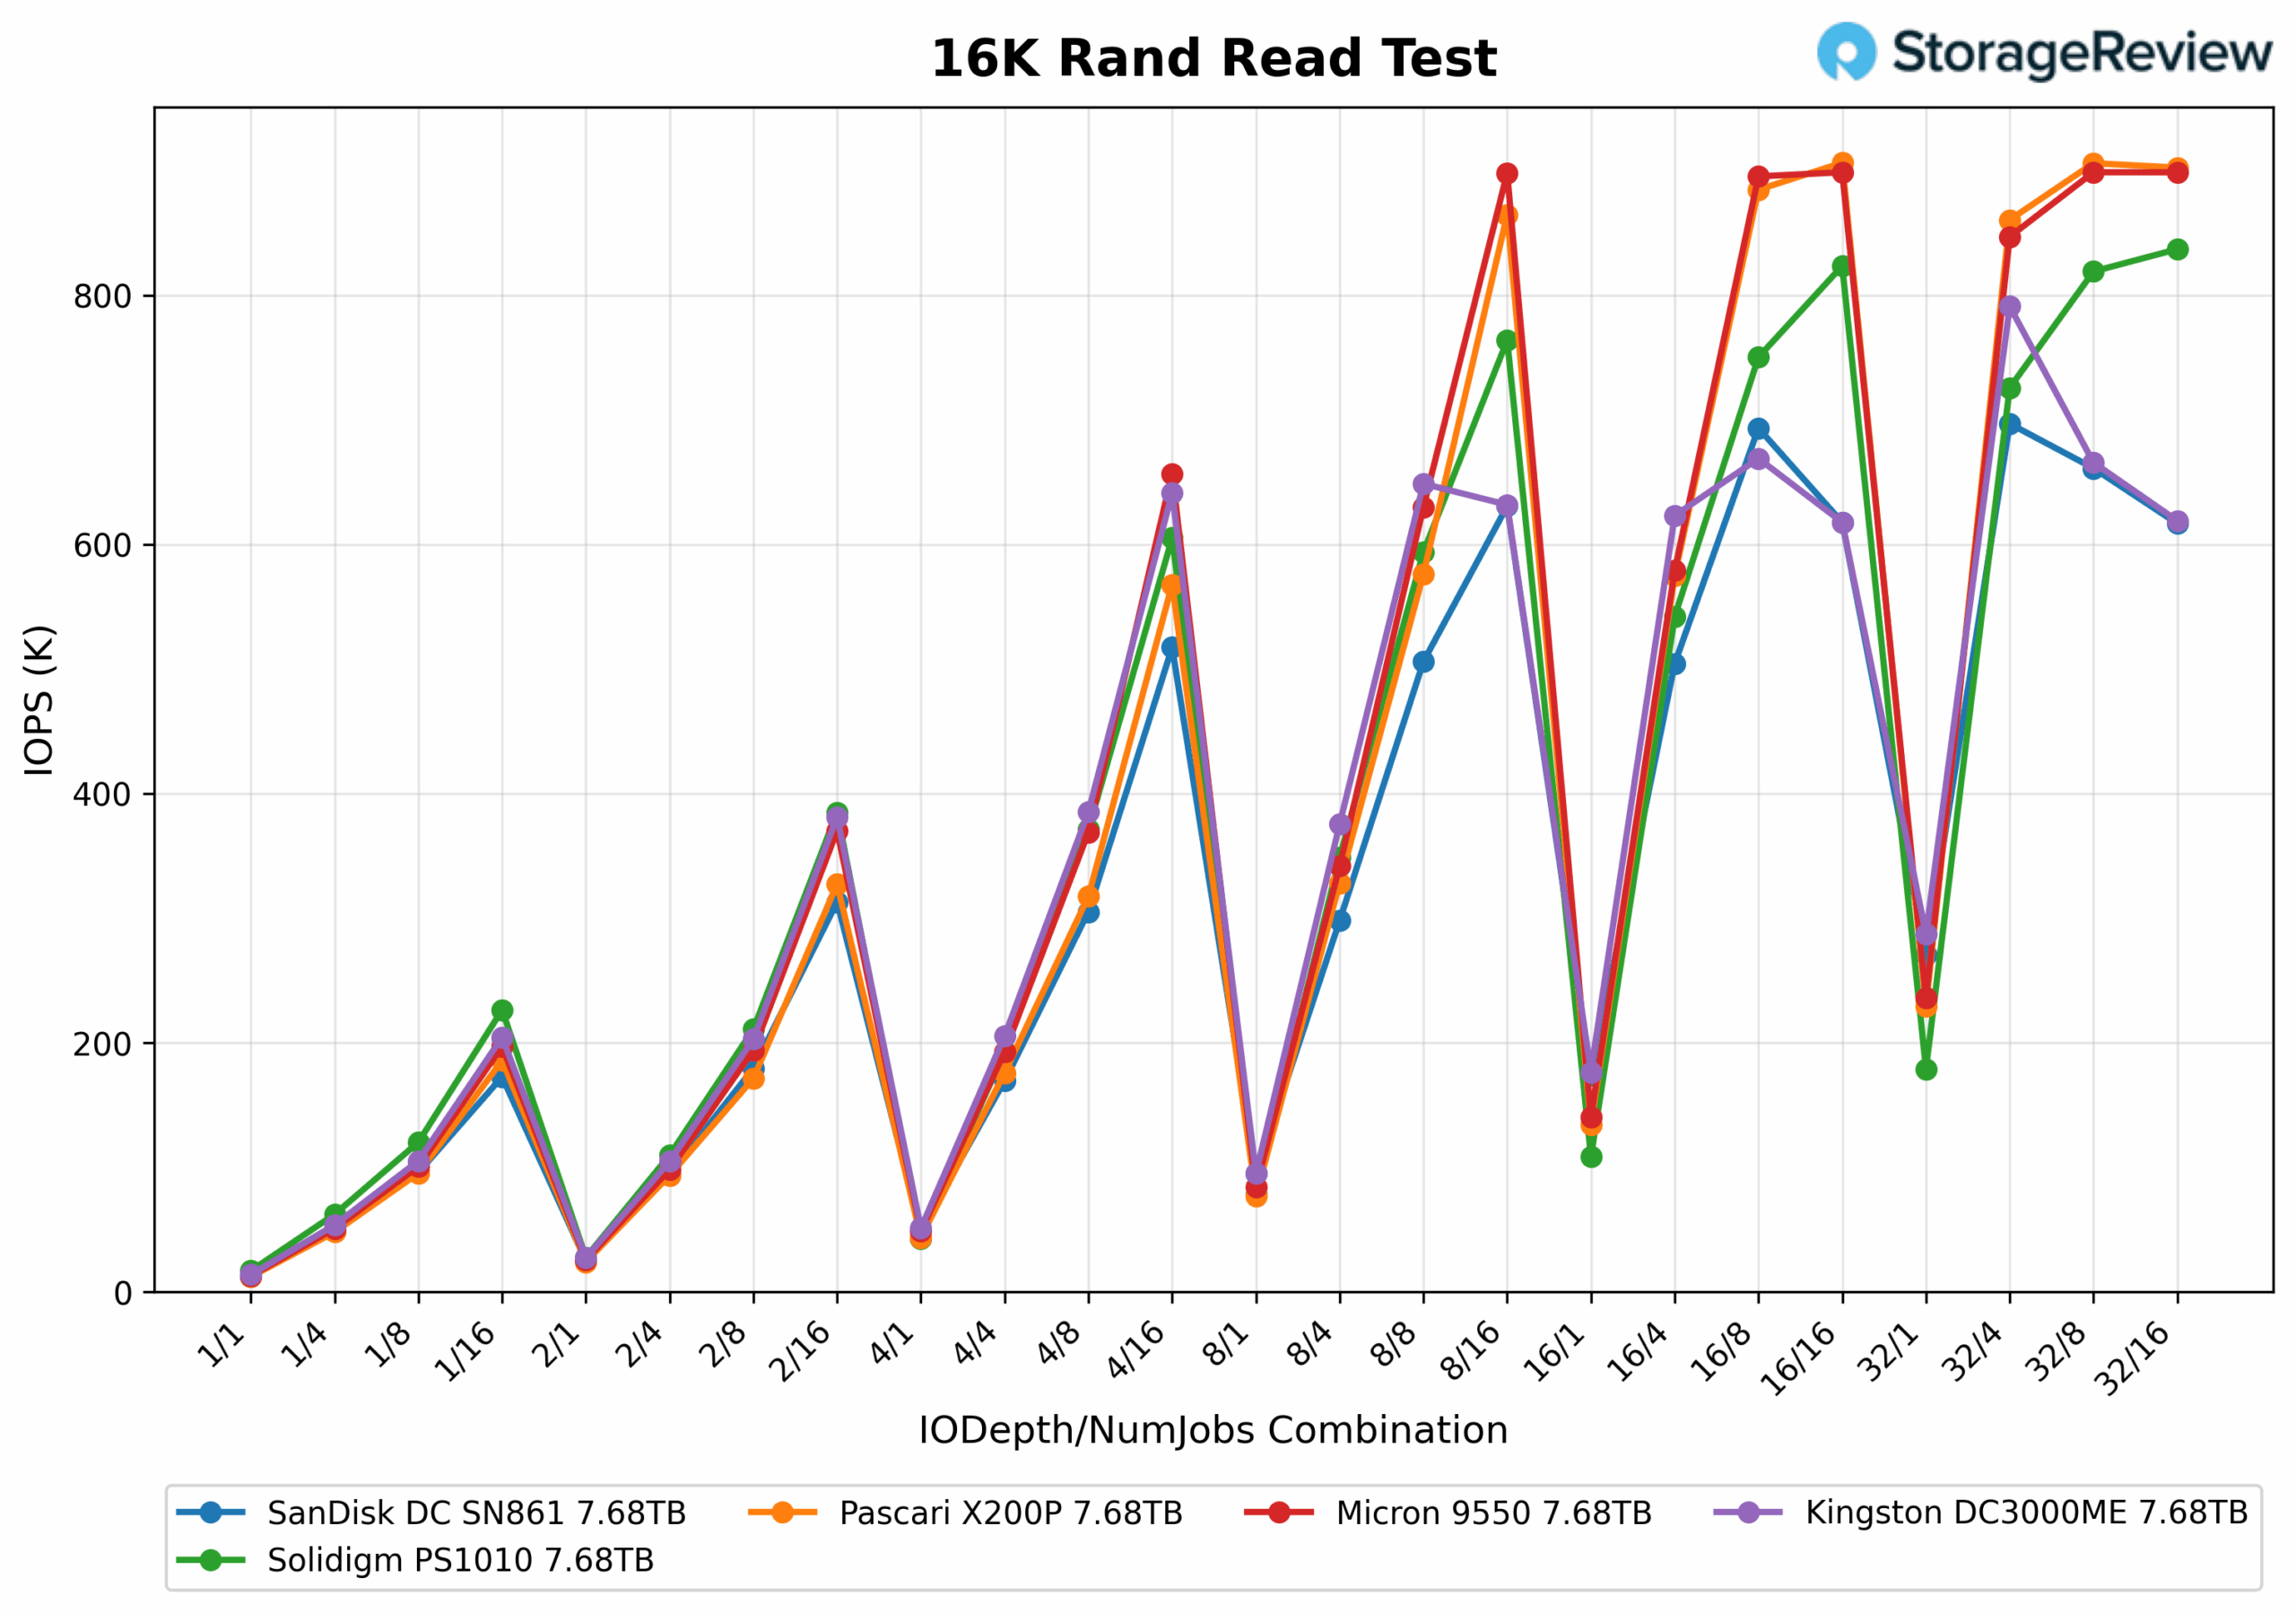
In the 16K Random Read Test, the X200P delivers solid performance, scaling cleanly across queue depths and thread counts. It peaks at 906K IOPS at QD16/16, with a nearly identical result of 905.9K IOPS at QD32/8. It also maintains strong output at QD32/16 with 902.4K IOPS, placing it firmly in the top group. While it doesn’t lead at lower queue depths, Pascari steadily climbs and holds its position among the top performers under sustained read pressure, demonstrating both high throughput and effective scaling.
16K Random Read Latency
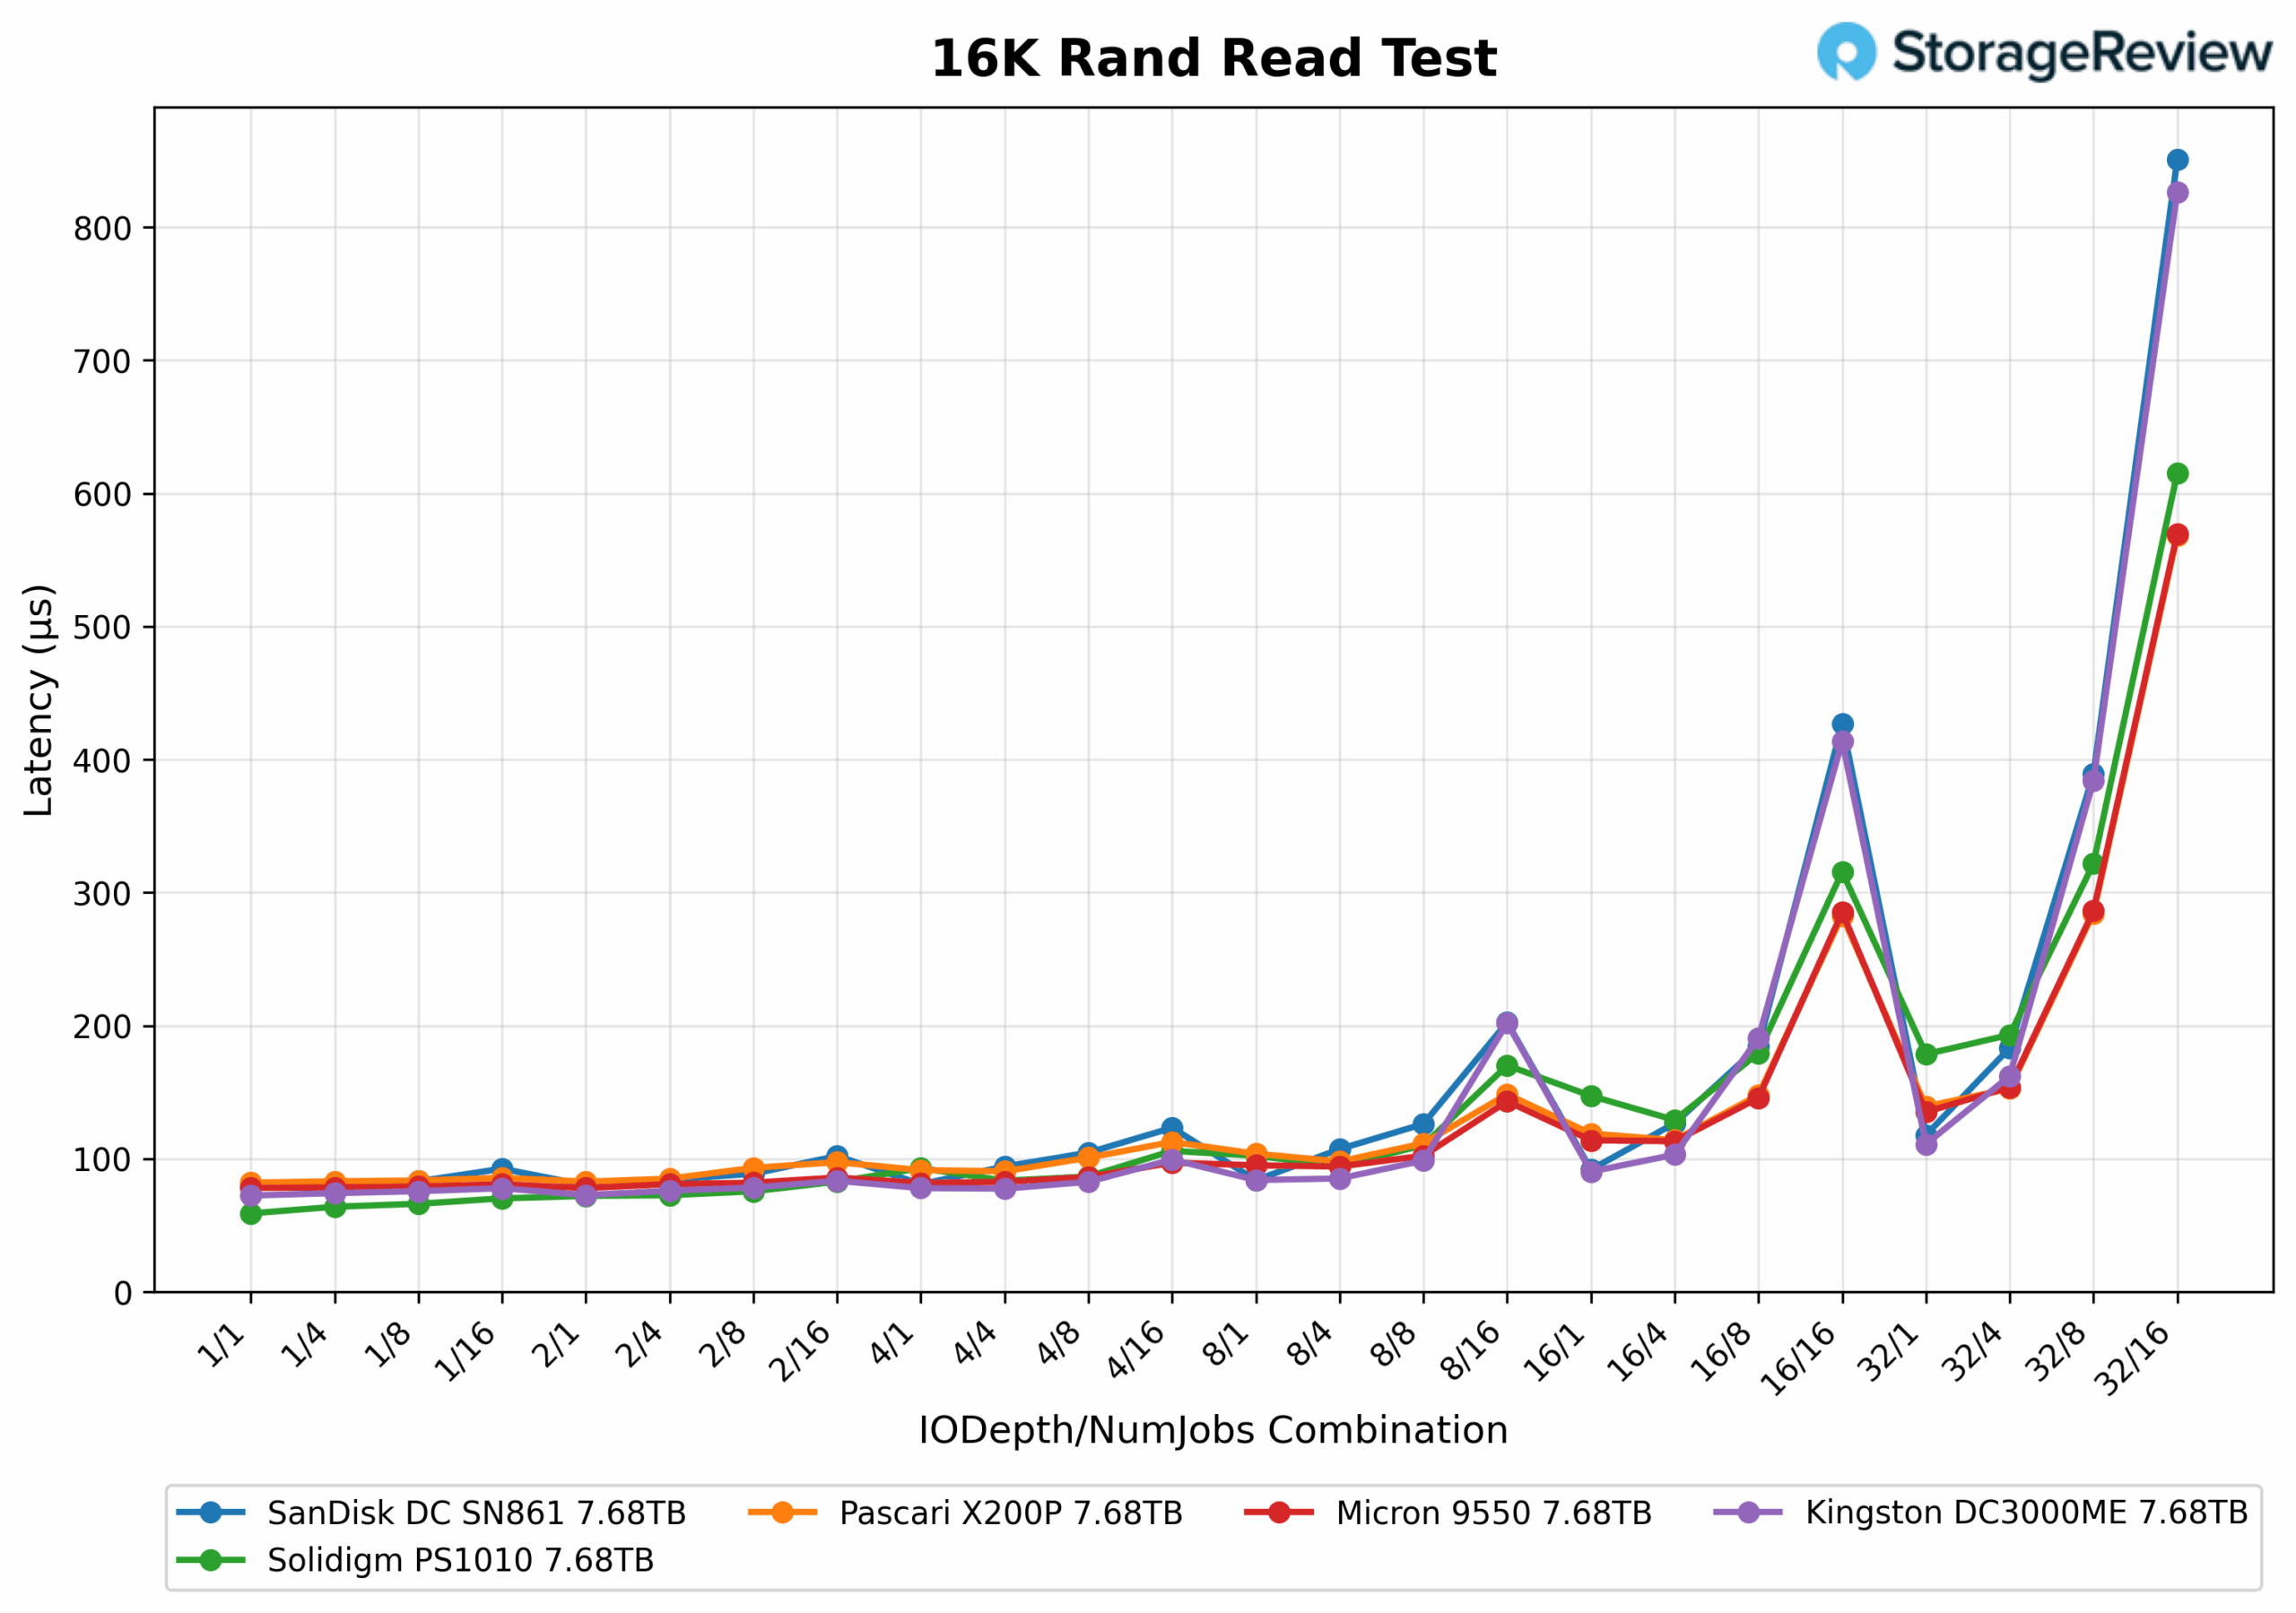
In the 16K Random Read Latency Test, the X200P maintained low and consistent latency across most queue depths and thread counts. It started at just 0.082ms at QD1/1 and remained under 0.1ms through many mid-range combinations, including 0.091ms at QD4/1 and QD4/4, and 0.093ms at QD2/8. As load increased, latency began to rise slightly, reaching 0.114ms at QD16/4 and 0.148ms at QD16/8. The highest latency was observed at QD32/16, with 0.568ms, where the drive still maintained 902K IOPS.
4K Random Write
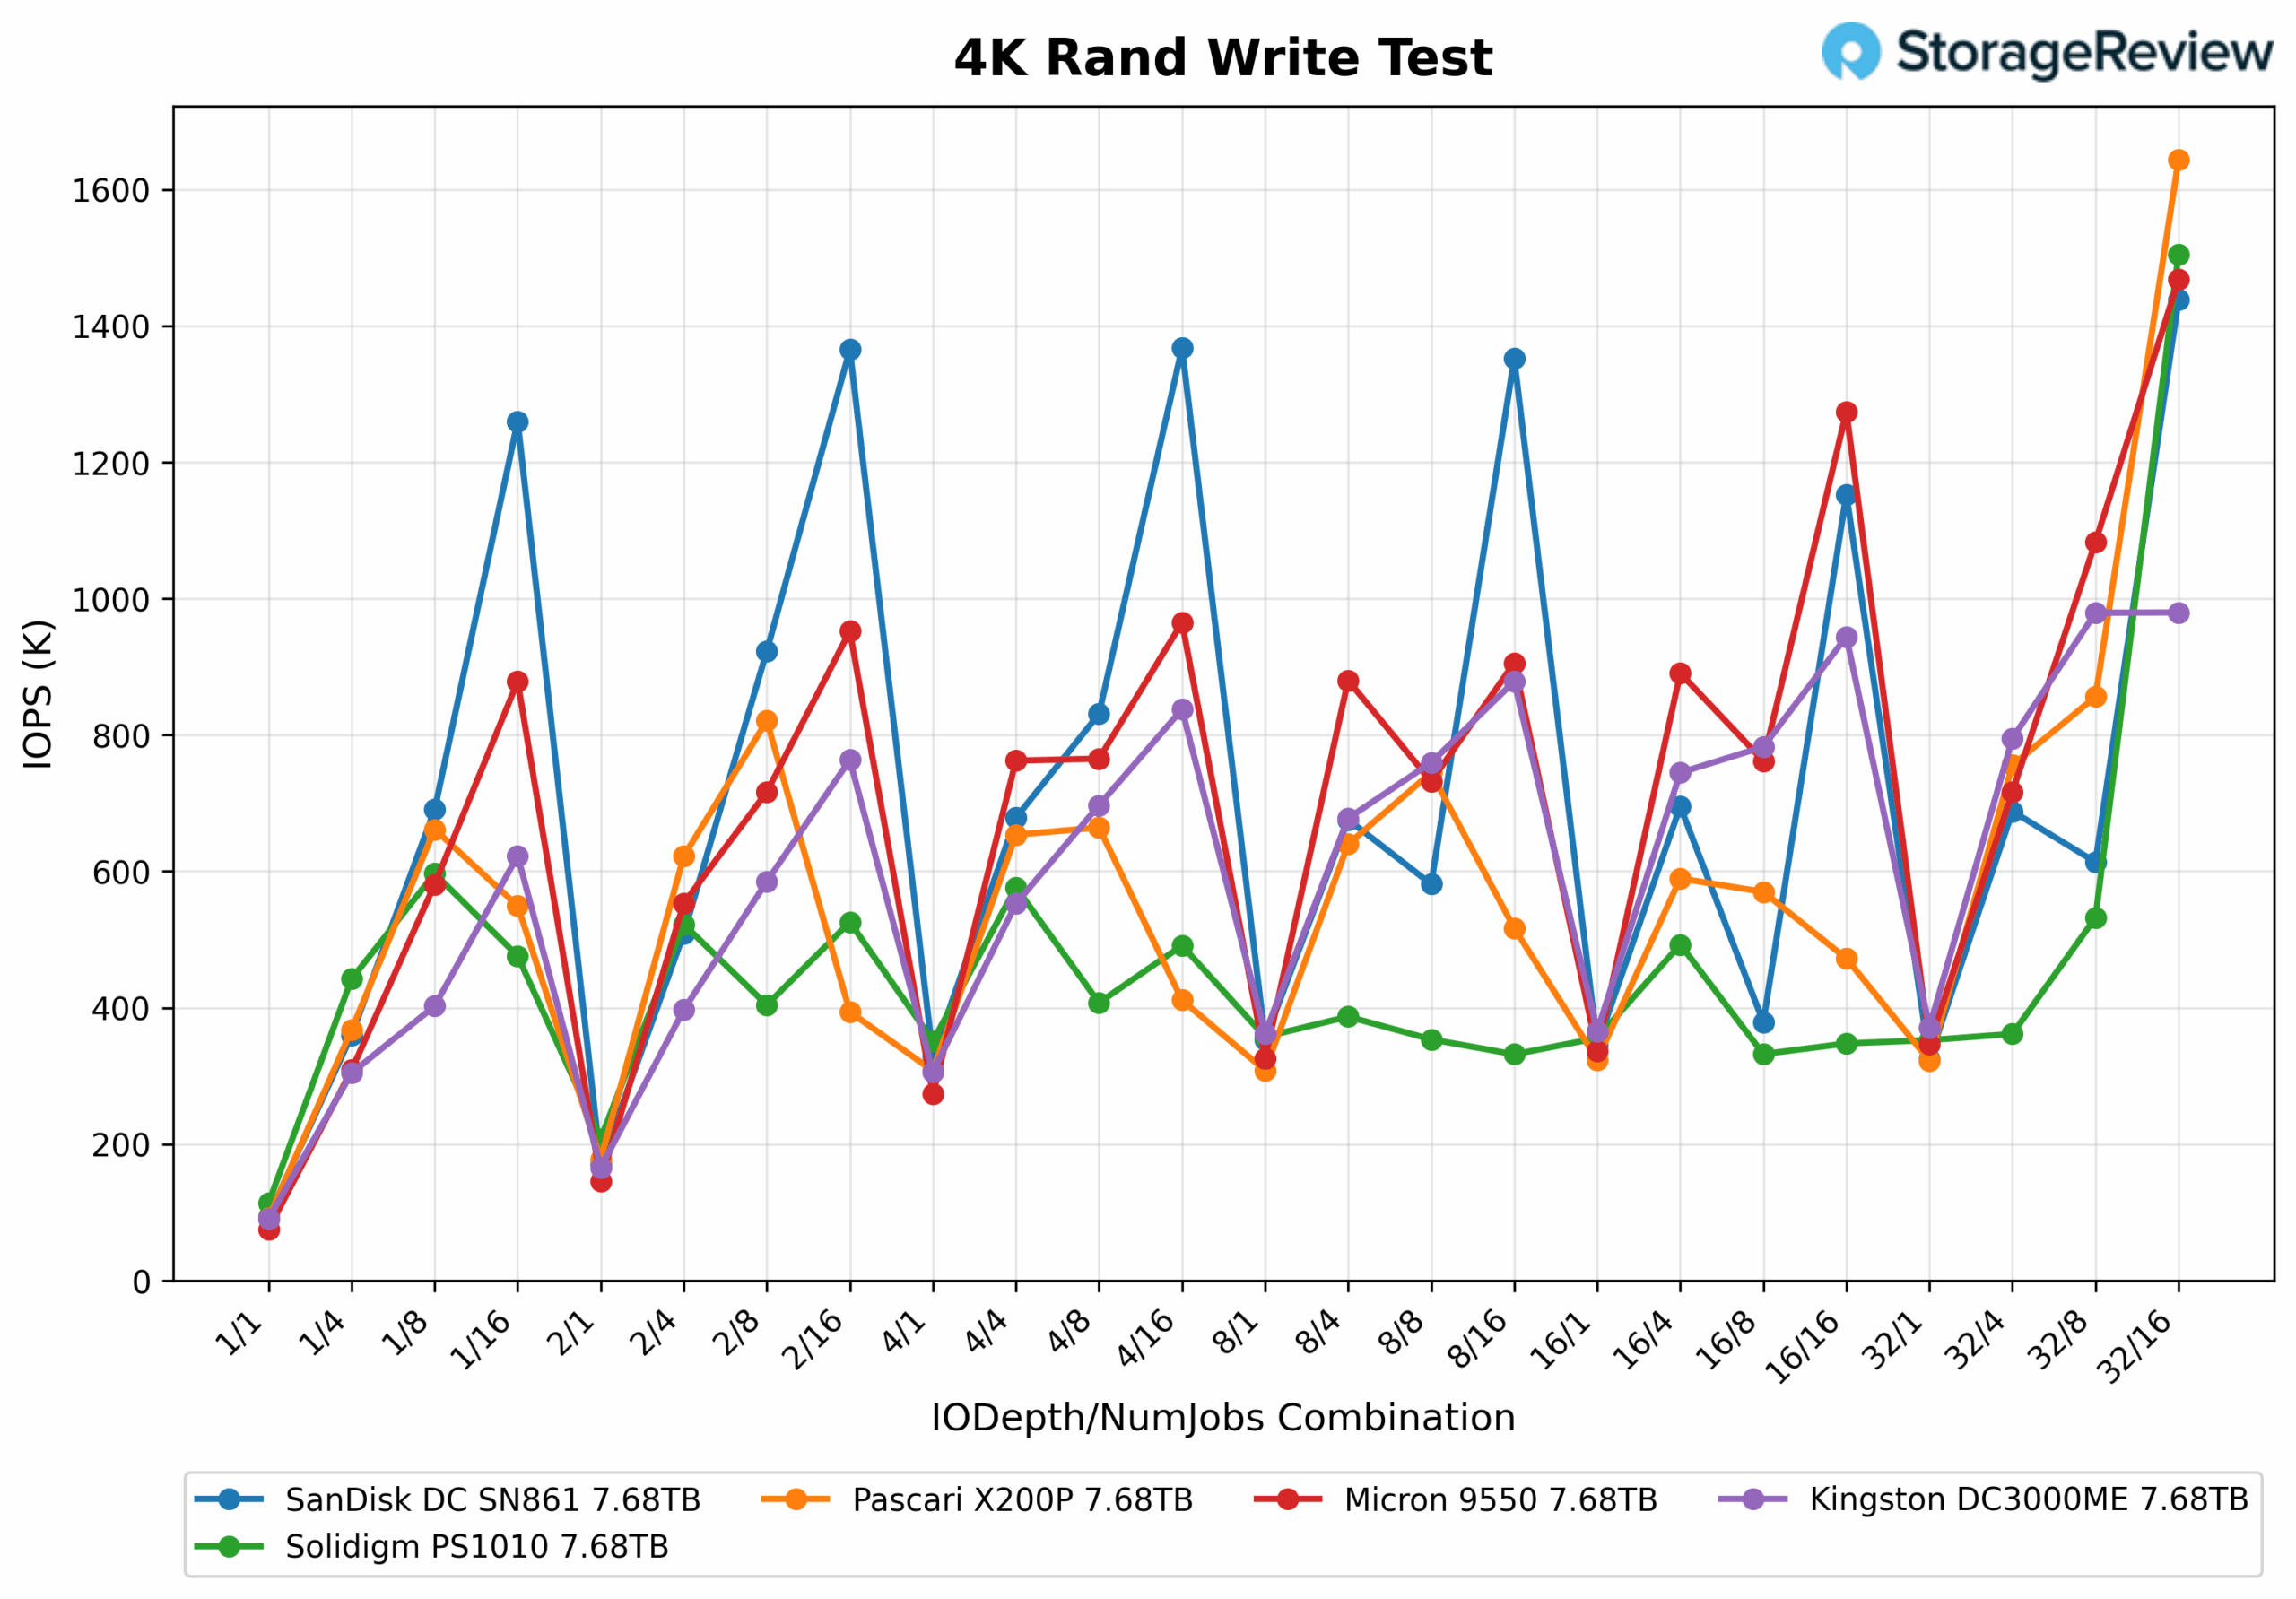
In our 4K random write testing, the X200P delivered steady results starting at depth/Jobs 1/1. The drive achieved 91.9K IOPS; it generally sat in the middle to low of the pack across most queue depths and thread combinations. Its peak throughput reached 1.64 million IOPS at 32/16, which was competitive but trailed the best results from SanDisk and Micron in certain spots.
4K Random Write Latency
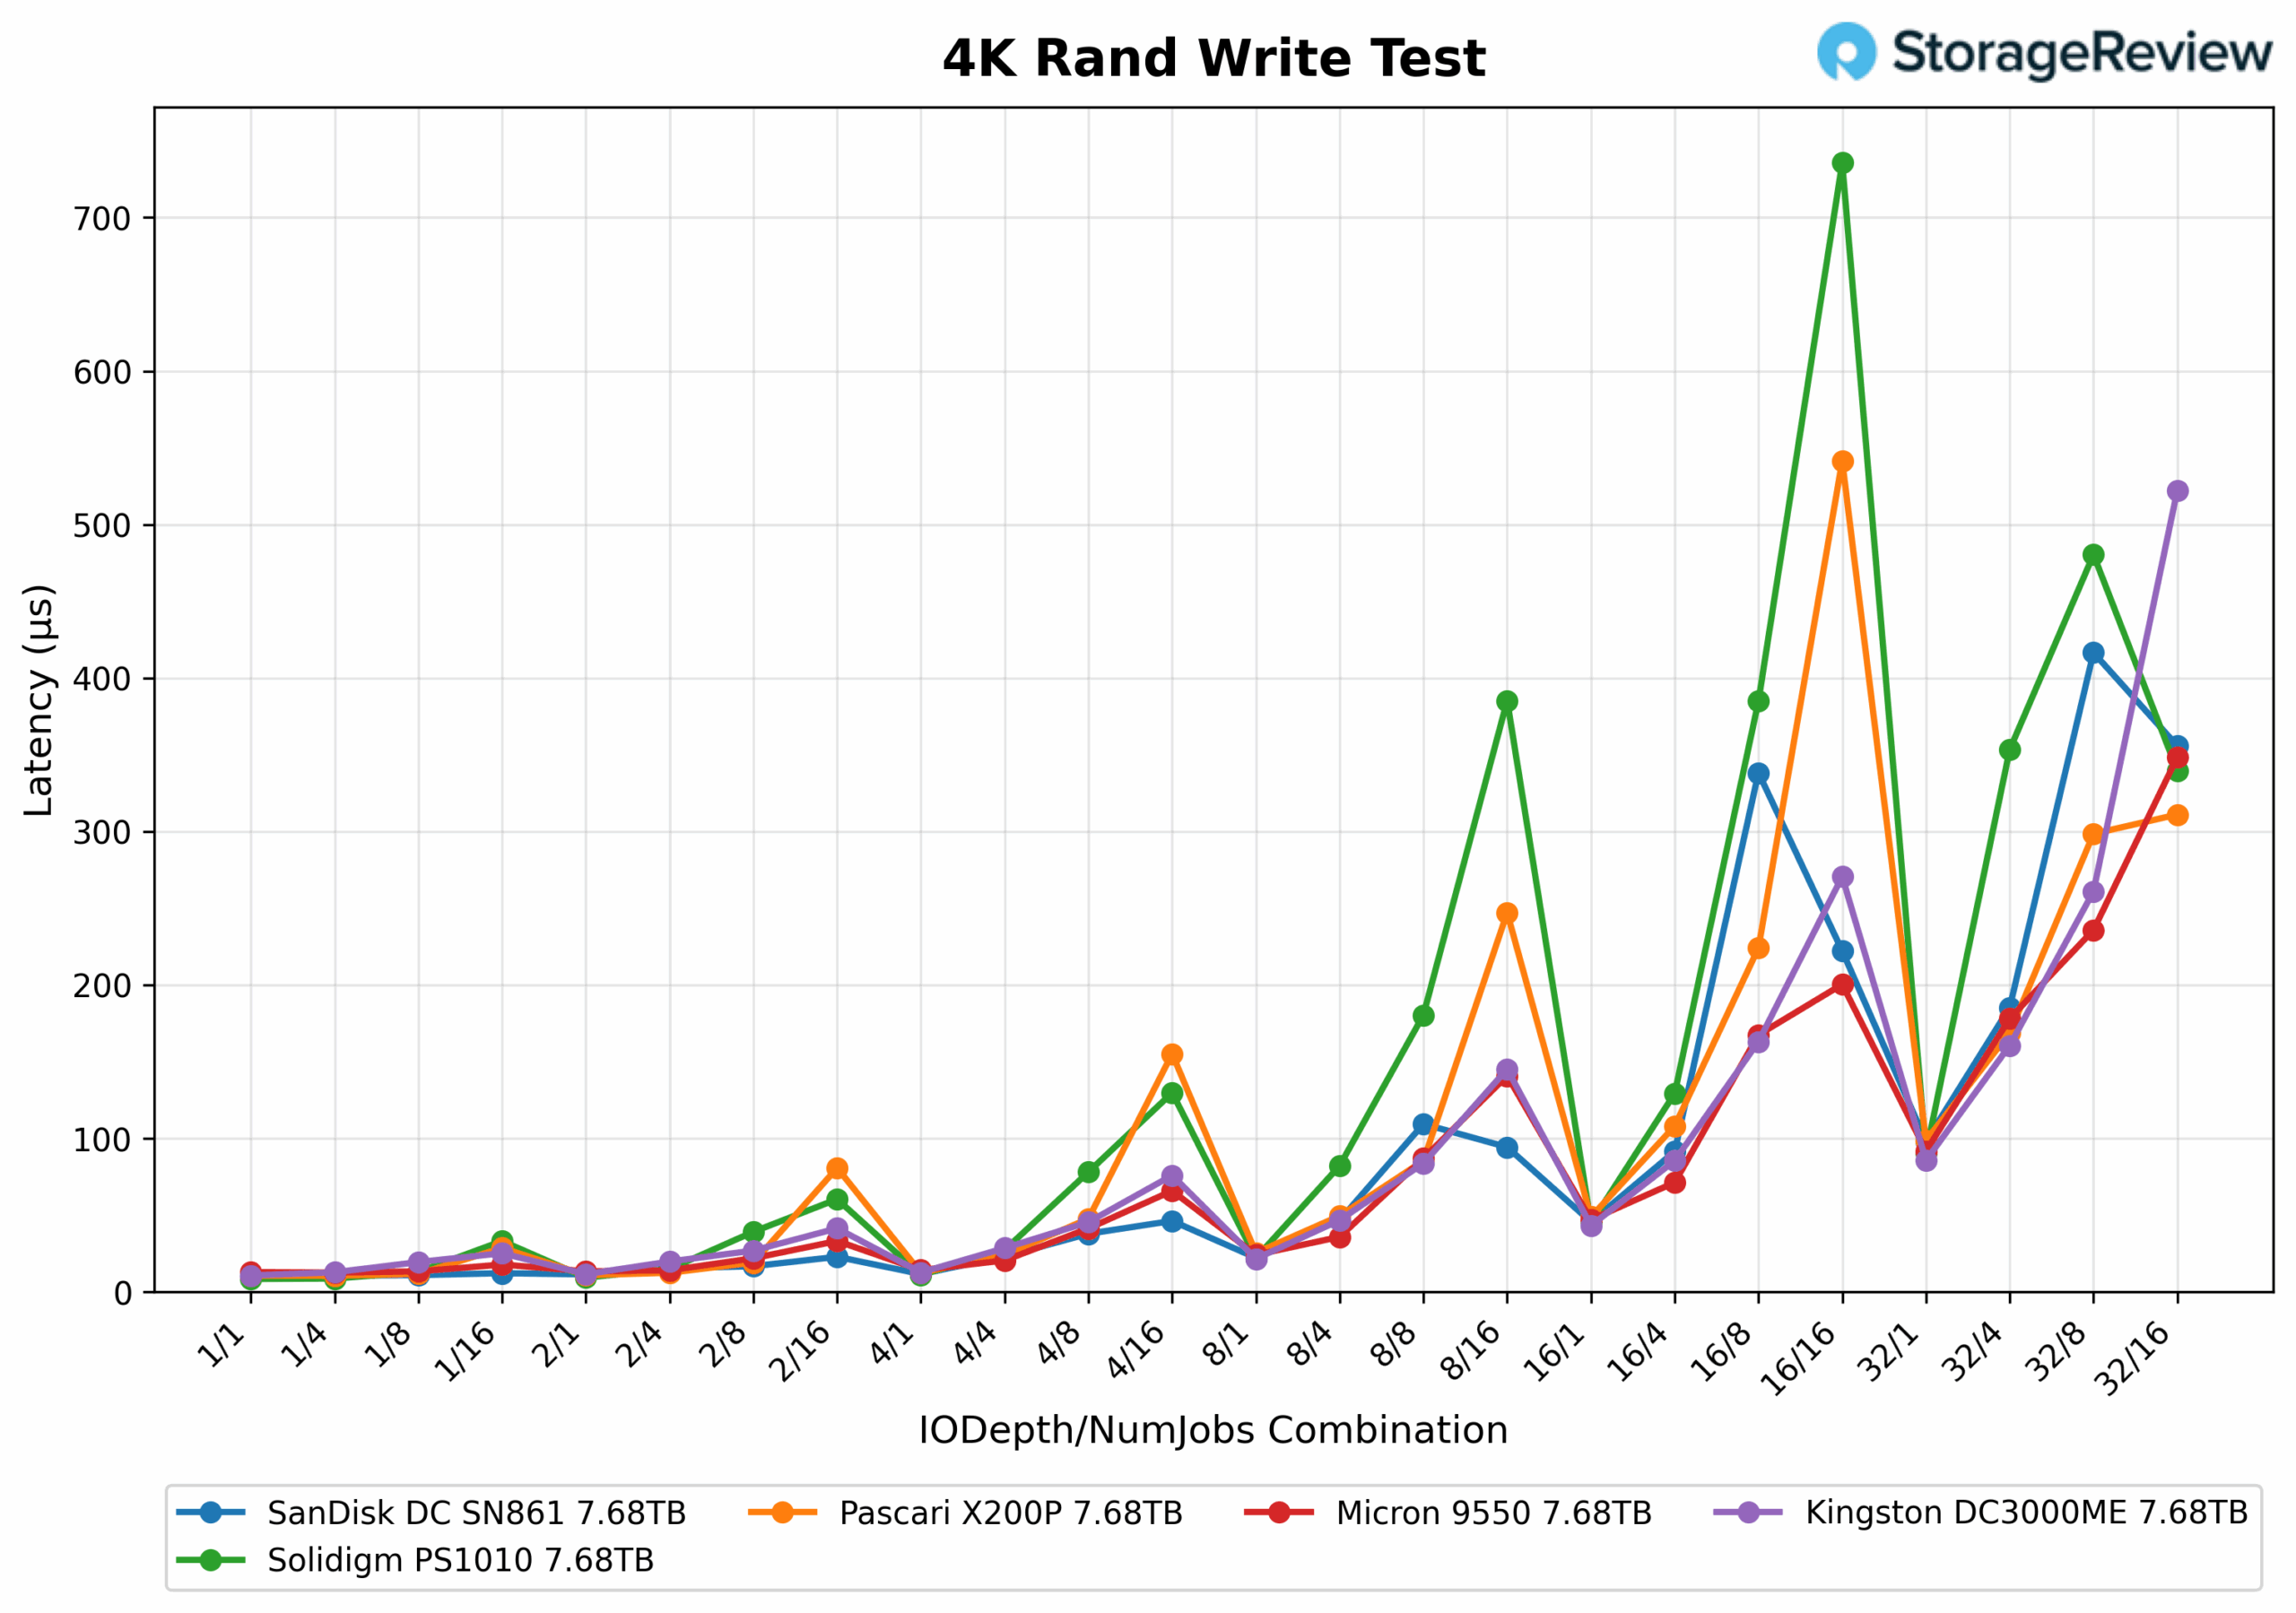
In 4K random write latency, the X200P performs well under light workloads, matching top drives at just 0.010ms. However, latency increased quickly with the heavier load, reaching 0.247ms at 8/16 and peaking at 0.541ms at 16/16, the second highest among the group.
4K Random Read
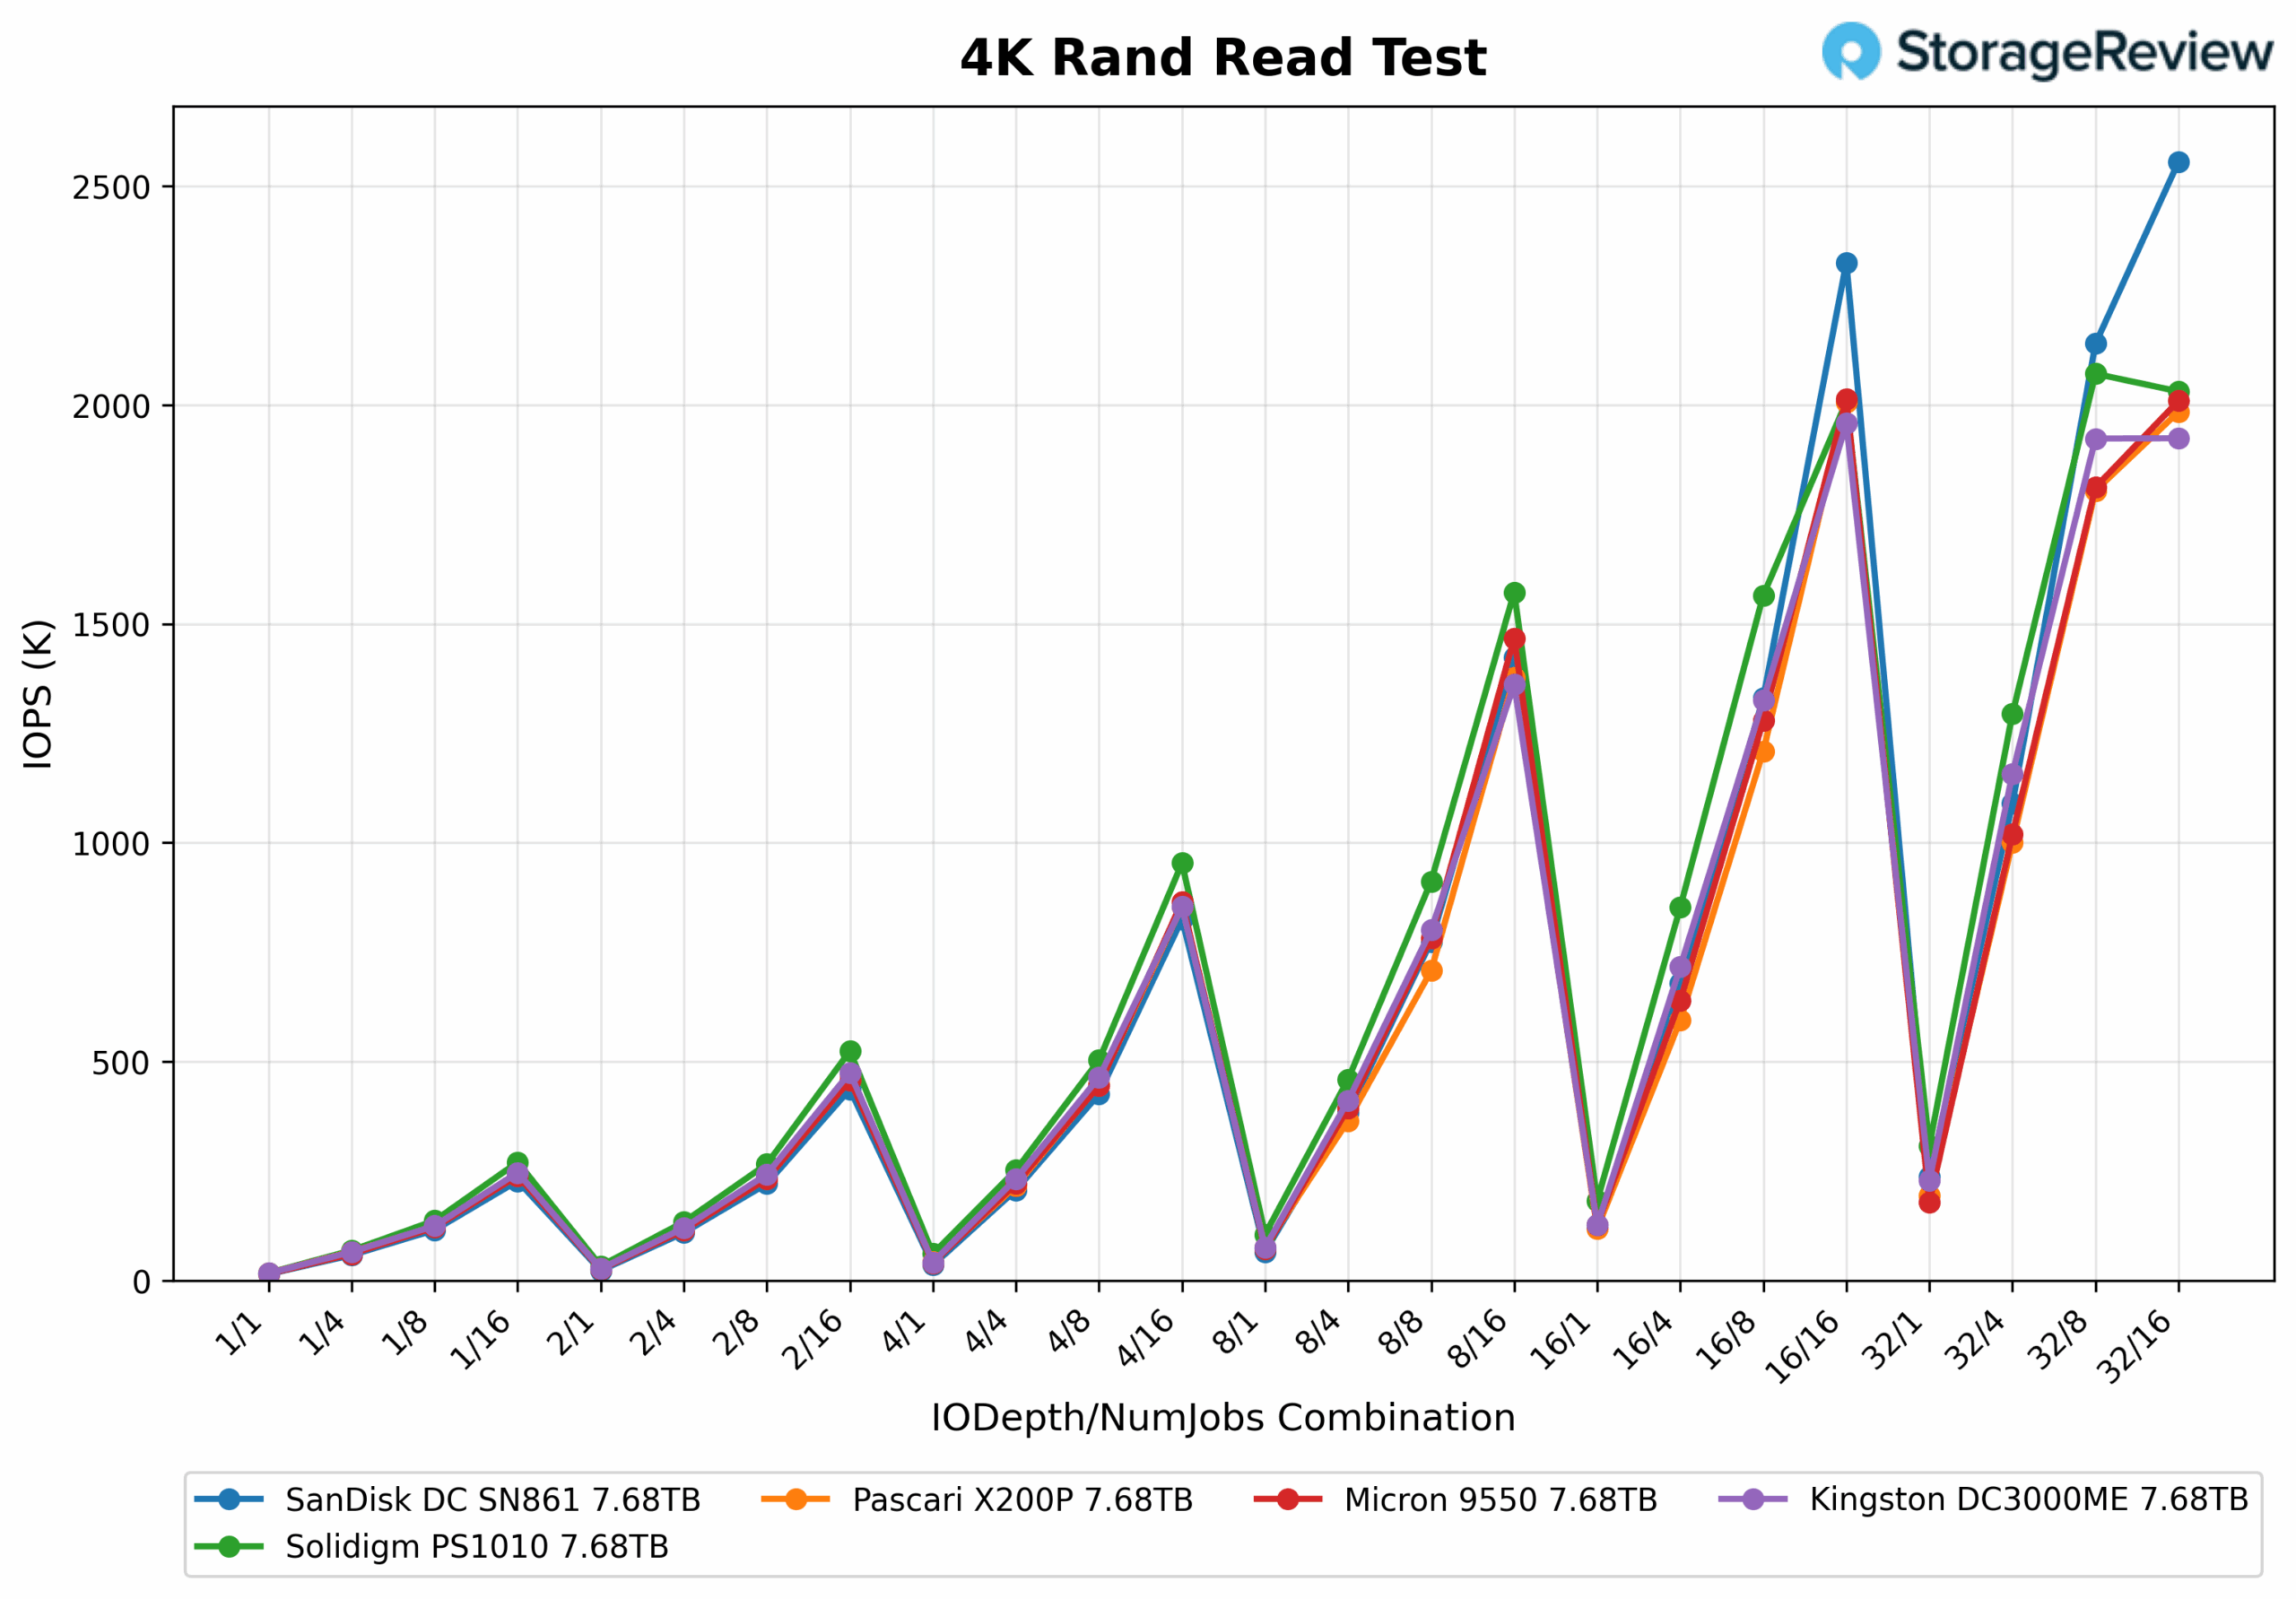
In the 4K random read performance curve, the X200P starts at the lower end with 16.6K IOPS at 1/1, but scales predictably through the mid-range, recording 365K IOPS at 8/4 and 707K IOPS at 8/8. It demonstrates steady acceleration into higher queue depths, reaching 1.2M IOPS at 16/8 and continuing to 2M IOPS at 16/16. Notably, Pascari sits just below Kingston at 32/16 with 1.98M IOPS, placing it in the middle of the pack. The drive maintains strong upward momentum starting around 8/16, steadily climbing into the million-IOPS tier and delivering consistent performance through the most demanding workloads
4K Random Read Latency
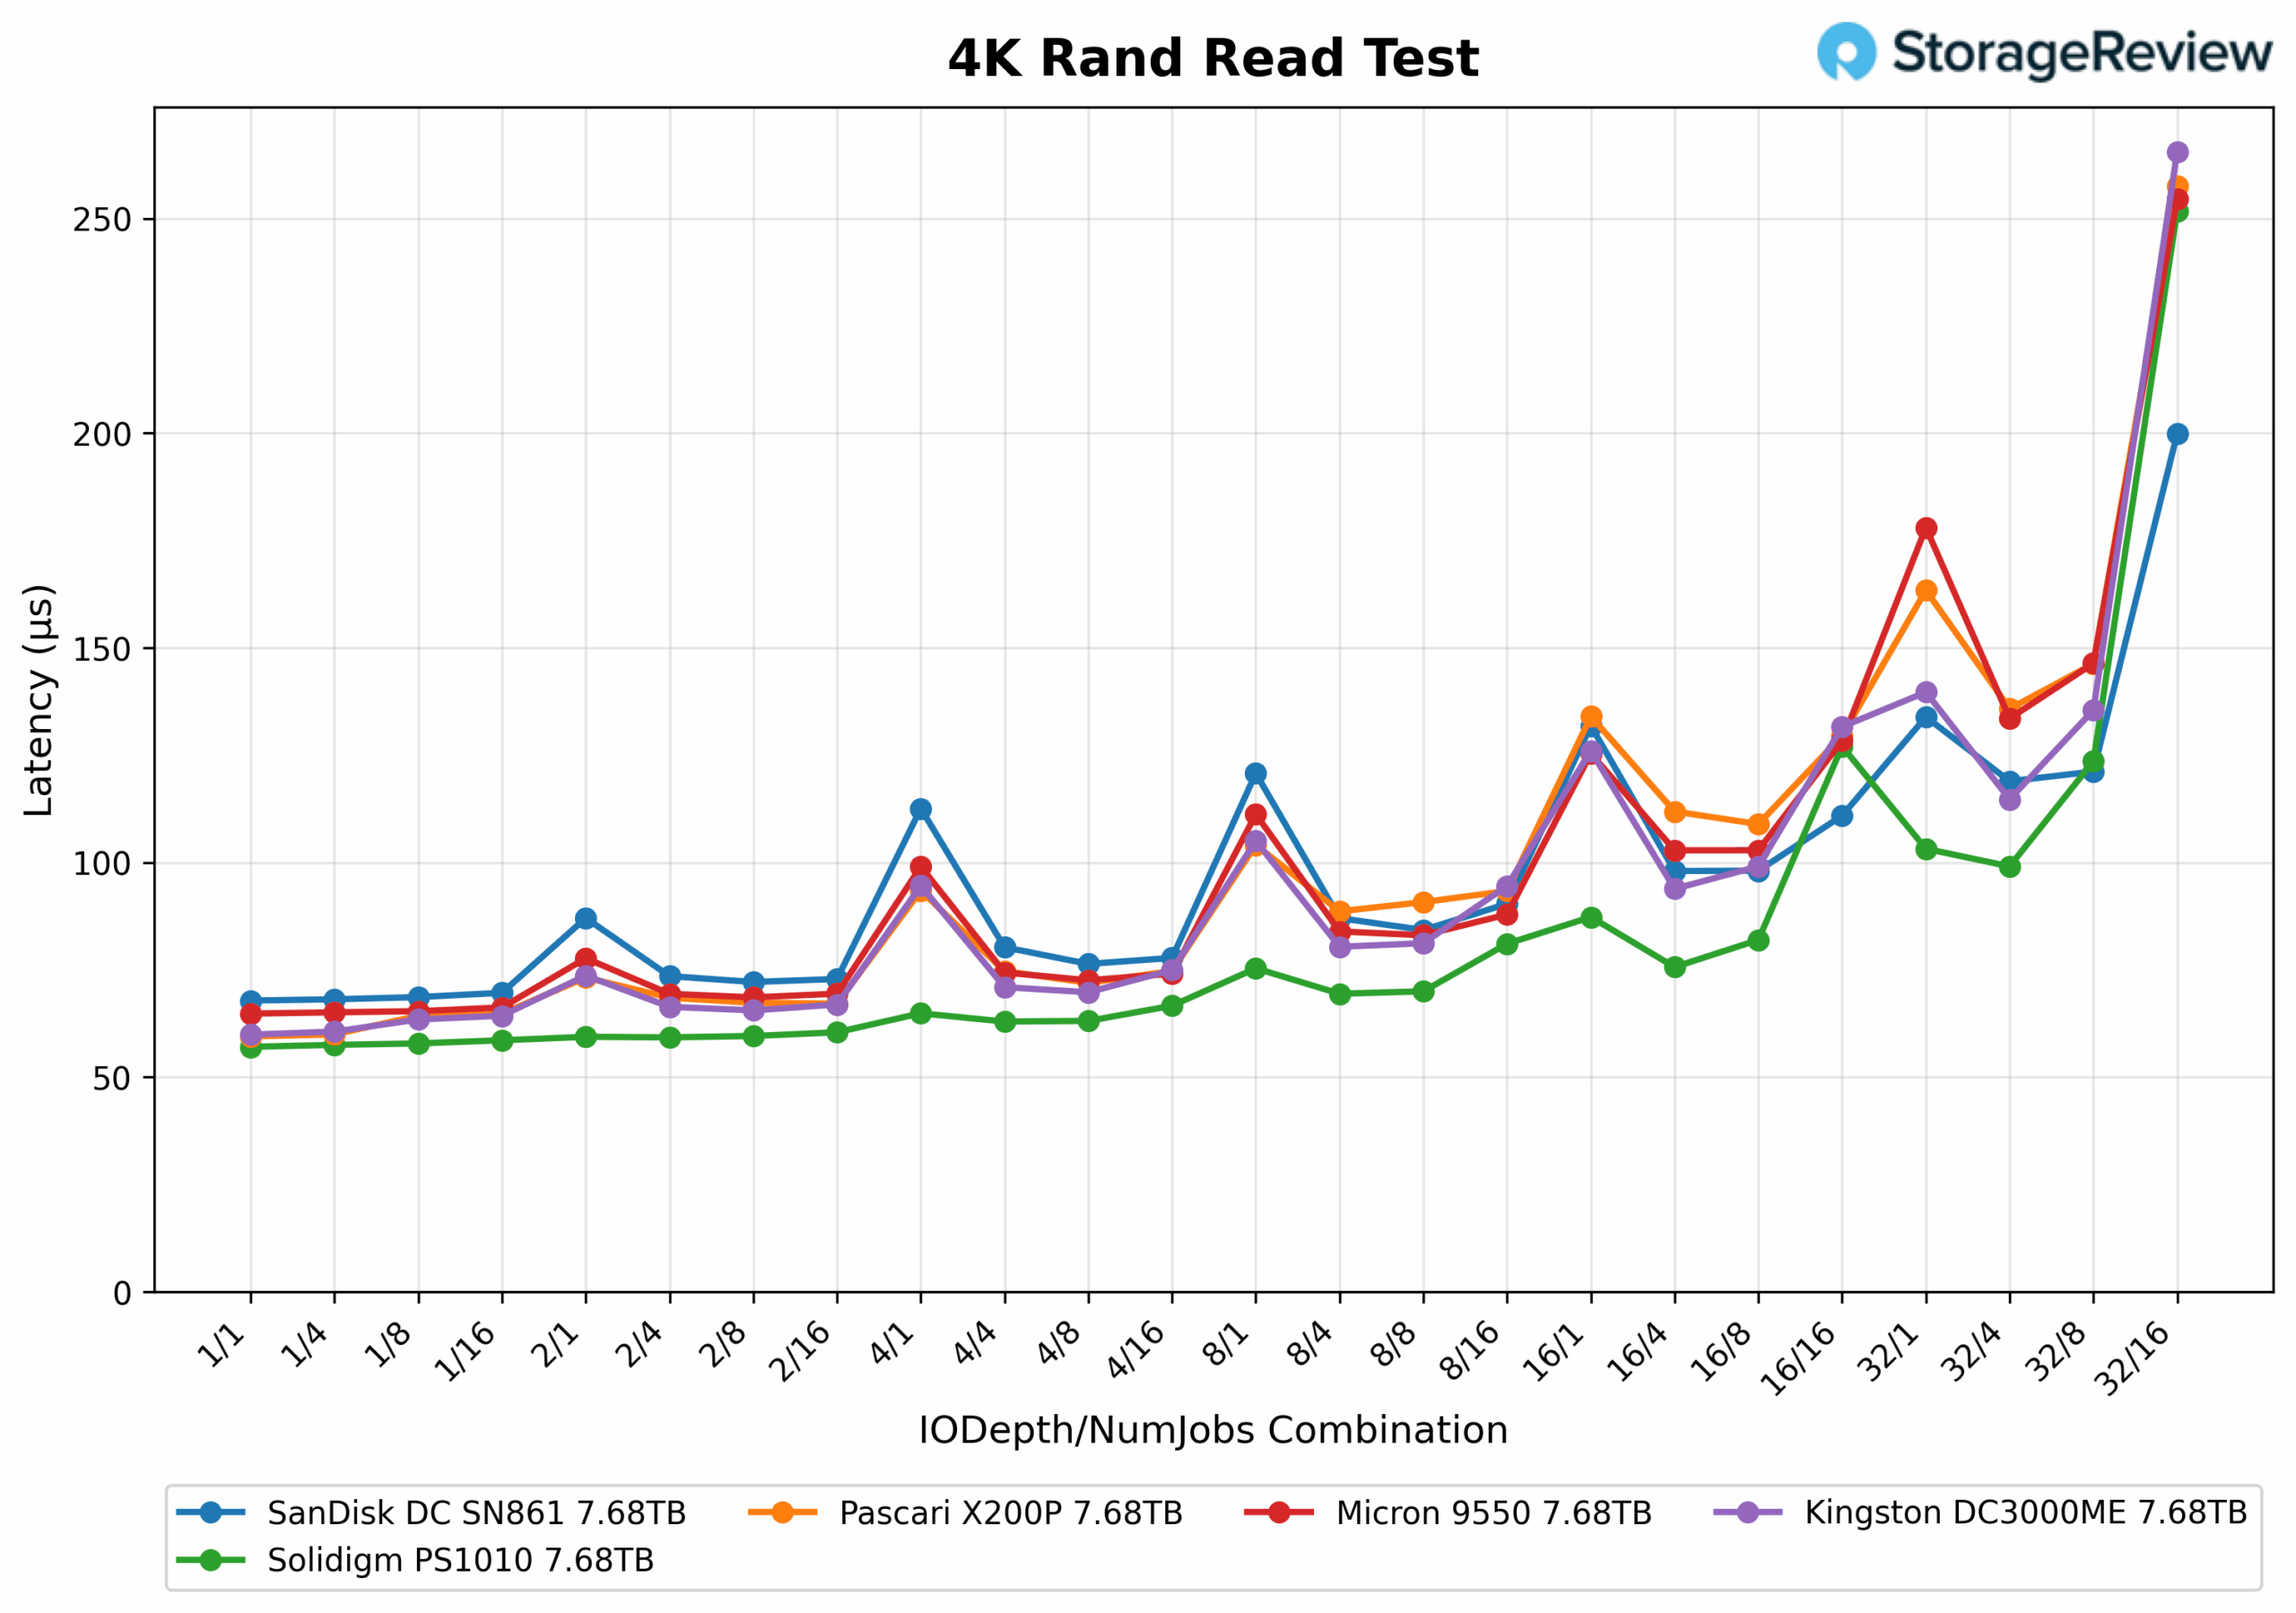
In the 4K Random Read Latency test, X200P maintains competitive performance throughout the workload curve. It starts at just 0.059ms at 1/1 and continues efficiently with 0.060ms at 1/4, 0.064ms at 1/8, and 0.067ms at 2/8. As queue depths increase, Pascari stays in line with other enterprise drives, recording 0.075ms at 4/4, 0.089ms at 8/4, and 0.109ms at 16/8. At heavier workloads, like 32/4, it reached 0.136ms, and 0.163ms at 32/1. The peak latency arrives at 32/16 with 0.258ms, slightly above Solidigm but similar to and between Kingston and Micron.
GPU Direct Storage
One of the tests we conducted on this testbench was the Magnum IO GPU Direct Storage (GDS) test. GDS is a feature developed by NVIDIA that allows GPUs to bypass the CPU when accessing data stored on NVMe drives or other high-speed storage devices. Instead of routing data through the CPU and system memory, GDS enables direct communication between the GPU and the storage device, significantly reducing latency and improving data throughput.
How GPU Direct Storage Works
Traditionally, when a GPU processes data stored on an NVMe drive, the data must first travel through the CPU and system memory before reaching the GPU. This process introduces bottlenecks, as the CPU becomes a middleman, adding latency and consuming valuable system resources. GPU Direct Storage eliminates this inefficiency by enabling the GPU to access data directly from the storage device via the PCIe bus. This direct path reduces the overhead associated with data movement, allowing faster and more efficient data transfers.
AI workloads, especially those involving deep learning, are highly data-intensive. Training large neural networks requires processing terabytes of data, and any delay in data transfer can lead to underutilized GPUs and longer training times. GPU Direct Storage addresses this challenge by ensuring that data is delivered to the GPU as quickly as possible, minimizing idle time and maximizing computational efficiency.
In addition, GDS is particularly beneficial for workloads that involve streaming large datasets, such as video processing, natural language processing, or real-time inference. By reducing the reliance on the CPU, GDS accelerates data movement and frees up CPU resources for other tasks, further enhancing overall system performance.
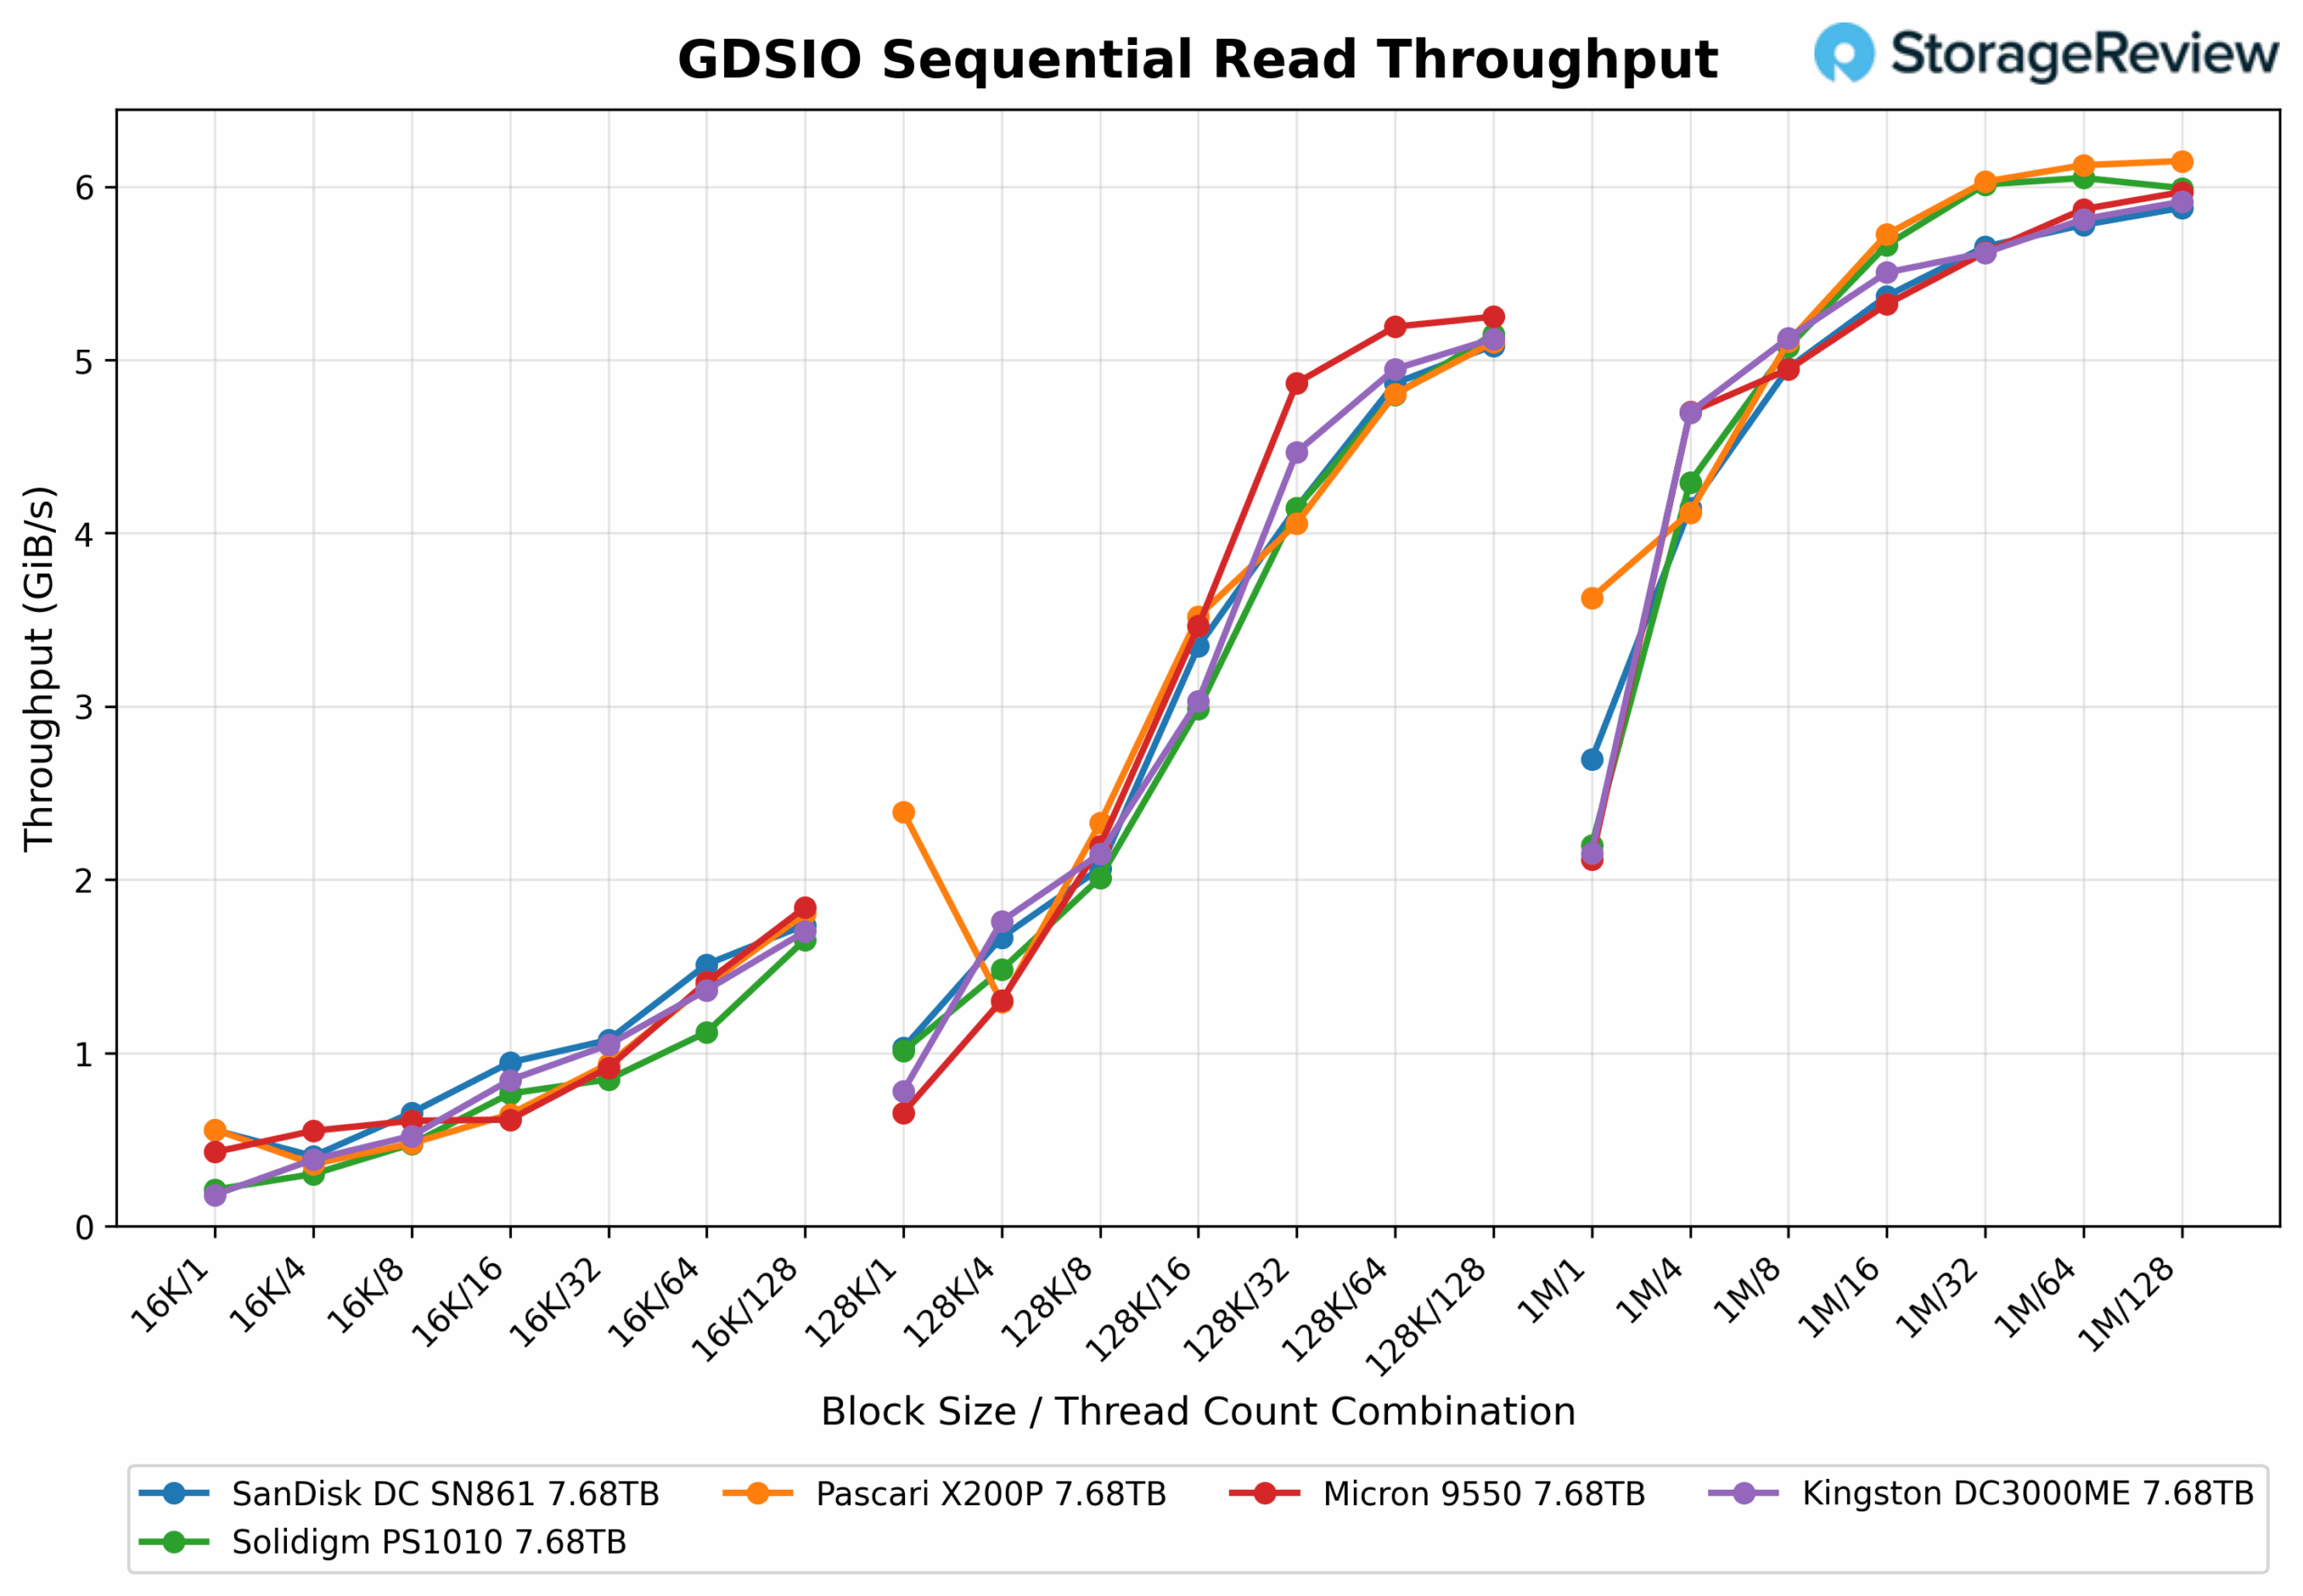
Throughput starts at 0.56 GiB/s (QD1) and increases to 1.80 GiB/s at QD128. Scaling is modest but steady, reflecting acceptable performance at smaller transfer sizes.
Performance improves noticeably, increasing from 2.39GiB/s at QD1 to 5.10GiB/s at QD128. This illustrates better scaling efficiency and more substantial utilization as the drive handles larger reads.
Throughput starts at 3.63GiB/s and scales up to 6.15GiB/s at QD128. Gains are less dramatic here, but the drive delivers its highest absolute read bandwidth in this range, making it well-suited for large sequential transfers.
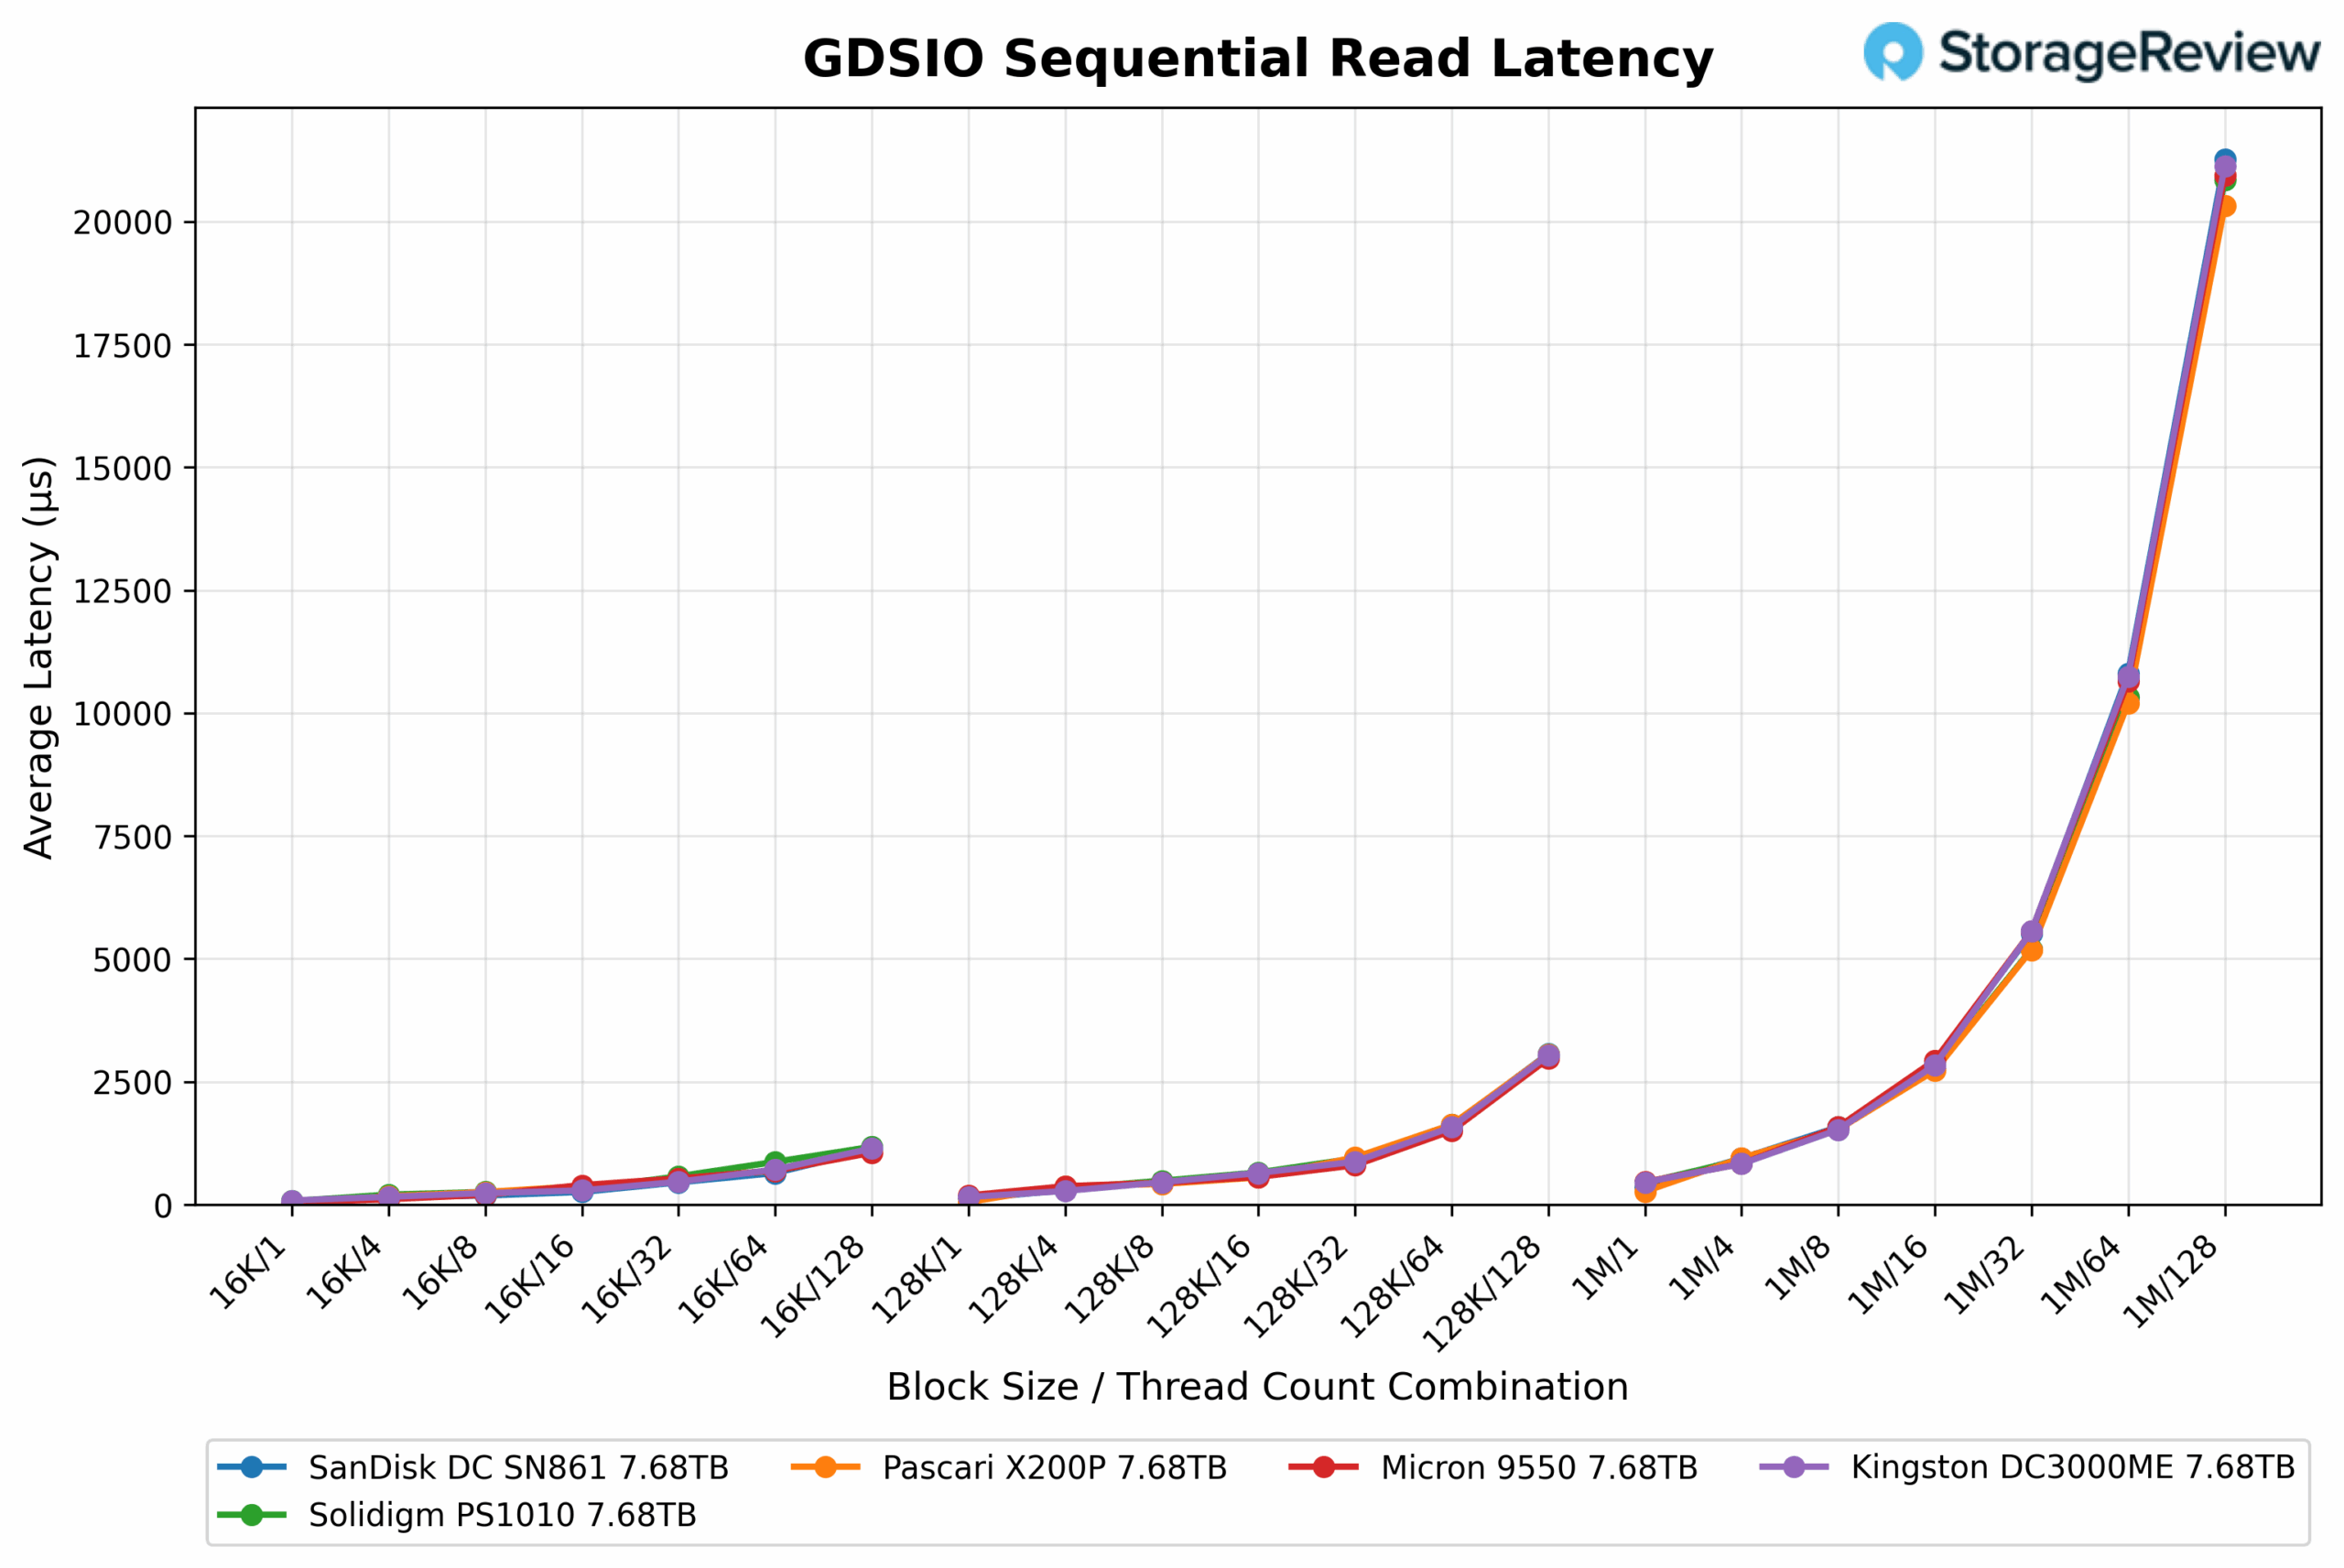
The GDSIO read latency results for the Pascari X200P highlight a clear relationship between block size, thread count, and latency. At a smaller 16K block size with a single thread, the drive achieves an average latency of just 0.026ms. However, when scaled to 128 threads at the same block size, latency increases significantly to 1.076ms. With 128K blocks, latency is 0.050ms at one thread and rises to 3.056ms with 128 threads. For larger 1M blocks, the latency begins at 0.268ms with a single thread and spikes to 20.324ms under maximum parallelism.
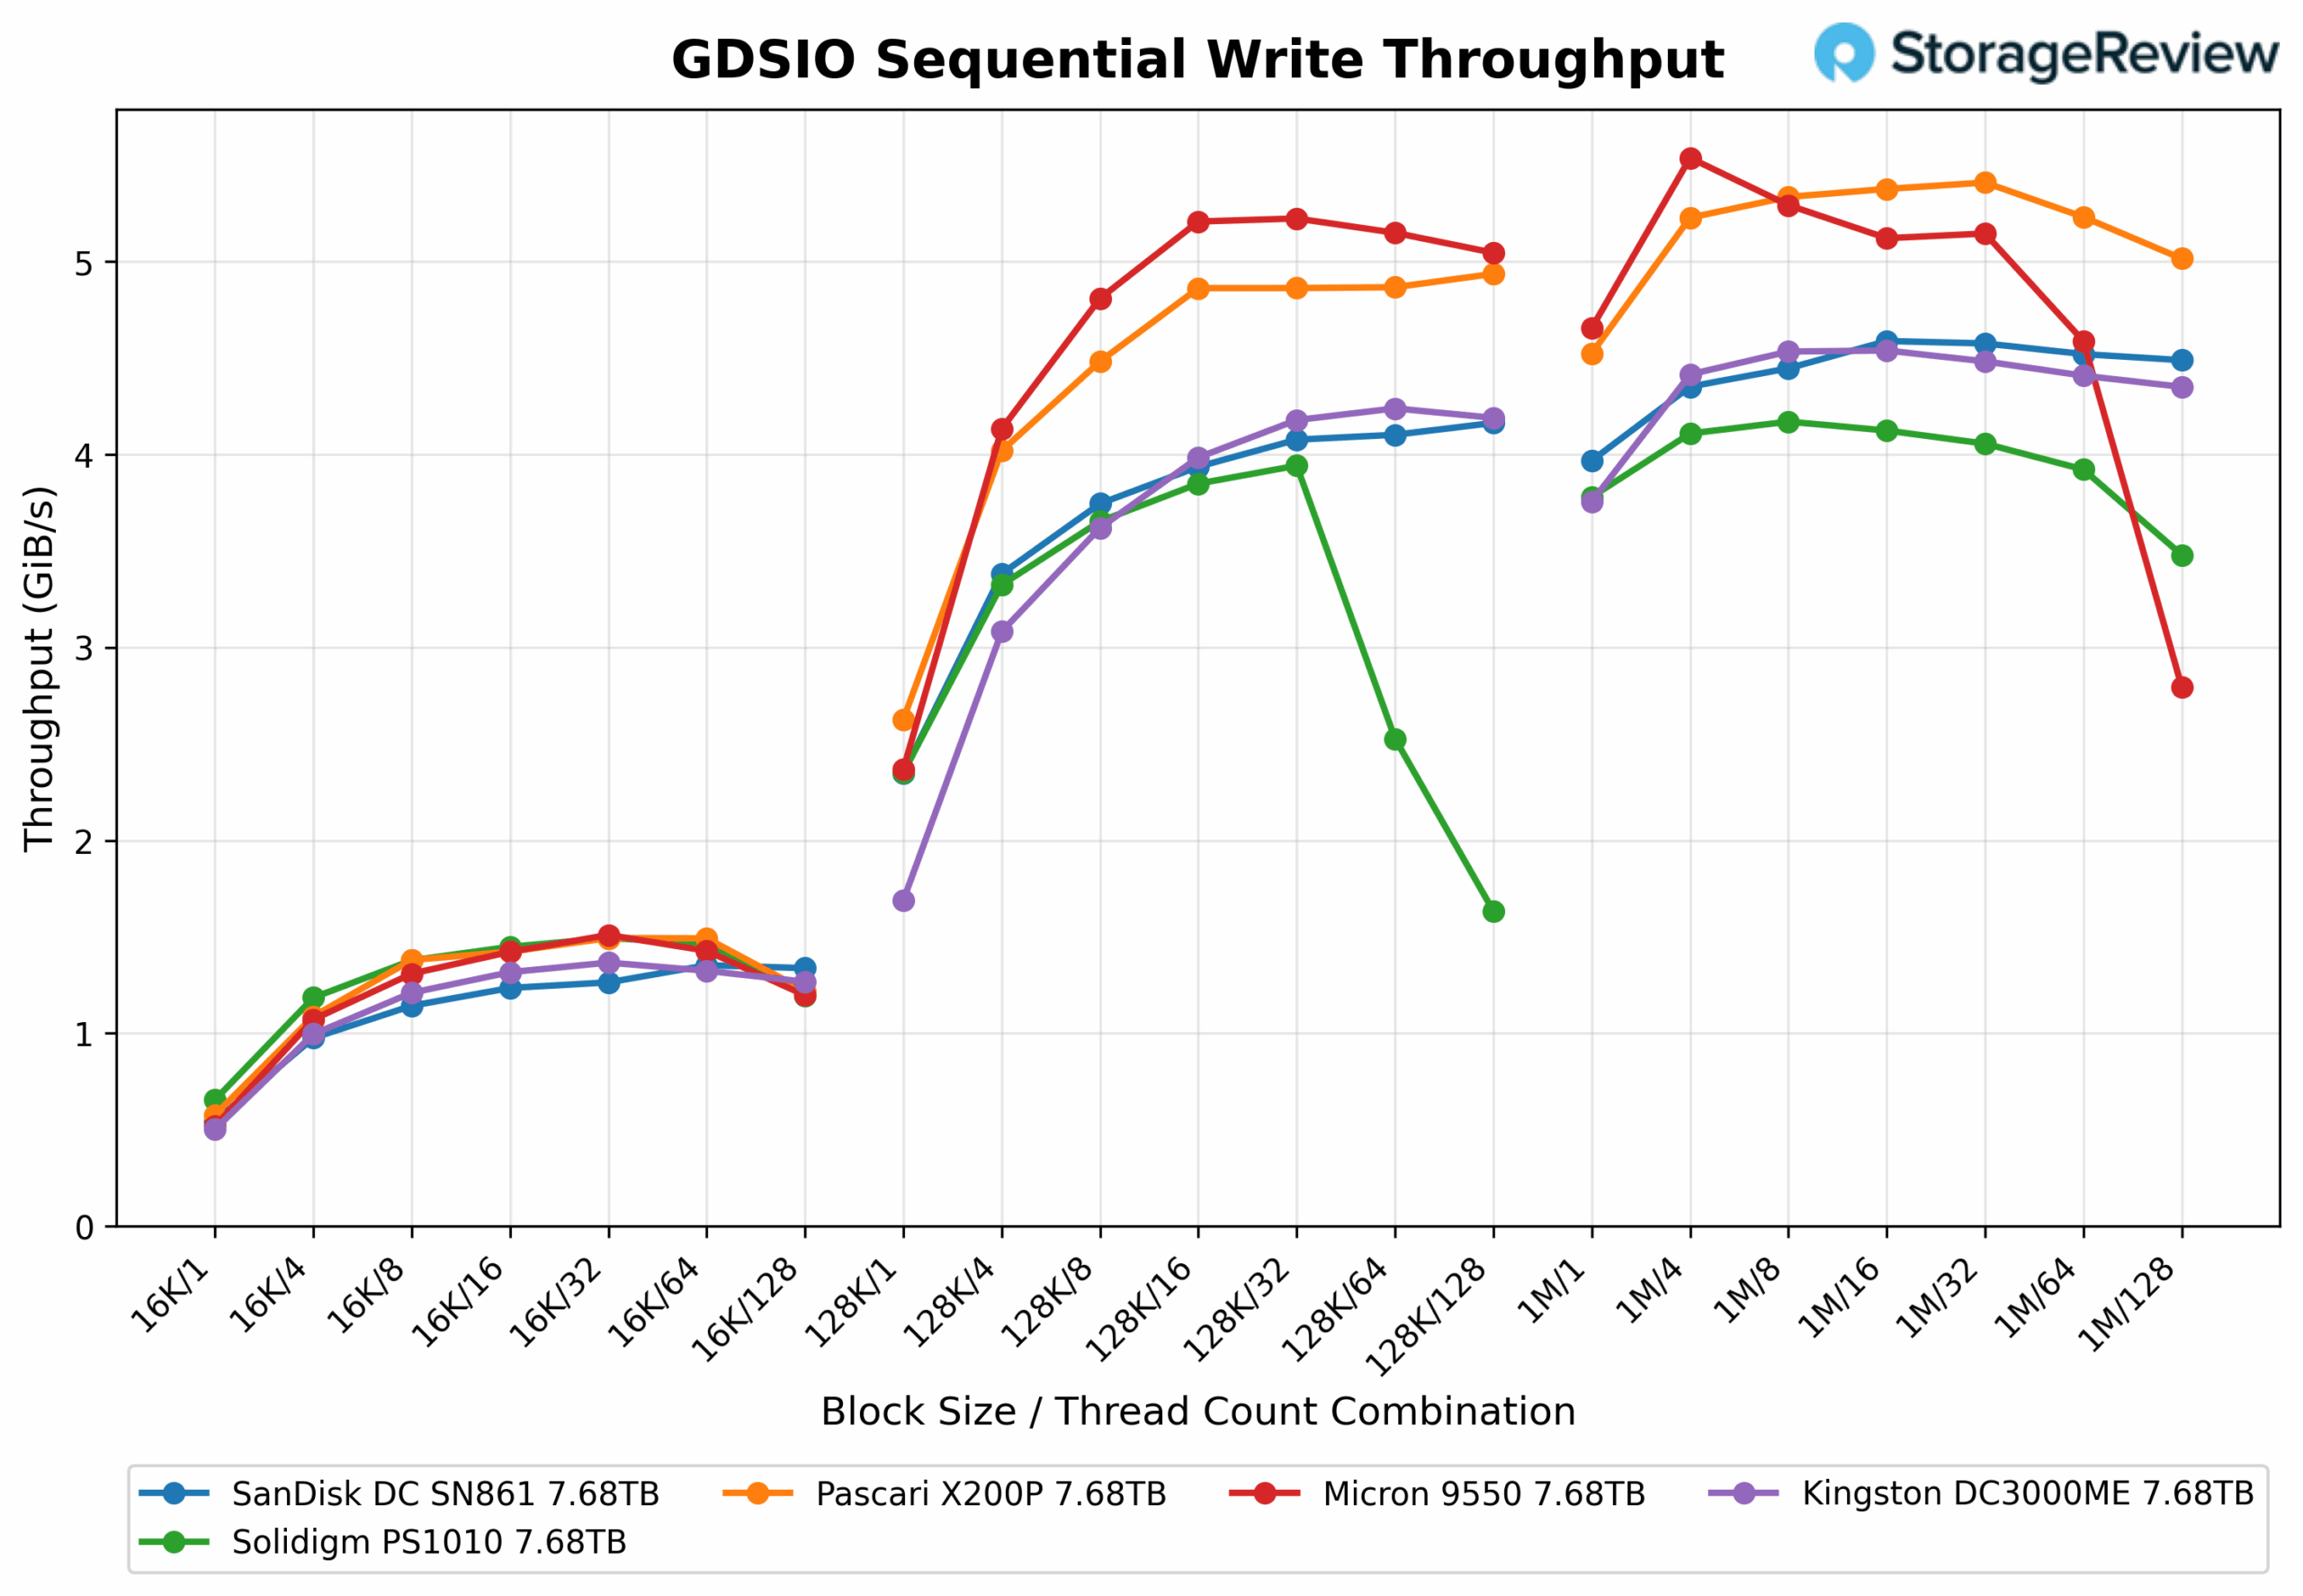
At 16K block size, X200P throughput starts at 0.58GiB/s (25.17µs latency) at QD1 and rises to 1.22GiB/s (1.59ms latency) at QD128. This represents a modest gain in bandwidth, but with a steep increase in latency, suggesting early saturation at this small I/O size.
At 128K, performance scales better, starting at 2.63GiB/s (45.55µs) and increasing to 4.94GiB/s (3.16ms) at QD128. This represents a healthy increase in throughput, but again, latency scales sharply, indicating a growing overhead under high queue depth conditions.
At a 1M block size, the drive starts strong at 4.52GiB/s (215µs) and peaks at 5.02GiB/s (24.9ms) at QD128. The throughput gain is minimal compared to 128K, and latency at QD128 becomes the highest of all tests, signaling limited efficiency gains from larger transfers beyond 128K at deep queues.
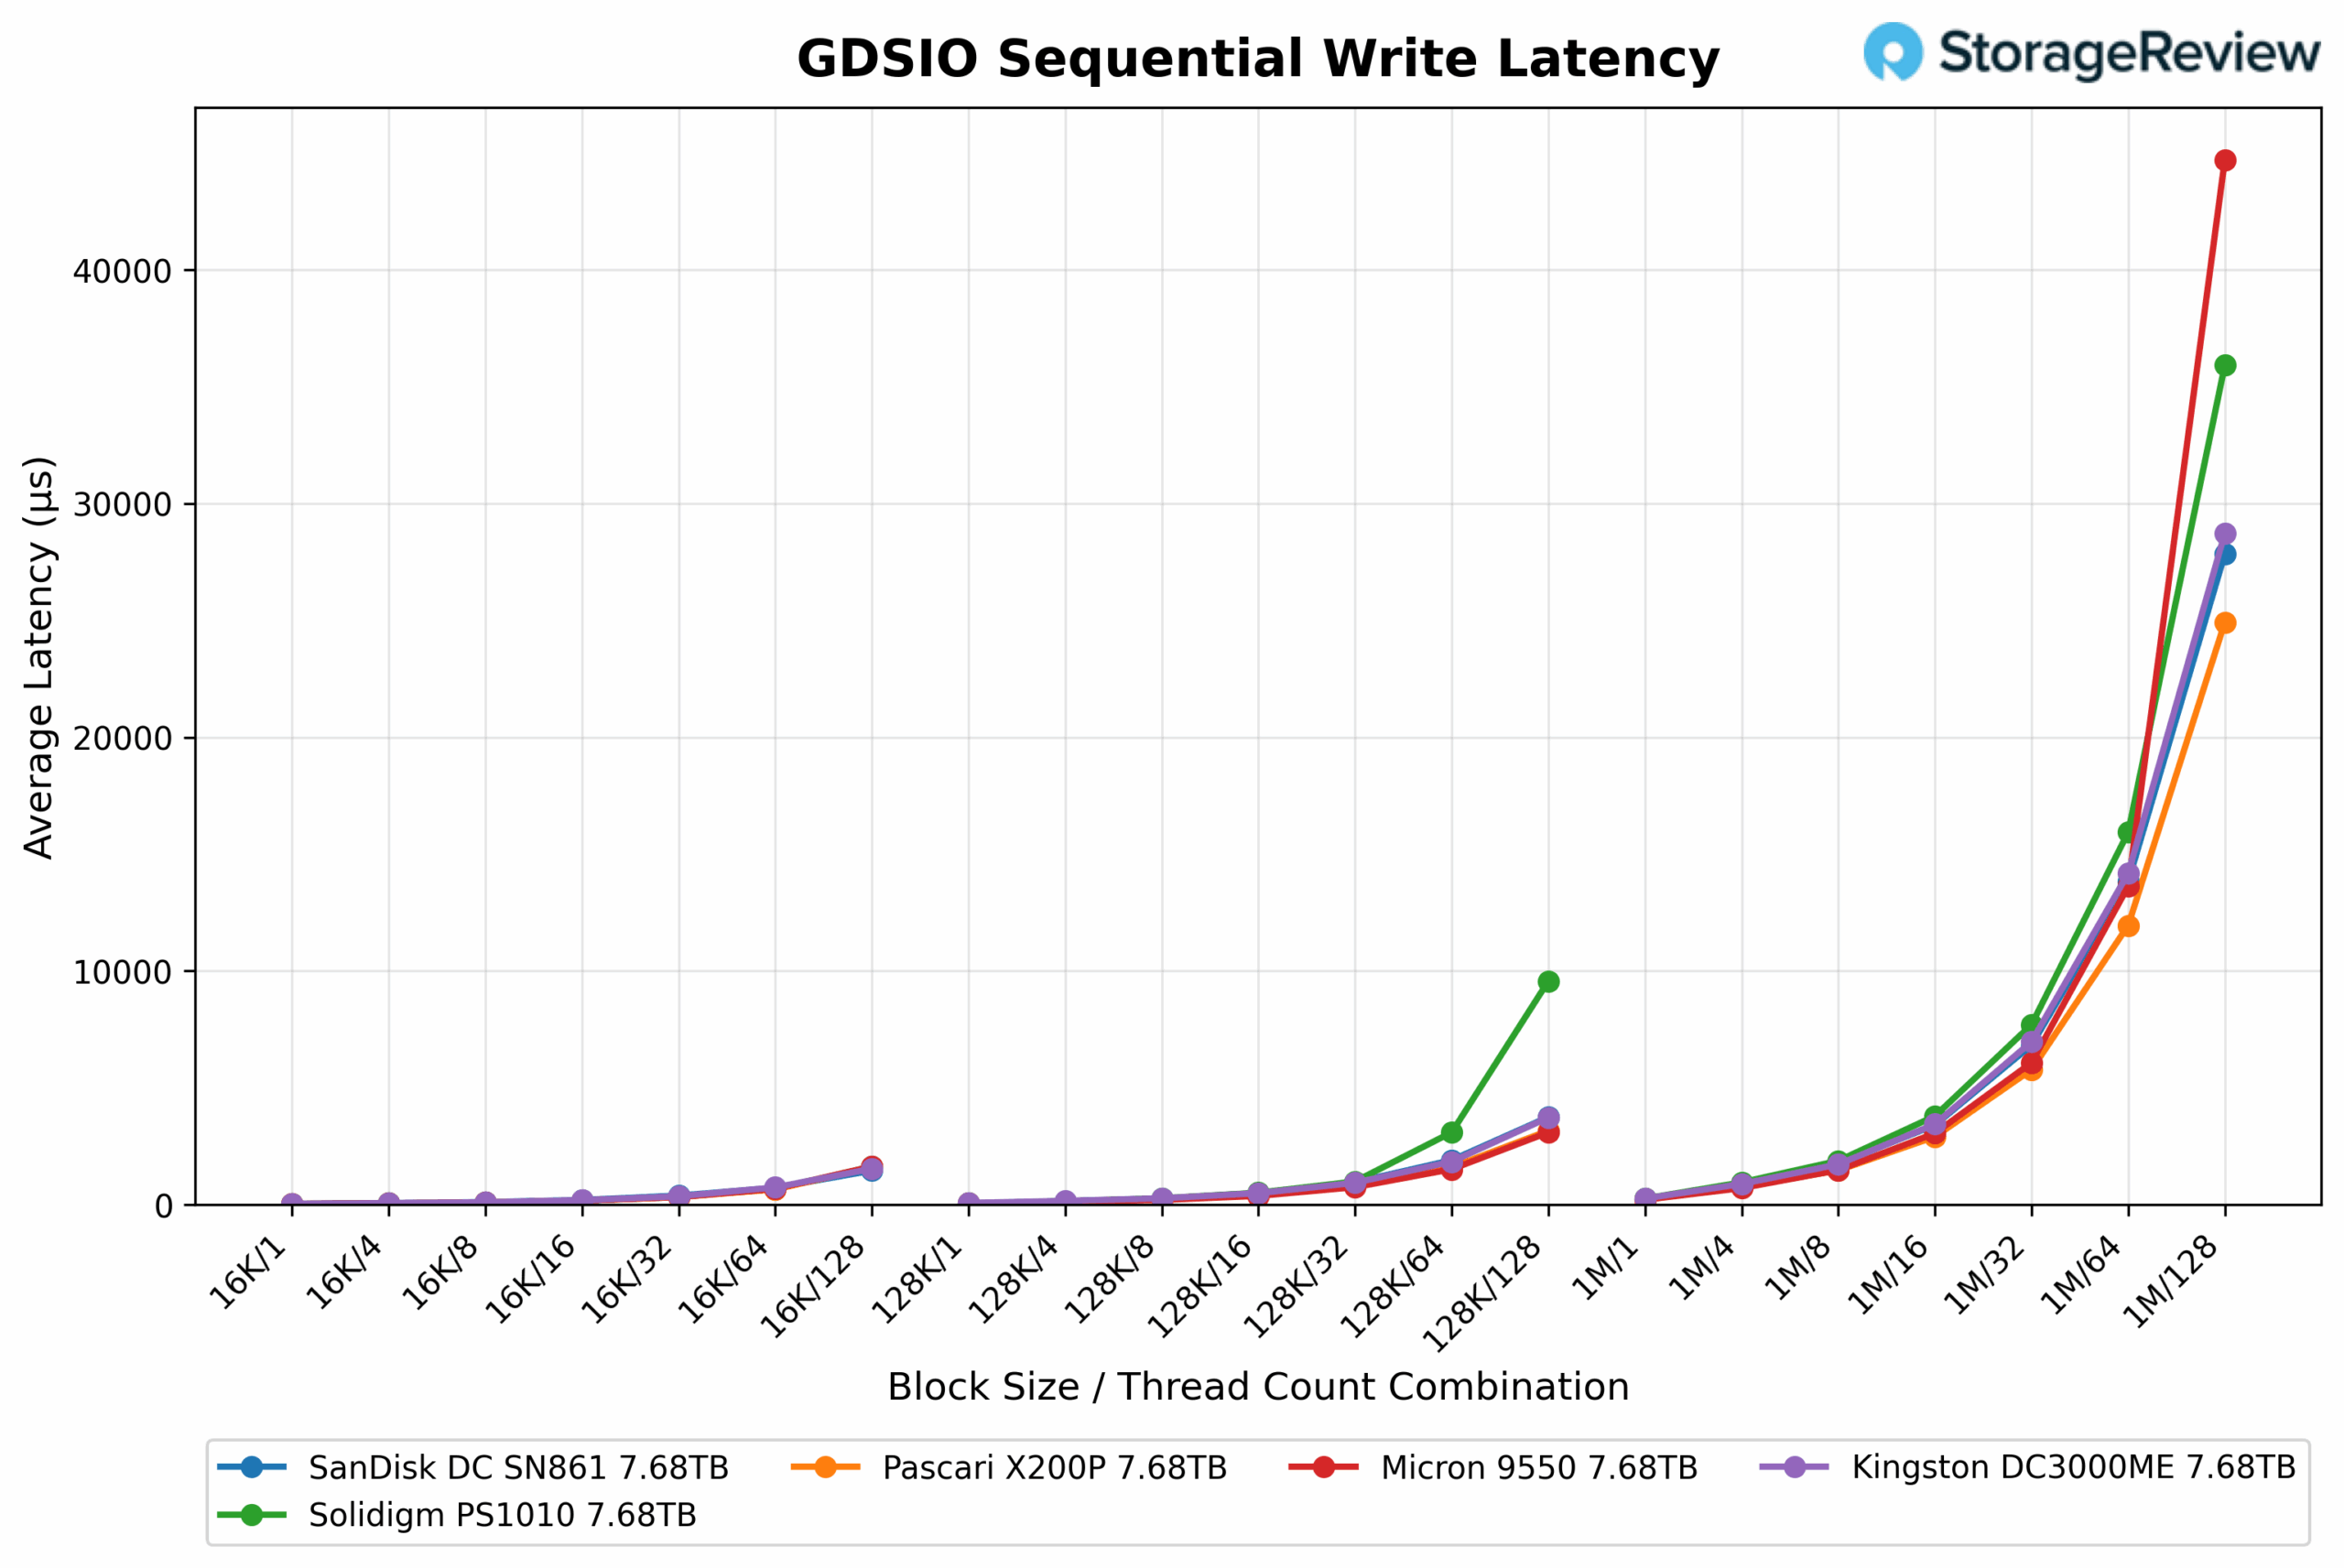
The GDSIO write latency results for the Pascari X200P show a consistent scaling pattern, with latency increasing as block size and thread count rise. At a 16K block size with a single thread, the drive posts an average latency of 0.025ms, climbing to 1.595ms at 128 threads. With 128K blocks, latency moves from 0.046ms to 3.159ms under the same conditions. At the largest 1M block size, latency starts at 0.215ms and reaches 24.917ms at maximum thread depth. Despite the expected rise in latency, the Pascari X200P leads the group at higher block sizes and thread counts, maintaining the lowest latency under heavy parallel write workloads.
Conclusion
The Phison Pascari X200P 7.68TB SSD is an enterprise-grade drive featuring TLC NAND and optimized for PCIe Gen5 performance, catering to general-purpose and content-heavy workloads. It is built for environments where high throughput, strong scalability, and deployment flexibility take priority over hyperscale-specific tuning. With support for U.2, U.3, and E3.S form factors, along with features like power-loss protection, AES-XTS 256-bit encryption, and NVMe-MI management, the X200P provides a solid foundation for storage infrastructure.
In terms of performance, the X200P excels in sequential and read-intensive scenarios, consistently ranking near the top in 128K and 64K tests and scaling effectively under CDN workloads. FIO testing confirms its strength in sequential reads and shows competitive performance across random read workloads. While it trails top-tier drives like Micron and SanDisk in write-intensive and highly concurrent conditions, its predictable and efficient write behavior makes it well-suited for a wide range of mid-tier enterprise deployments.
GDSIO testing further highlights the drive’s strengths in throughput-focused applications. The X200P maintains excellent latency at smaller block sizes and leads under heavy parallel access with large block transfers. Although latency increases at deeper queue depths, Phison’s tuning ensures the drive remains stable and responsive under sustained pressure.
Overall, the Pascari X200P is a well-rounded enterprise SSD with strong performance and a feature set tailored for real-world workloads. It will be interesting to see if Phison can pivot from being a controller-first company to one that offers a deep set of integrated drive solutions. So far, the X200P appears to be a promising start in that direction.


 Amazon