

The PowerEdge R640 is a scalable 1U rack server designed for computing and storage via a 2-socket platform. Described as a balance between performance, cost and density, the R640 is built to handle workloads from a range of different data center use cases–particularly dense software-defined storage, service providers, application tier, dense private cloud, virtualization and High Performance Computing (HPC). Moreover, Dell has built the PowerEdge R640 as an easily deployable server and that can seamlessly scale from 3 to 1000+ nodes for software-defined storage using Dell EMC VxFlex Ready Nodes.
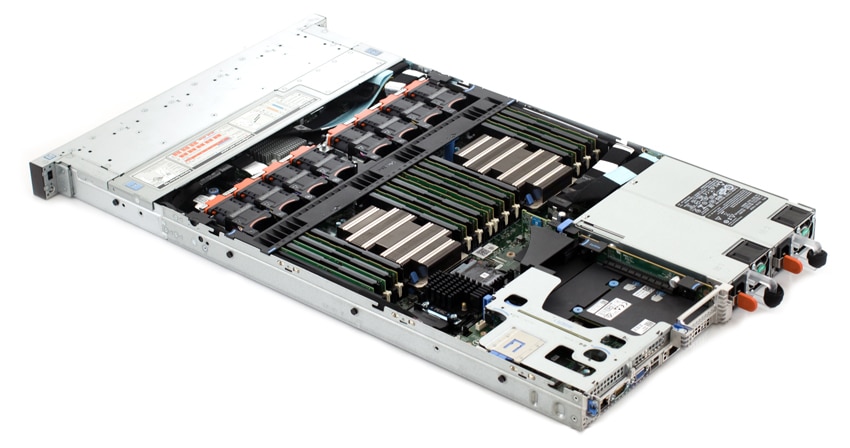
The PowerEdge R640 packs a lot of fairly powerful components, as well as a ton of expansion opportunities. For example, it can be equipped with two Intel Xeon Processor Scalable Family processors with up to 28 cores per processor. It features 24 DIMM slots for a maximum of 3TB of RAM and up to 12 NVDIMM for a maximum of 192GB of RAM. It also has two AC (or DC) redundant power supply units. The R640 also supports PCI generation-3 expansion cards.
The Dell rack server can be outfitted with 2.5” or 3.5” HDDs and SSDs and supports up to 8 NVMe for those looking for the fastest storage performance possible. This is double the amount of NVMe of the R630, so it certainly makes this 1U platform significantly more versatile. To this end, the R640 can be configured with 8 x 2.5 inch hard drives or 4 x 3.5 inch hard drives on the front panel, or 10 x 2.5 inch hard drives on the front panel with optional support for 2 X 2.5 inch hard drives on the back panel.
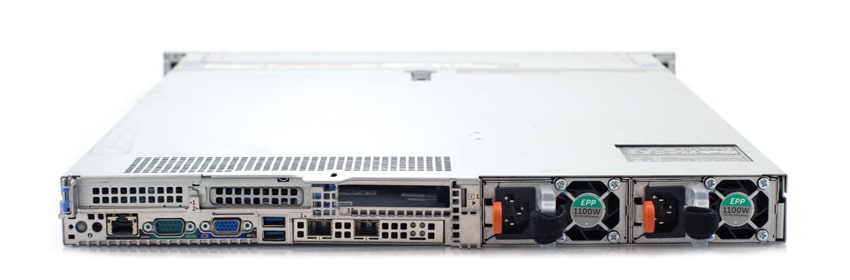
The PowerEdge R640 supports USB ports, NIC ports, VGA ports, serial connector, and an IDSDM/vFlash card that supports an optional flash memory card and one internal dual SD module.
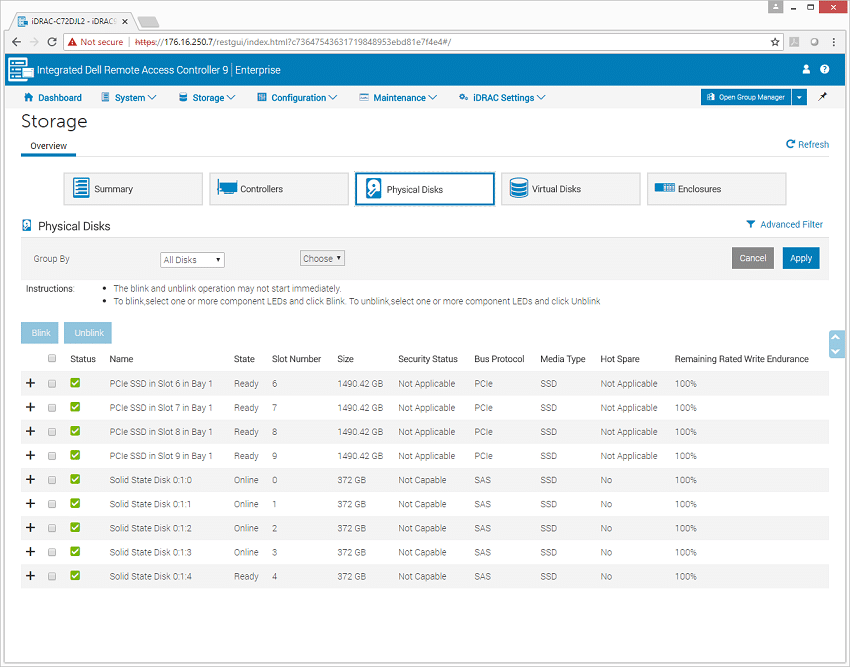
For testing, we configured the R640 with Dual Intel Xeon Platinum 8180 processors and 384GB (32GB x 12) 2666MT/s RAM. Storage metrics were attained using 3.2TB of NVME (2 x 1.6TB PM1725a NVMe SSDs) and 2TB of SAS (5 x 400GB PM1635a SAS SSDs).
Dell EMC PowerEdge R640 Specifications
| Form factor | 1U |
| Processor | Up to two Intel Xeon Scalable processors, up to 28 cores per processor |
| Memory | 24 DDR4 DIMM slots, Supports RDIMM /LRDIMM, speeds up to 2666MT/s, 3TB max |
| Up to 12 NVDIMM, 192 GB Max | |
| Supports registered ECC DDR4 DIMMs only | |
| Storage Controllers | |
| Internal controllers | PERC H330, H730p, H740p, Software RAID (SWRAID) S140 |
| Boot Optimized Storage Subsystem | HWRAID 2 x M.2 SSDs 120GB, 240 GB |
| External PERC (RAID) | H840 |
| 12Gbps SAS HBAs (non-RAID) | External- 12Gbps SAS HBA (non-RAID), Internal- HBA330 (non-RAID) |
| Drive bays | |
| Front drive bays | Up to 10 x 2.5” SAS/SATA (HDD/SSD) with up to 8 NVMe SSD max 58TB or up to 4 x 3.5” SAS/SATA HDD max 48TB |
| Rear drive bays | Up to 2 x 2.5” SAS/SATA (HDD/SSD), NVMe SSD max 12TB |
| Optional | DVD-ROM, DVD+RW |
| I/O & Ports | |
| Network daughter card options | 4 x 1GE or 2 x 10GE + 2 x 1GE or 4 x 10GE or 2 x 25GE |
| Front ports | Video, 1 x USB 2.0, available USB 3.0, dedicated IDRAC Direct USB |
| Rear ports | Video, serial, 2 x USB 3.0, dedicated iDRAC network port |
| Video card | VGA, NVIDIA NVS310 available as PCIe card Up to 3 x Gen3 slots, all x16 |
| Power supplies | Titanium 750W, Platinum 495W, 750W, 1100W, and 1600W |
| 48VDC 1100W, 380HVDC 1100W, 240HVDC 750W Hot plug power supplies with full redundancy option | |
| Supported OS | Canonical |
| Ubuntu LTS | |
| Citrix XenServer | |
| Microsoft Windows Server with Hyper-V | |
| Red Hat Enterprise Linux | |
| SUSE Linux Enterprise Server | |
| VMware ESXi | |
Design and Build
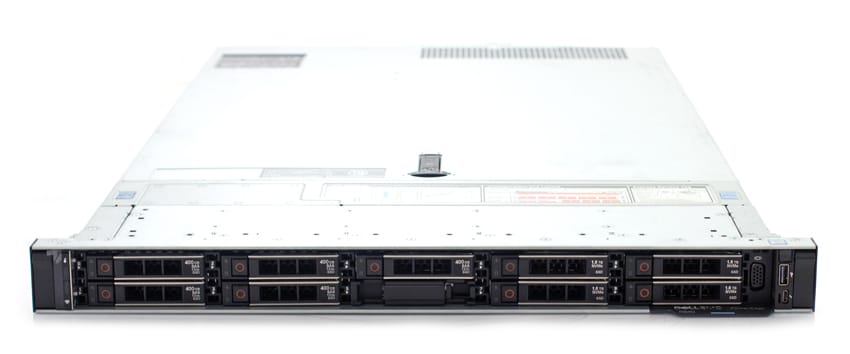
Though the Dell PowerEdge R640 rack server uses a very compact build, it still boasts a ton of versatility as well as different configurations and expansion options. Like we mentioned above, this includes an 8 x 2.5-inch drive system, a 4 x 3.5-inch drive system, and a 10 x 2.5 inch drive system as far as storage goes.
The control panel is located on the left of the front side, which is home to the system health and system ID, status LED, and the iDRAC Quick Sync 2 (wireless) indicator. The Status LED displays any failed hardware components, while the optional wireless Quick Sync 2 indicates a Quick Sync enabled system (a feature that allows administrators to manage the system via mobile devices).
As is the case with all rack servers, the majority of the front panel real estate is taken up by the drive bays. In our 10-drive setup, this translates to either up to ten 2.5 inch hot-swappable drives (though users have the option to use six 2.5 hot-swappable drives), or up to four NVMe devices.
Management
As with other PowerEdge Servers, the R640 offers a wide range of management options. For a more in-depth look, readers can check out our deep dive in the Dell EMC PowerEdge R740xd review and our look into Dell EMC’s OpenManage Mobile app.
Performance
In our section looking at local-system performance, we have a well-equipped R640 which we are testing with two different tiers of flash storage. The first is NVMe flash, provided across four 1.6TB SSDs and the second is SAS flash which is provided across four 400GB SSDs. Both are Samsung branded, although specific parts may vary depending on which components are selected when the server is built. With the Intel Platinum 8180 CPUs inside, we had plenty of CPU cycles to throw at our storage workloads. As stated in our introduction section, the server came equipped with dual Intel 8180 Platinum CPUs as well as 384GB of RAM. For our application benchmarks we leverage ESXi 6.5.
SQL Server Performance
StorageReview’s Microsoft SQL Server OLTP testing protocol employs the current draft of the Transaction Processing Performance Council’s Benchmark C (TPC-C), an online transaction processing benchmark that simulates the activities found in complex application environments. The TPC-C benchmark comes closer than synthetic performance benchmarks to gauging the performance strengths and bottlenecks of storage infrastructure in database environments.
Each SQL Server VM is configured with two vDisks: 100GB volume for boot and a 500GB volume for the database and log files. From a system resource perspective, we configured each VM with 16 vCPUs, 64GB of DRAM and leveraged the LSI Logic SAS SCSI controller. While our Sysbench workloads tested previously saturated the platform in both storage I/O and capacity, the SQL test looks for latency performance.
This test uses SQL Server 2014 running on Windows Server 2012 R2 guest VMs, and is stressed by Dell’s Benchmark Factory for Databases. While our traditional usage of this benchmark has been to test large 3,000-scale databases on local or shared storage, in this iteration we focus on spreading out four 1,500-scale databases evenly across our servers.
SQL Server Testing Configuration (per VM)
- Windows Server 2012 R2
- Storage Footprint: 600GB allocated, 500GB used
- SQL Server 2014
- Database Size: 1,500 scale
- Virtual Client Load: 15,000
- RAM Buffer: 48GB
- Test Length: 3 hours
- 2.5 hours preconditioning
- 30 minutes sample period
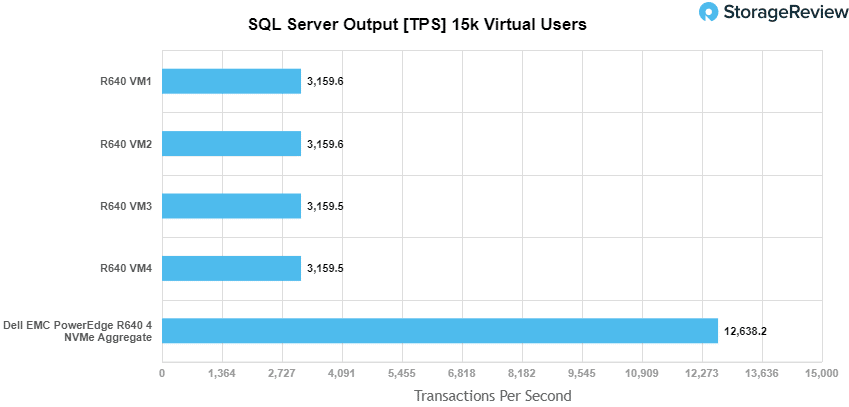
For SQL Server, we looked at individual VMs as well as aggregate scores. The transactional results showed an aggregate score of 12,638.2 TPS with individual VMs ranging form 3,159.5 TPS to 3,159.6 TPS.
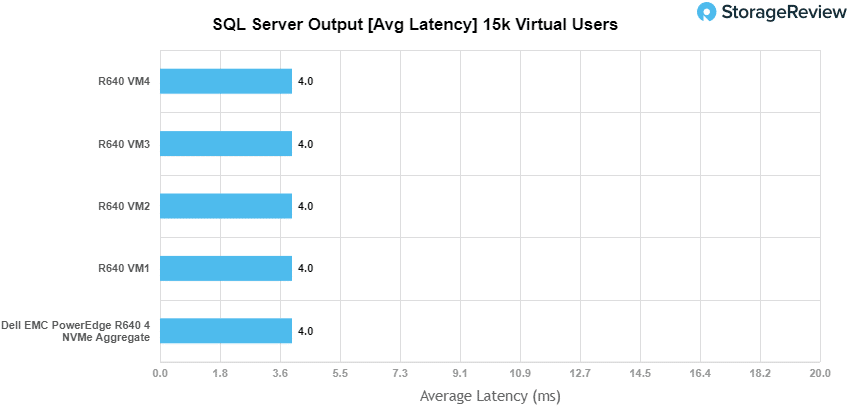
With SQL Server average latency, the R640 saw both an aggregate and individual VM latency of 4ms.
Sysbench MySQL Performance
Our first local-storage application benchmark consists of a Percona MySQL OLTP database measured via SysBench. This test measures average TPS (Transactions Per Second), average latency, and average 99th percentile latency as well.
Each Sysbench VM is configured with three vDisks: one for boot (~92GB), one with the pre-built database (~447GB), and the third for the database under test (270GB). From a system resource perspective, we configured each VM with 16 vCPUs, 60GB of DRAM and leveraged the LSI Logic SAS SCSI controller.
Sysbench Testing Configuration (per VM)
- CentOS 6.3 64-bit
- Percona XtraDB 5.5.30-rel30.1
- Database Tables: 100
- Database Size: 10,000,000
- Database Threads: 32
- RAM Buffer: 24GB
- Test Length: 3 hours
- 2 hours preconditioning 32 threads
- 1 hour 32 threads
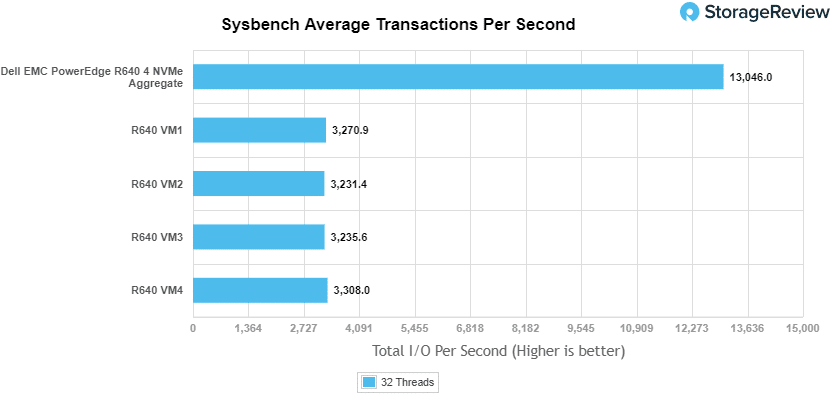
In our Sysbench benchmark, we tested the R640 with a similar layout to the above. For transactional performance, the sever had an aggregate average TPS of 13,046 with individual VMs ranging between 3,231.4 TPS to 3,308 TPS.
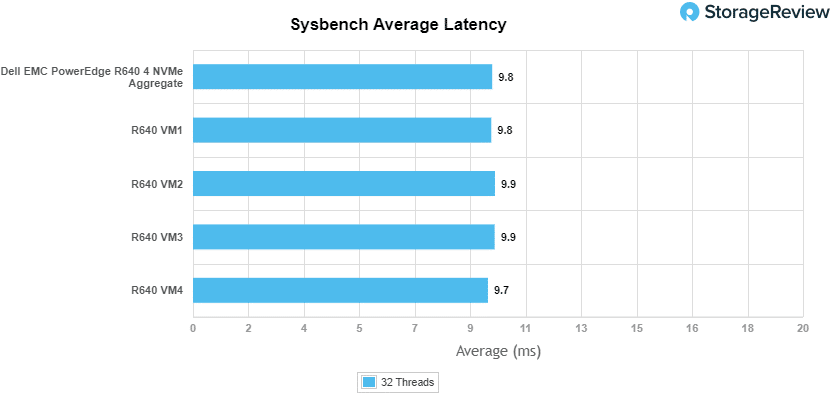
For Sysbench average latency, the R640 had an aggregate score of 9.8ms with individual VMs running from 9.7ms to 9.9ms.
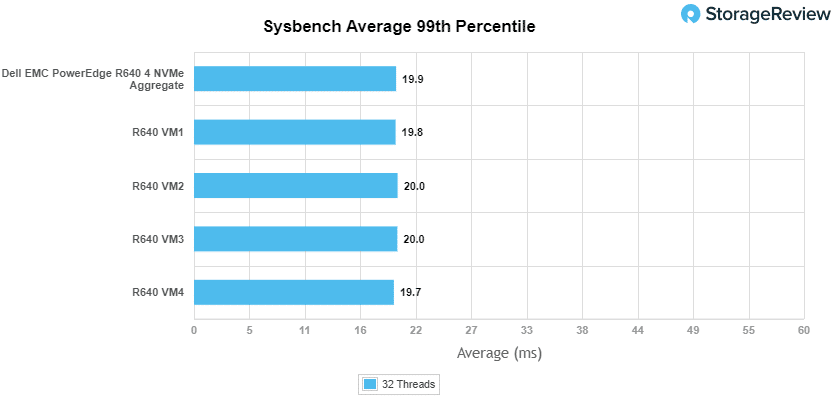
In our worst-case 99th percentile latency measurement, the server hit an impressive aggregate score of 19.9ms with individual VMs ranging from 19.7ms to 20ms.
VDBench Workload Analysis
With the latest-and-greatest server, it is highly tempting to toss in the latest-and-greatest storage to get the biggest bang for the buck. However, not everyone is going to do this, and several users will be upgrading their servers with their existing storage or with lower-cost SAS-based flash. For our review, we populated the server with both NVMe and SAS storage for each benchmark. This isn’t a “which one is better” scenario, because from a performance perspective, the NVMe will win. This is more of a “what to expect with the given storage” scenario and should be looked at in this manner.
Our last section of local performance testing focuses in on synthetic-workload performance. In this area, we leveraged four SAS and four NVMe SSDs in a bare-metal environment running Ubuntu 16.04.4. The workload was configured to stress 25% of each drive’s capacity, focusing on sustained performance versus steady-state, worst-case performance.
When it comes to benchmarking storage arrays, application testing is best and synthetic testing comes in second place. While not a perfect representation of actual workloads, synthetic tests do help to baseline storage devices with a repeatability factor that makes it easy to do apples-to-apples comparison between competing solutions. These workloads offer a range of different testing profiles ranging from “four corners” tests, common database transfer size tests, as well as trace captures from different VDI environments. All of these tests leverage the common vdBench workload generator, with a scripting engine to automate and capture results over a large compute testing cluster. This allows us to repeat the same workloads across a wide range of storage devices, including flash arrays and individual storage devices.
Profiles:
- 4K Random Read: 100% Read, 128 threads, 0-120% iorate
- 4K Random Write: 100% Write, 64 threads, 0-120% iorate
- 64K Sequential Read: 100% Read, 16 threads, 0-120% iorate
- 64K Sequential Write: 100% Write, 8 threads, 0-120% iorate
- Synthetic Database: SQL and Oracle
- VDI Full Clone and Linked Clone Traces
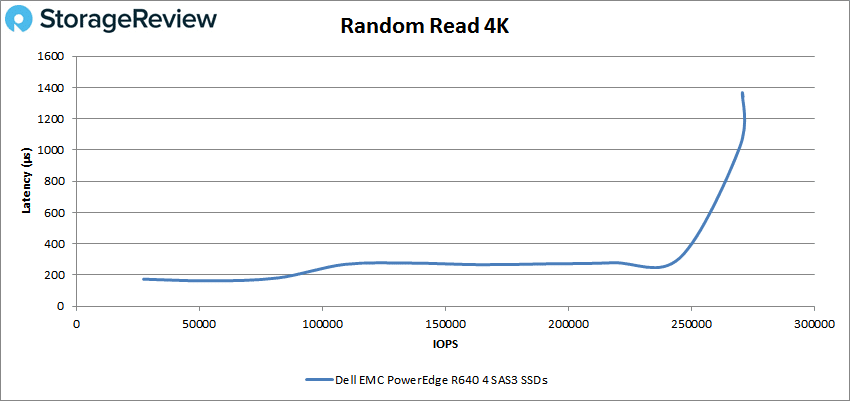
Looking at peak read performance for the SAS drives, the PowerEdge R640 was able to maintain sub-millisecond latency until nearly its peak performance. The server broke 1ms at about 269K IOPS and peaked at roughly 271K IOPS with a latency of about 1.1ms.
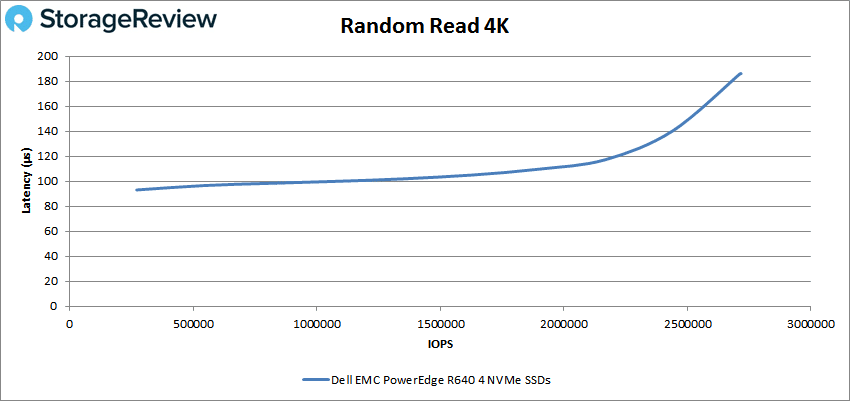
For NVMe peak read on the R640, we saw sub-millisecond latency throughout with peak performance at 2,711,968 IOPS with a latency of 186μs.
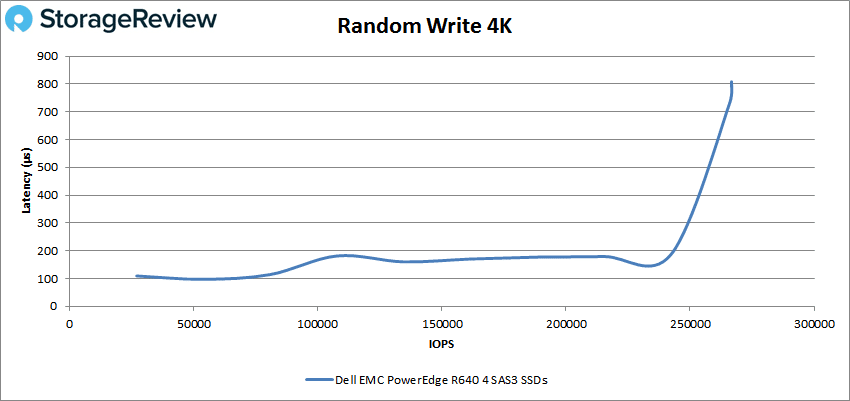
For peak SAS write performance, the R640 maintained sub-millisecond latency throughout with a peak performance of 266,641 IOPS and a latency of 807μs.
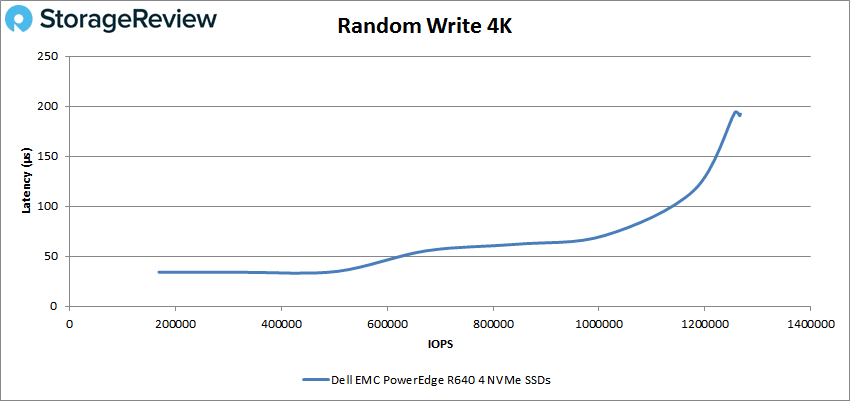
4K write performance with NVMe drives peaked at 1,265,764 IOPS with a latency of only 191μs.
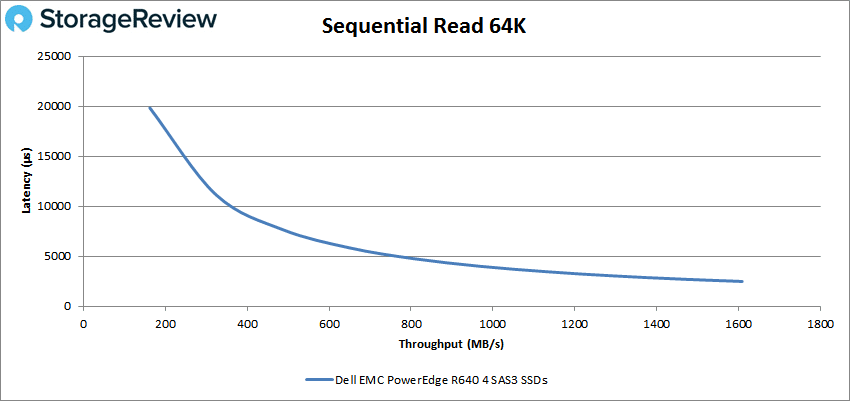
When we switch over to sequential benchmarks (64K), we see the same type of performance we saw with the PowerEdge R7415. The latency starts off high (19.8ms in this case) and tapers off as the benchmarks runs. The R640 with SAS drives finished at 25,606 IOPS or 1.61GB/s with a latency of 2.49ms.
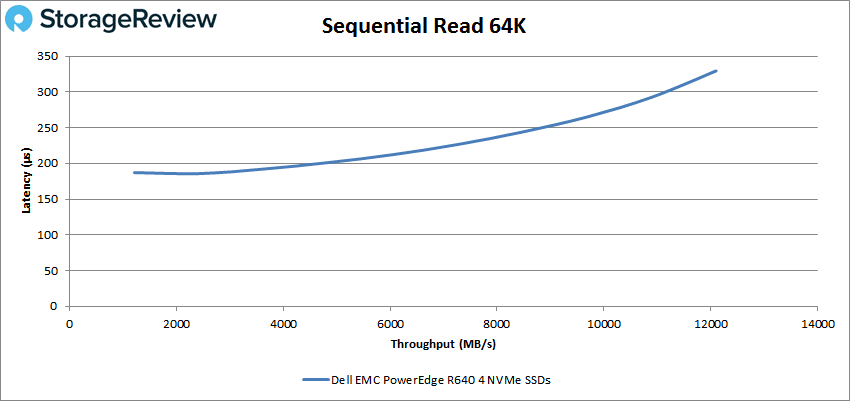
For the NVMe 64K sequential reads, the R640 started very low in latency and peaked at 193,493 IOPS or 12.1GB/s at a latency of 329μs.
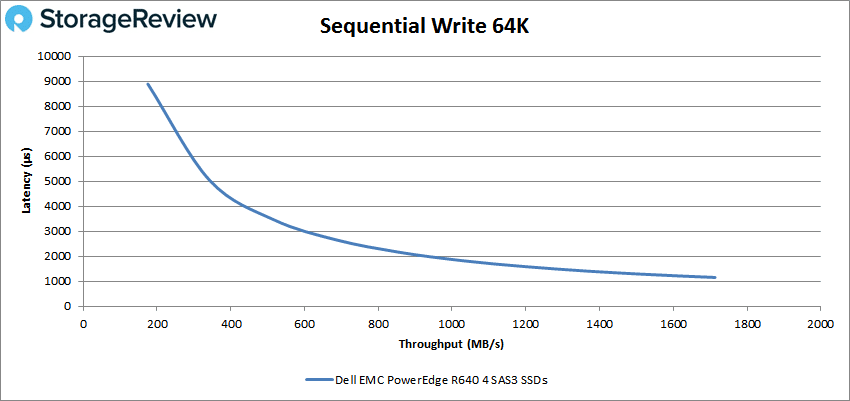
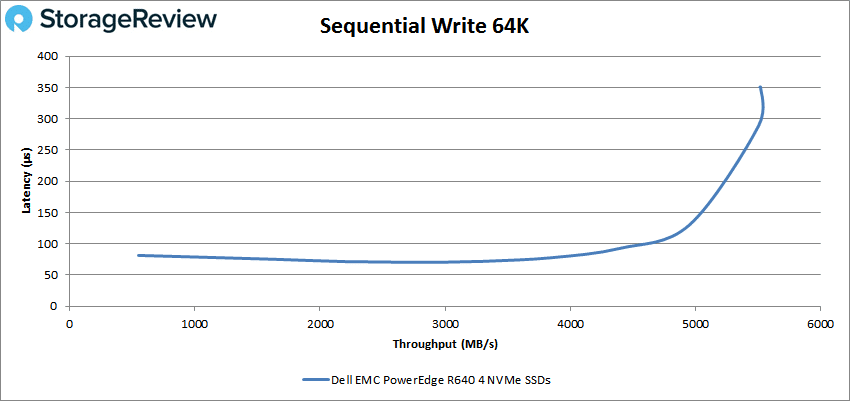
Again, with the sequential 64K write, the R640 with SAS started off with high latency (8.9ms) before finishing at 27,394 IOPS or 1.71GB/s with a latency of 1.16ms.
Here again, the NVMe-based server started much lower with sequential writes and peaked at about 89K IOPS or 5.6GB/s with a latency around 315μs.
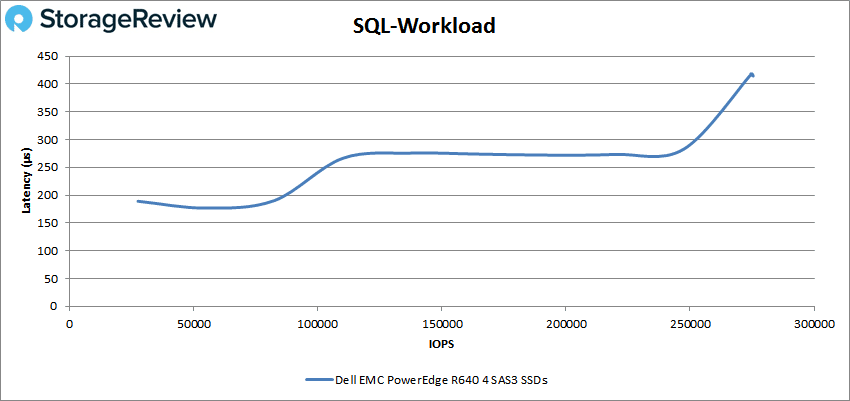
Switching over to our SQL workload, the SAS drives had a better overall showing with sub-millisecond latency throughout, peaking at 275,406 IOPS with a latency of 418μs.
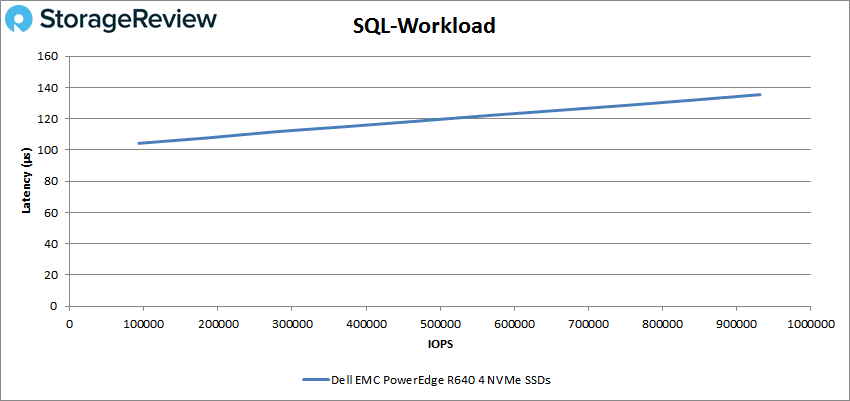
For the SQL workload on the NVMe version of the server we saw peak performance of 930,251 IOPS with a latency of only 135μs.
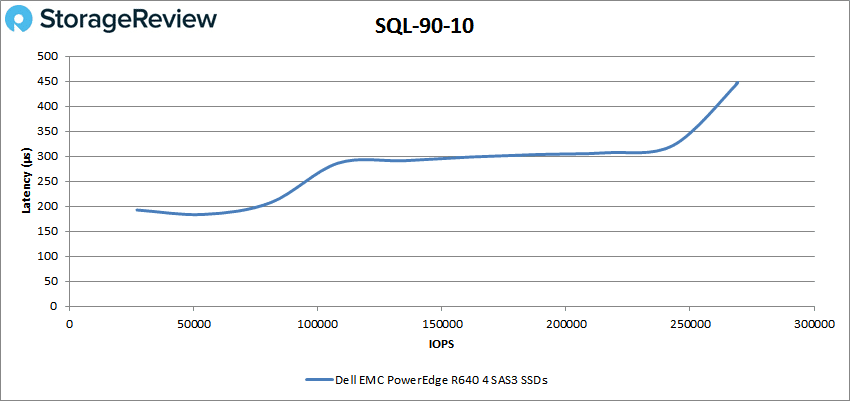
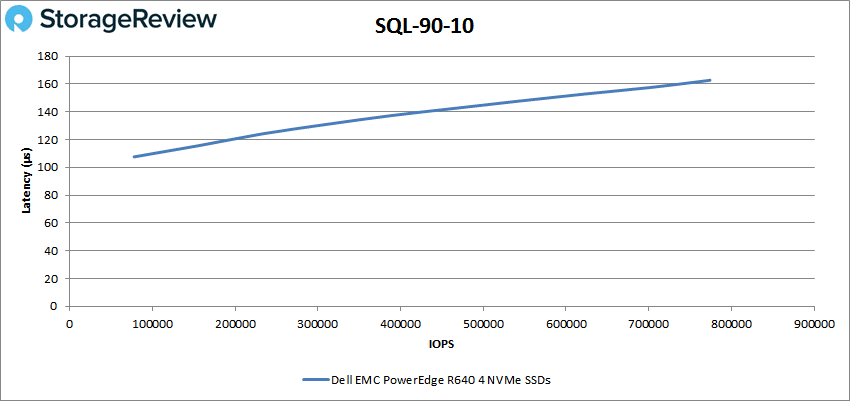
For our SQL 90-10 with SAS, the R640 had a peak performance of 268,036 IOPS with a latency of 448μs.
The NVMe version of the SQL 90-10 had the server giving peak performance of 774,044 IOPS with a latency of 163μs.
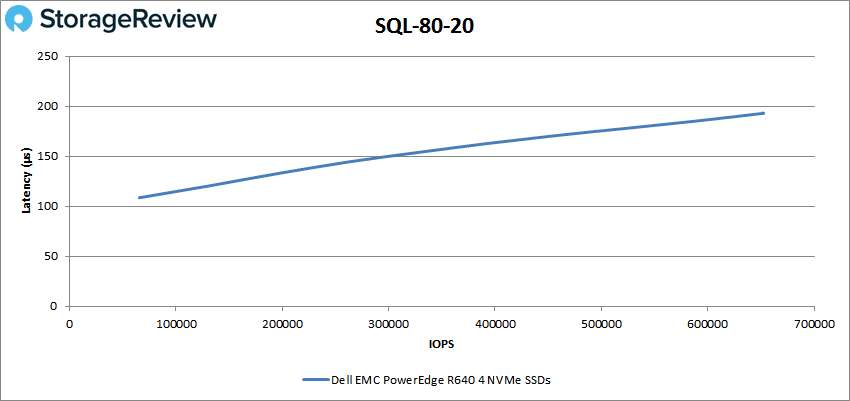
The SAS in the SQL 80-20 saw the server peaking at 254,044 IOPS with a latency of 491μs.
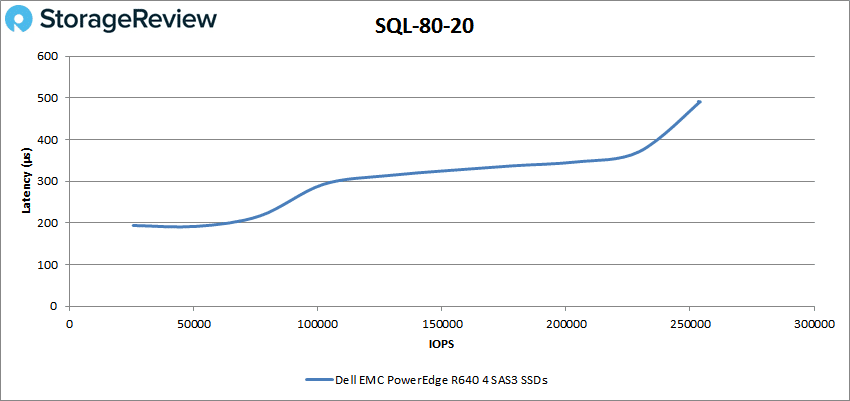
For SQL 80-20 with NVMe, the R640 was able to peak at 652,259 IOPS with a latency of 193μs.
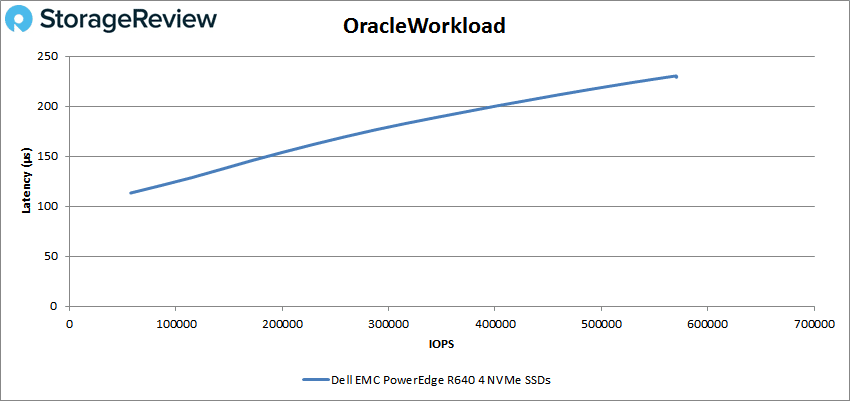
Moving on to Oracle workloads, the SAS-loaded R640 peaked at 239,794 IOPS with a latency of 533μs.
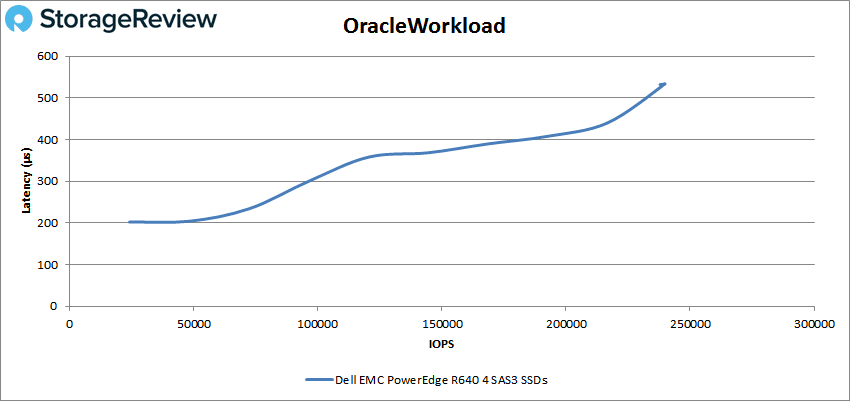
For NVMe Oracle, the server peaked at 570,158 IOPS with a latency of 230μs.
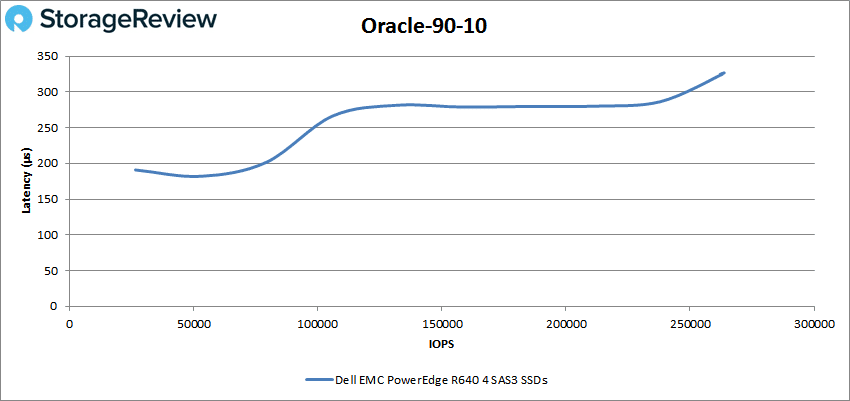
For SAS Oracle 90-10, the server peaked at 263,745 IOPS and a latency of 327μs.
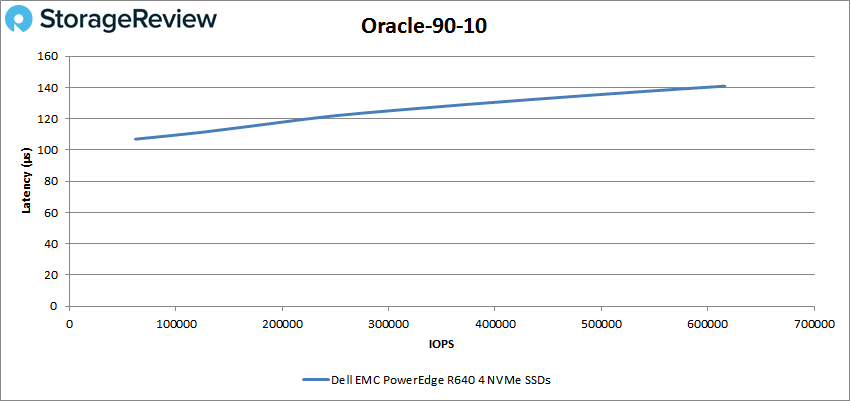
The Oracle 90-10 with NVMe peaked at 615,818 IOPS with only 141μs of latency.
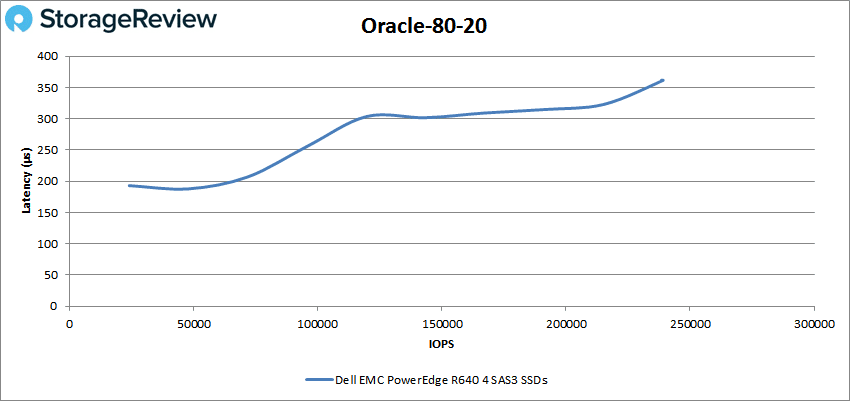
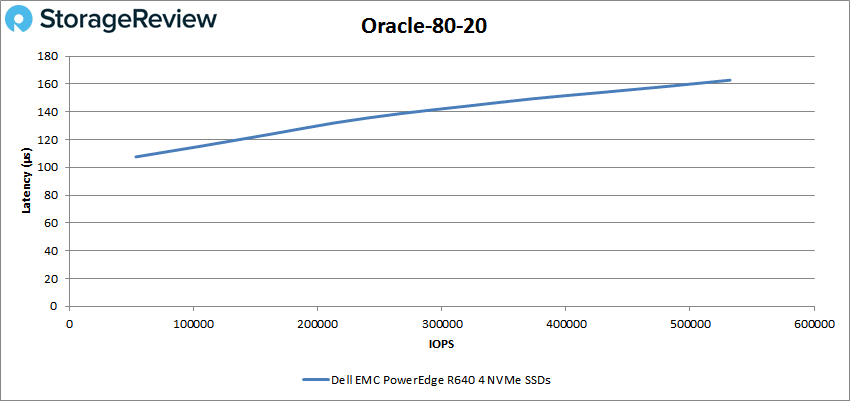
Oracle 80-20 with SAS drives in the R640 gave us peak performance of 239,107 IOPS with a latency of 361μs.
For the Oracle 80-20 with NVMe drives, the server peaked at 532,046 IOPS with a latency of 163μs.
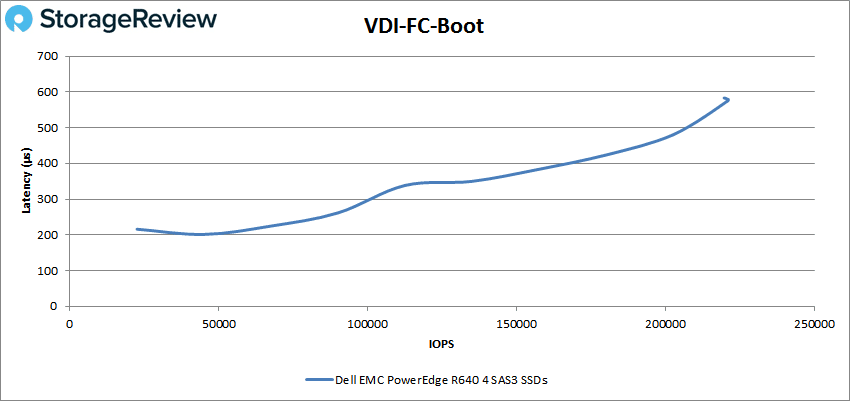
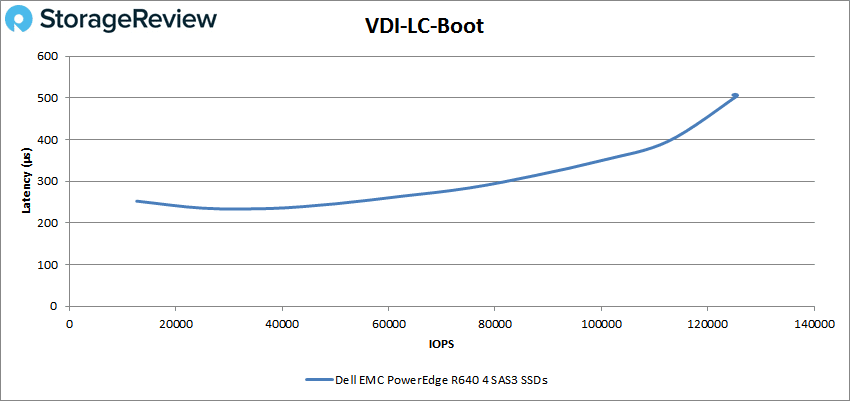
Next, we switched over to our VDI Clone Test, Full and Linked. For VDI Full Clone Boot with SAS, the PowerEdge R640 peaked at 221,147 IOPS with a latency of 575μs before dropping off slightly.
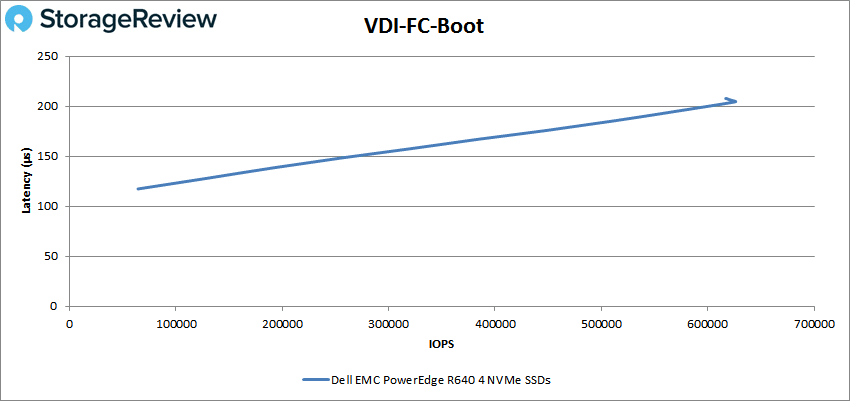
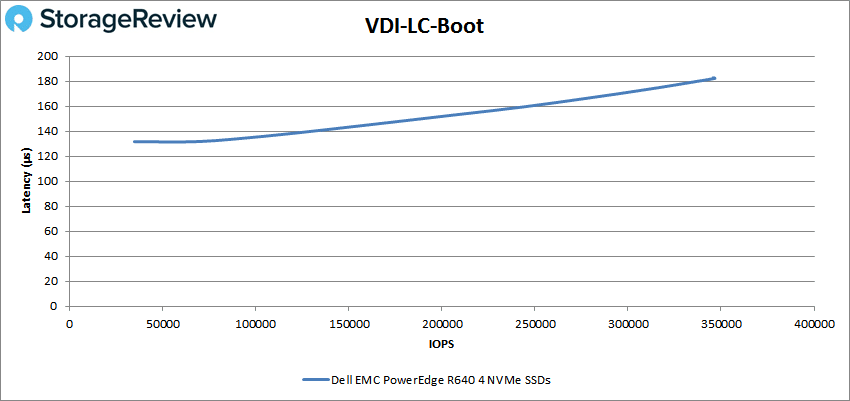
Looking at the NVMe R640 on VDI Full Clone boot, the server peaked at 626,040 IOPS with a latency of 205μs.
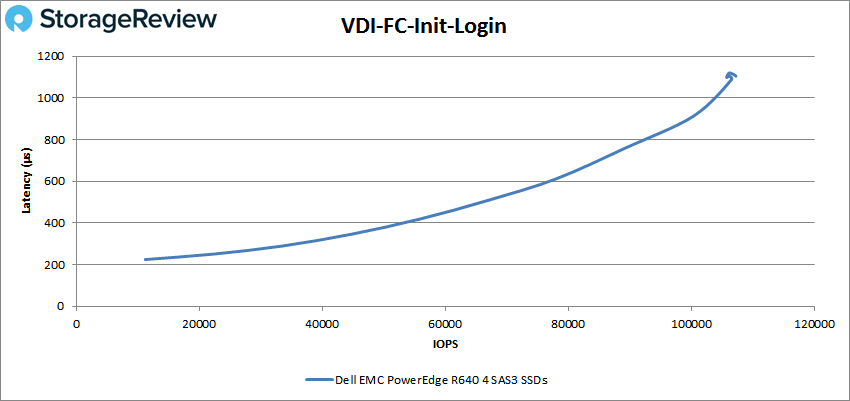
For SAS VDI Full Clone Initial Login the server had sub-millisecond latency until roughly 105K IOPS and peaked at 107,280 IOPS with a latency of 1.11ms.
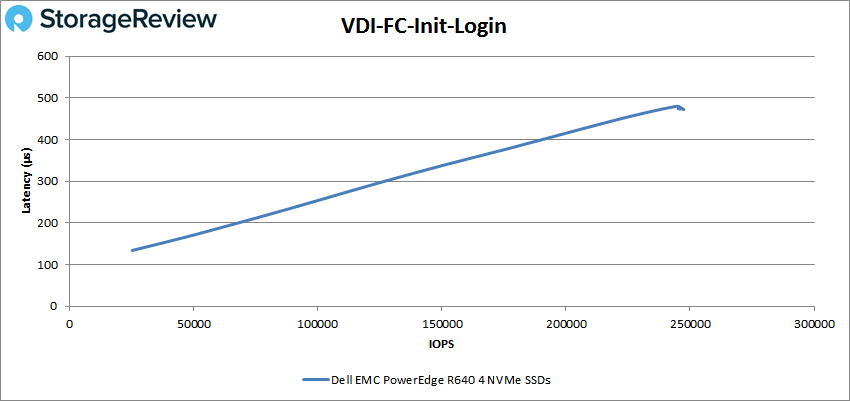
The VDI Full Clone Initial Login with NVMe had the server peak at 246,628 IOPS and 476μs for latency.
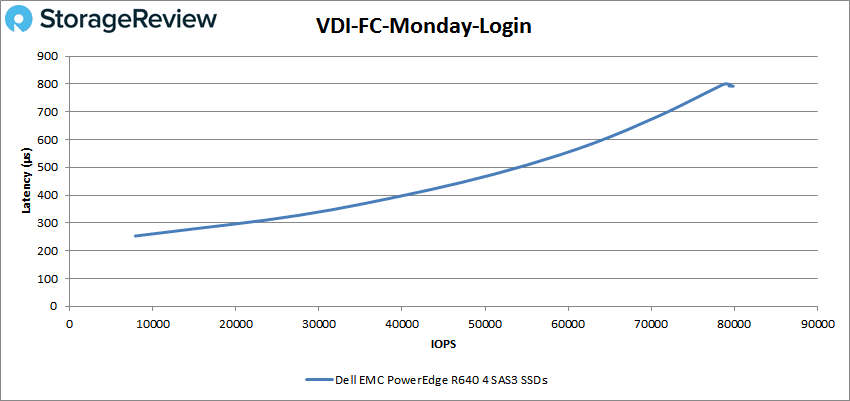
For VDI Full Clone Monday Login with SAS drives, the R640 peaked at 79,495 IOPS with a latency of 797μs.
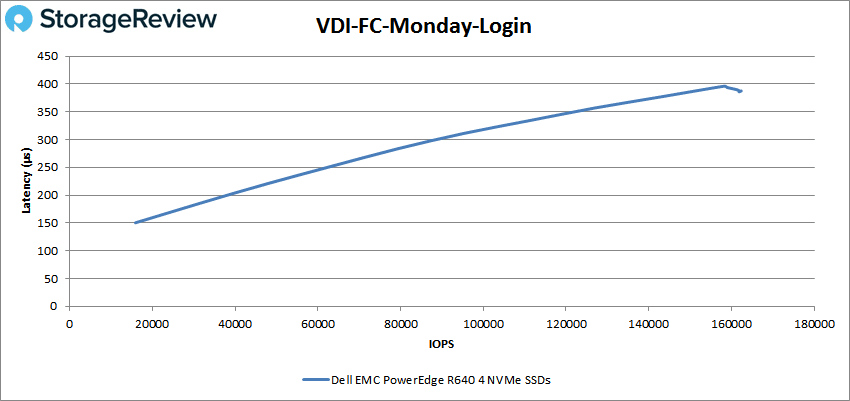
With the NVMe drives, the server was able to peak at 161,771 IOPS and a latency of 386μs for the VDI Full Clone Monday Login.
Switching over to VDI Linked Clone tests, the SAS-loaded R650 had a boot peak performance of 125,587 IOPS with a latency of 506μs.
For the NVMe VDI Linked Clone Boot test, the server peaked at 346,693 IOPS and a latency of 182μs.
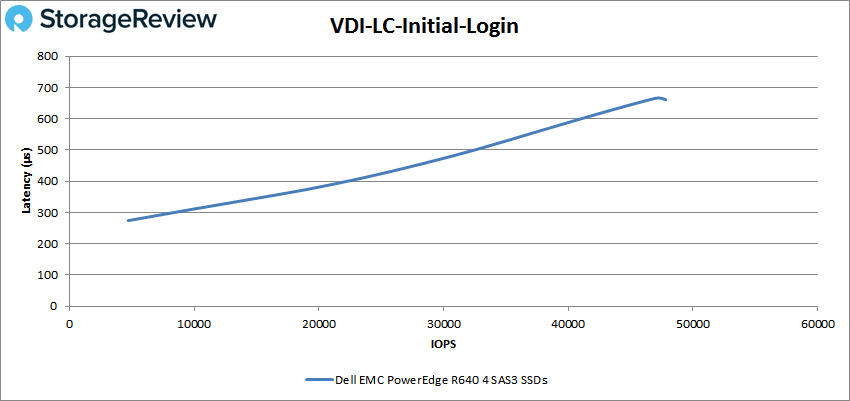
VDI Linked Clone Initial Login with SAS showed the server peaking at 47,656 IOPS with a latency of 662μs.
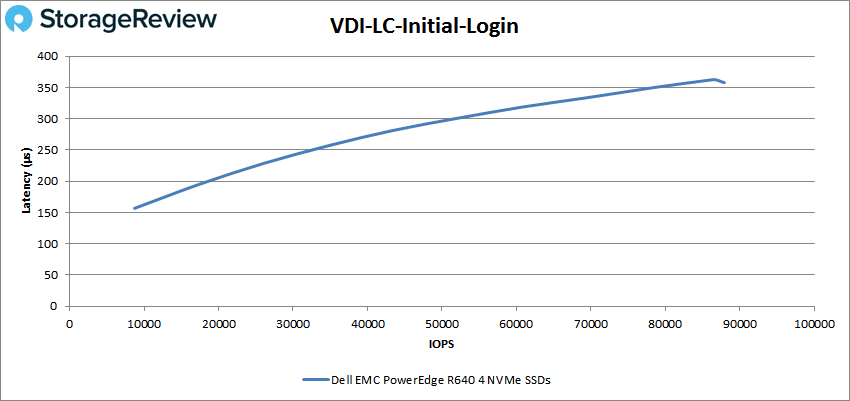
For the NVMe Linked Clone Initial Login, the R640 peaked at 87,384 IOPS with a latency of 359μs.
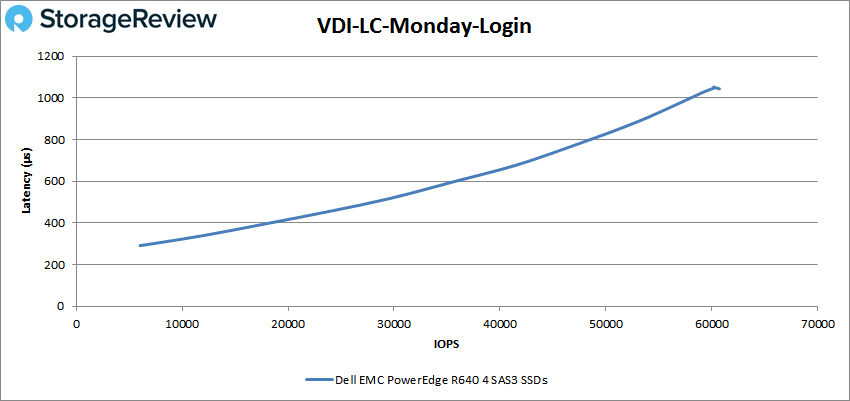
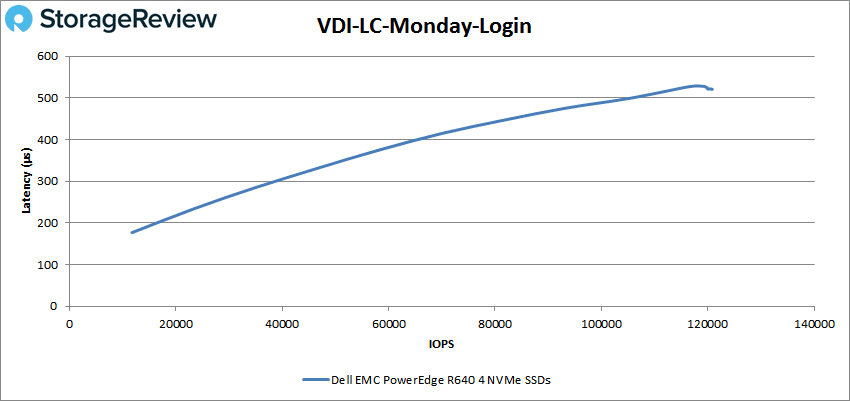
For VDI Linked Clone Monday Login, the SAS-based PowerEdge R640 had sub-millisecond latency until roughly 59K IOPS and peaked at 60,708 IOPS with a latency of 1.04ms.
And finally, the NVMe version of the VDI Linked Clone Monday Login had the server peak at 120,850 IOPS with a latency of 521μs.
Conclusion
Launched as one of the initial 14th generation PowerEdge servers, the Dell EMC PowerEdge R640 is a two socket 1U server aimed at balancing power, density, and cost in a tiny footprint. The server can be set up with two Intel Xeon Scalable CPUs for up to 28 cores per processor and features 24 DIMM slots that can be filled with up to 3TB of RAM or 12 that can be filled with NVDIMMs. For storage, users can equip the R640 with either eight 2.5” bays or four 3.5” bays on the front (it can also be configured for 12 2.5” bays with 10 in front and 2 in back). Like all PowerEdge servers, the R640 comes will several management options and tools including iDRAC and OpenManage. The server can handle several different use cases with Dell EMC pointing to SDS, service providers, application tier, dense private cloud, virtualization and HPC.
In our applications performance benchmarks, we looked at the performance of the PowerEdge R640 leveraging VMware to see individual VM performance as well as aggregate. In our SQL Server transactional test, we saw an aggregate score of 12,638.2 TPS and an aggregate latency of only 4ms. For Sysbench, we saw aggregate transactional performance of 13,046 TPS and average latency of 9.8ms, and for worst-case scenario latency, we saw an aggregate latency of just 19.9ms.
In our bare-metal VDBench workloads, we ran both SAS and NVMe storage. As stated above, this wasn’t to see which one is “better,” as obviously NVMe will have a higher performance punch. However, this demonstrates to potential users what they can expect with different types of storage media. Instead of going through every result above, we’ll just look at some highlights of each drive type. For the SAS drives, we saw the R640 hit random performance peak scores of 271K IOPS read and about 267K IOPS write, and display peak sequential speeds of 1.61GB/s read and 1.171GB/s write. For the rest of our tests, the SAS-based R640 was able to maintain sub-millisecond latency performance with the exception of VDI Full Clone Initial Login and VDI Linked Clone Monday login, where in both cases, the server was just over 1ms. The NVMe drives showed numbers as high as 2.7 million IOPS in random read and 1.26 million IOPS random write with sequential numbers hitting 12.1GB/s read and 5.6GB/s write. The NVMe drives were also able to hit nearly 1 million IOPS in our SQL workload and half a million IOPS in our Oracle workload. The NVMe version of the R640 had sub-millisecond latency throughout.
Like its predecessors, the 1U PowerEdge family has a lot to offer, including a multitude of options and incredible levels of chassis customization. This time around, the R640 brings so many configuration options to the table, it’s easy to understand why it’s the lynchpin in Dell EMC’s go-to-market strategy for SDS, where compute is more critical than on-board capacity. The R640 is great for mainstream HCI use cases like vSAN/VxRail and XC series (Nutanix), as well as the larger HCI/CI scalable solutions like VxRack SDDC. Of course, the R640 can work well in other classic environments outside the traditional Dell EMC-like hyperscale data centers that may rely on software tools like OpenStack and Redfish. In any case, the R640 is a great addition to the PowerEdge family and will surely find its way into a diverse set of use cases.


 Amazon