

The Dell EMC PowerEdge R840 is a 2U server and part of the company’s 14th generation of its server line. The R840 is a four-socket server that offers Intel Xeon Scalable processors for up to 112 cores. Users can leverage up to 24 direct attached NVMe drives as well as up to two double-wide GPUs or up to 2 FPGAs, and up to 48 DIMMs for a max of 6TB of memory (12 NVDIMMs can be used for a max of 384GB). This hardware is great for applications that need high-performance and for data analytics and other emerging compute-heavy workloads.
The R840, along with the R940xa, was designed with artificial intelligence (AI) and machine learning (ML) in mind. The R840 comes equipped with the hardware needed to tackle both AI and ML workloads. The direct-attached NVMe drives provide the capacity needed while reducing latency. The server itself can be automated through the use of Dell EMC OpenManage. OpenManage automates the management of routine tasks and delivers better efficiency. With less time spend on minor tasks, admins can focus on higher value projects. Admins can also take advantage of QuickSync 2 capabilities that allow them to monitor the server on their mobile device.
As with all PowerEdge servers, the Dell EMC PowerEdge R840 has security built in to every piece of the architecture. The servers utilize cryptographically signed firmware packages and Secure Boot. The servers can be locked down in the event of an unauthorized or malicious change. And Dell EMC uses System Erase, just like it sounds, it wipes data off of all storage media in the server.
Dell EMC PowerEdge R840 Specifications
| Form Factor | 2U |
| CPU | Up to four Intel Xeon Scalable processors, up to 28 cores each |
| Memory | 48 DDR4 DIMM slots, Supports RDIMM /LRDIMM, up to 2666MT/s, 6TB max Up to 12 NVDIMMs, 384GB Max Supports registered ECC DDR4 DIMMs only |
| Storage Controllers | Internal Controllers: PERC H730P, H740P, H330 Software RAID (SWRAID) S140 Boot Optimized Storage Subsystem: HWRAID 2 x M.2 SSDs 120GB or 240 GB External PERC (RAID): H840 12Gbps SAS HBAs (non-RAID): External-12Gbps SAS HBA (non-RAID), Internal- HBA330 (non-RAID) |
| Drive bays | |
| Front drive bays | Up to 8x 2.5” SAS SATA (HDDs/SSDs) max 30TB Or up 24 x 2.5” SAS/SATA (HDDs/SSDs) with up to 12 NVMe PCIe SSDs max 122TB Or up to 24 NVMe PCIe SSDs max 153TB |
| Rear drive bays | Up to 2 x 2.5” SAS/SATA (HDDs/SSDs), max 7.68TB |
| I/O & Ports | |
| Network Daughter Card Options | 4 x 1GE 4 x 10GE 2 x 10GE+2 x 1GE Or 2 x 25GE |
| Front ports | Video 2 x USB 2.0 1 managed (micro-sub) Dedicated IDRAC Direct USB (Optional 1 x USB 3.0 only offered on the 8-drive con guration) |
| Rear ports | Video Serial 2 x USB 3.0 |
| Internal port | 1 x USB 3.0 |
| Video card | VGA |
| PCIe | Up to 6 x Gen3 slots, (4×16 slots or 2×16 + 4×8 slots) |
| Accelerator Options | Up to 2 doublewide GPUs or up to 2 full-height FPGAs GPU NVIDIA Tesla P100, P40, V100 |
| Supported operating systems | Canonical Ubuntu LTS Citrix XenServer Microsoft Windows Server with Hyper-V Red Hat Enterprise Linux SUSE Linux Enterprise Server VMware ESXi |
| Security | TPM 1.2/2.0 optional Cryptographically signed firmware Silicon Root of Trust Secure Boot System Lockdown Secure Erase |
| Embedded management | iDRAC9 with Lifecycle Controller iDRAC Direct iDRAC RESTful API with Redfish Quick Sync 2 BLE/wireless |
| Bezel | Optional LCD bezel or security bezel |
| Dimensions LxD | 462mm x 812mm |
| Weight | 36.6kg |
| Power | |
| Power supplies | Platinum: 750W,1100W, 1600W, 2000W, 2400W Titanium: 750W |
| DC | 1100W |
| Mix Mode/HVDC | 750W, 1100W1 |
| Hot plug power supplies with full redundancy option 6 hot plugs fans with N +1 redundancy | |
Design and Build
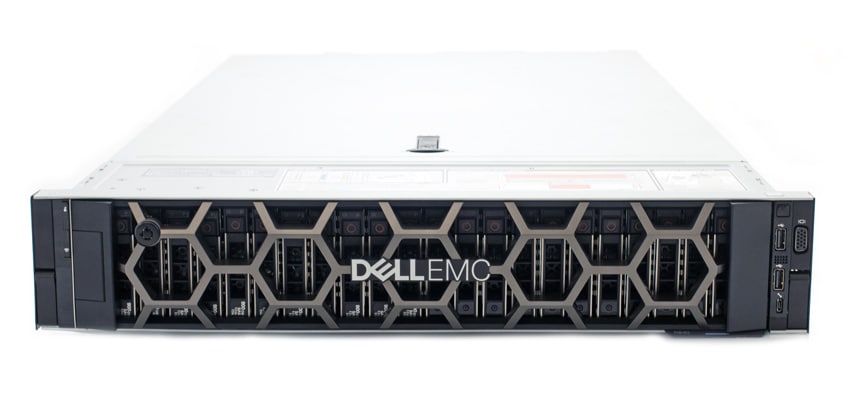
The Dell EMC PowerEdge R840 is a 2U server that has the stylized bezels that the rest of the line has. Beneath the bezel there are either 24 2.5” bays running vertically across the front or there is an option of 8 2.5” bays with an optional optical drive. The left control panel has status LED indicators, system health and system ID indicator, and iDRAC Quick Sync 2 wireless indicator (this feature is optional). The right control panel has the power button, iDRAC direct port, VGA port, two USB 2.0 ports and an iDRAC direct LED. There is also a small LCD panel that displays system information, status and error messages and a few keys to navigate it.
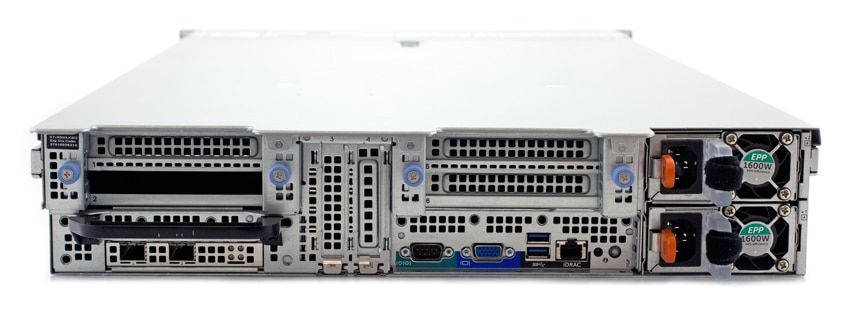
Looking at the rear of the device, there are four full-height PCIe expansion card slots and two half-height PCIe expansion slots. On the bottom left are four NIC ports, on the right are two hot-swappable PSUs and in the middle bottom there is a serial port, VGA port, two USB 3.0 ports, and iDRAC9 dedicated port, and a system identification bottom.
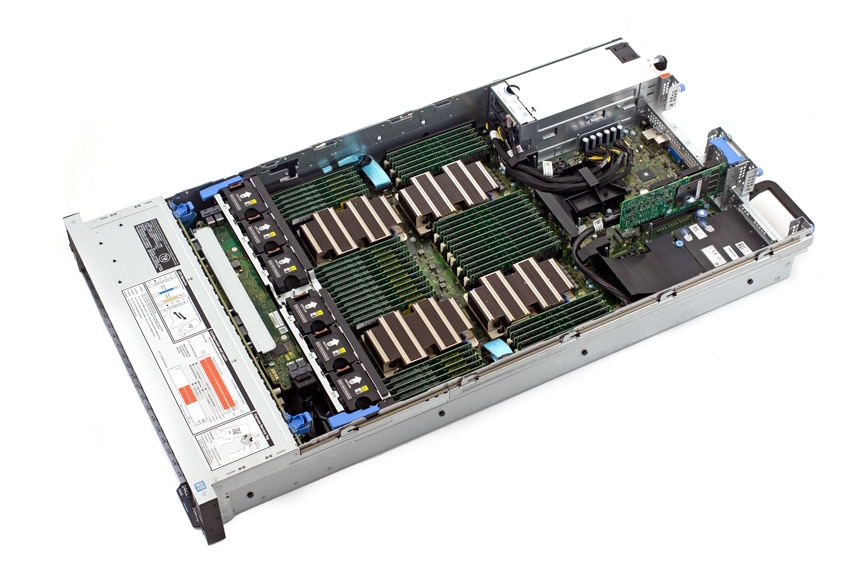
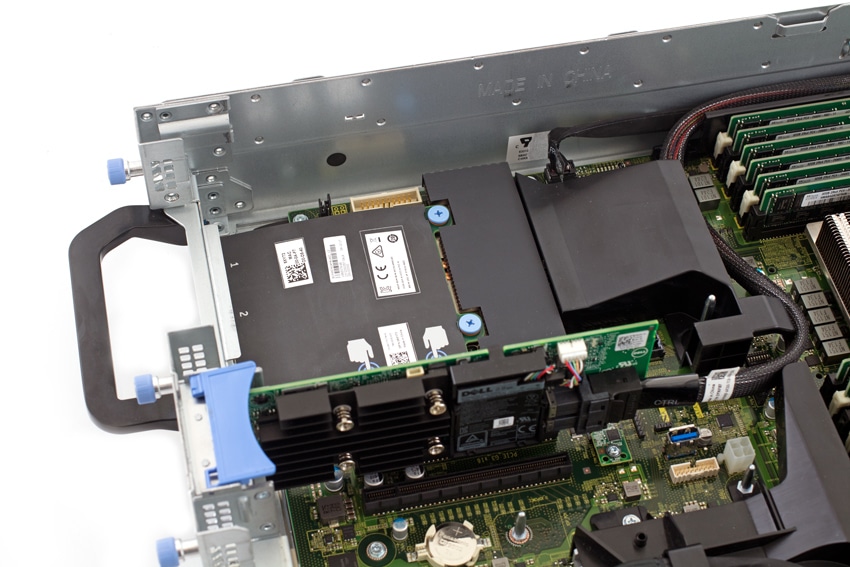
Popping the top off and removing some of the protective trays, we can see the four CPUs as well as all the room made for the DRAM. Near the rear of the device one can see how two wide GPUs can be added.
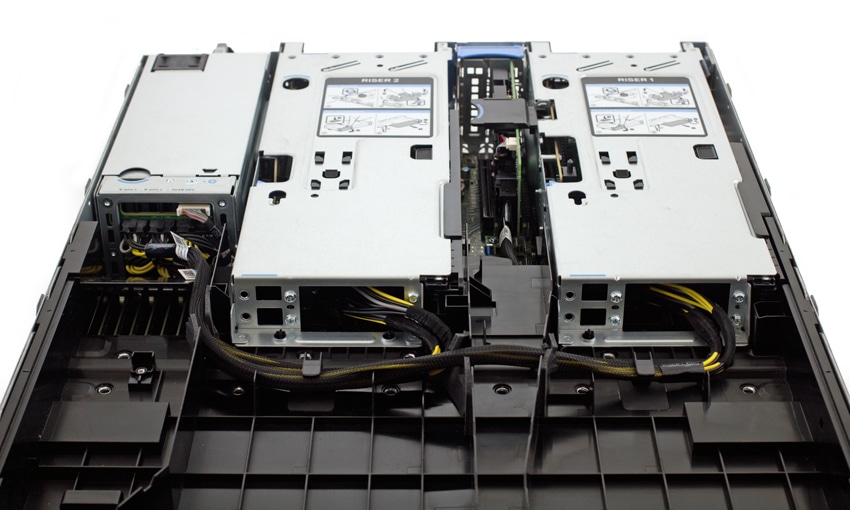
Also at the rear of the device is where the RAID card is added. Though it looks like it is in a tight spot, it is fairly easy to get to and change if needed. The integrated rNDC NIC is also visible on the bottom, but allows easy upgrades for network connectivity without consuming traditional PCIe space.
Management
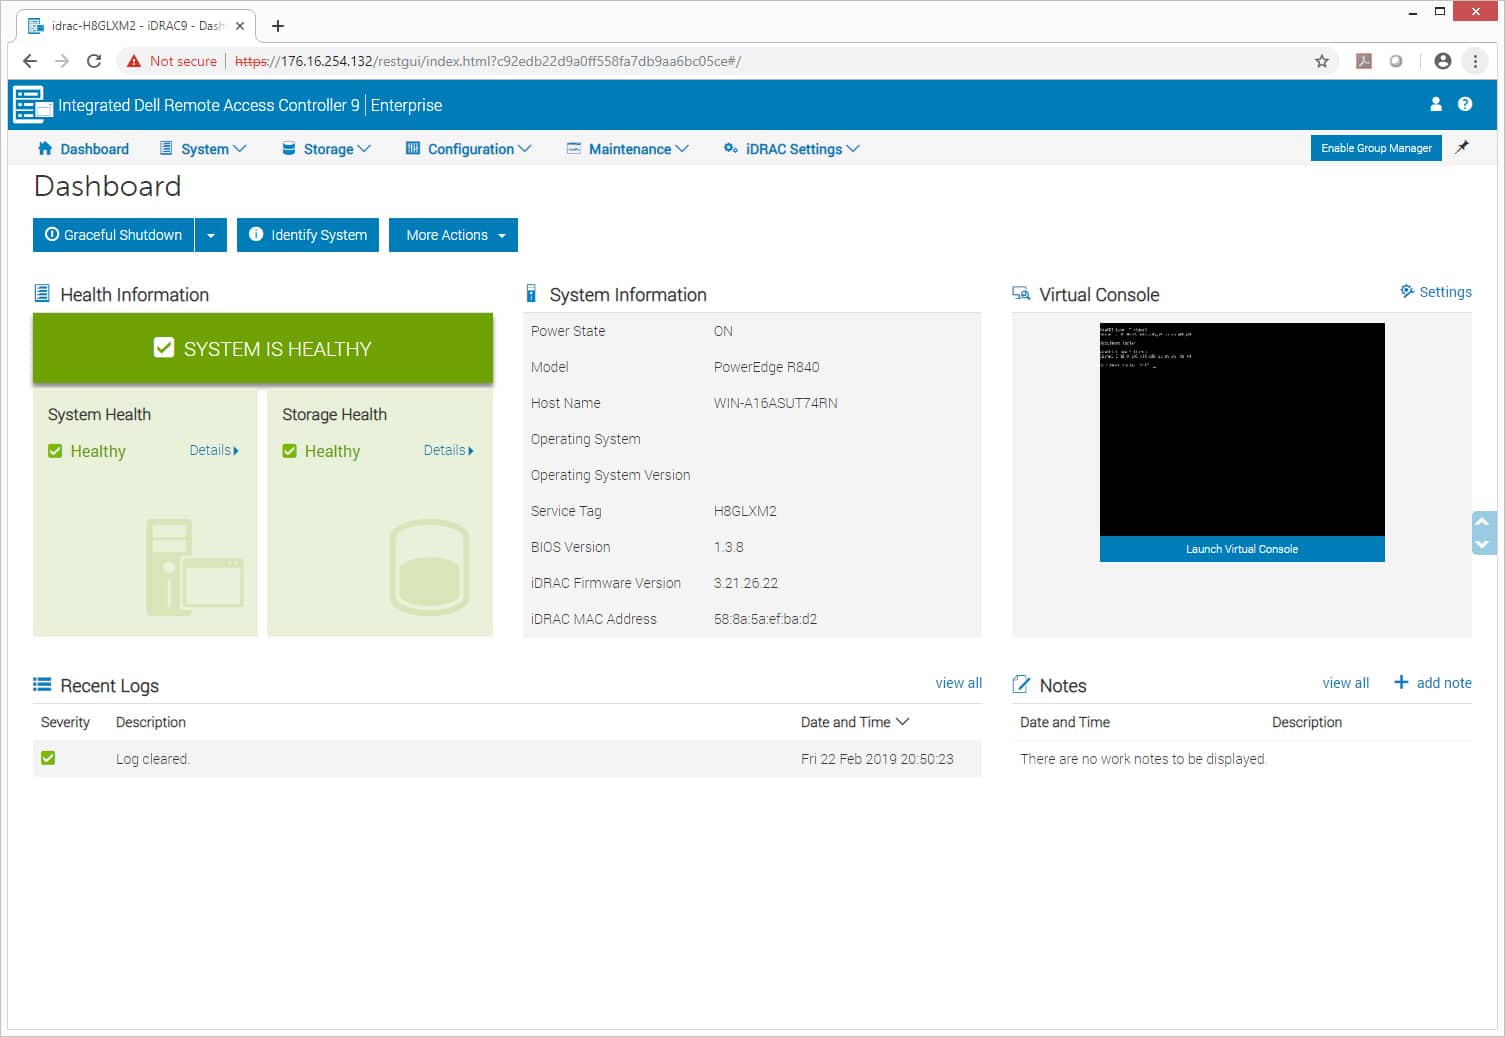
For management of the Dell EMC PowerEdge R840 the server offers Integrated Dell Remote Access Controller 9, iDRAC9. Through the iDRAC’s dashboard one can easily see the health of the system, its information, recent logs and notes, and a virtual console. The dashboard screen allows for a graceful shutdown and system ID. Across the top of the screen are the main tabs including System, Storage, Configuration, Maintenance, and iDRAC Settings.
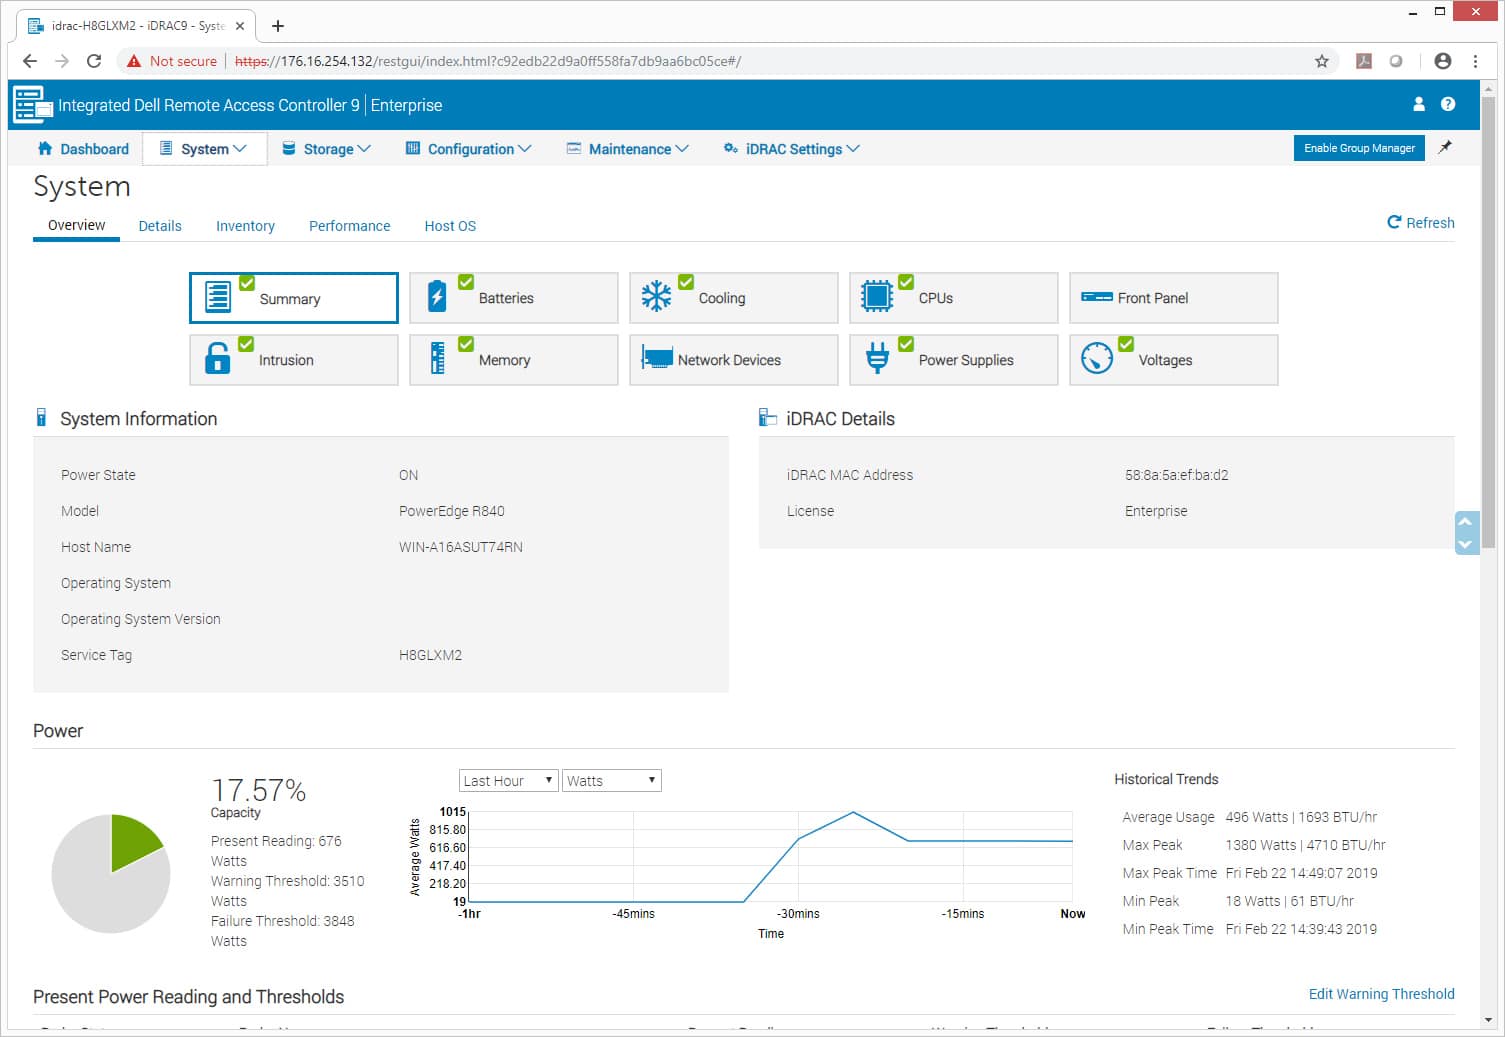
The Systems tab gives users multiple options for what aspects of the system they can look at but for this review we are focusing on Summary that allows us to get a quick overview of most parts of the system. We are greeted with details of the hardware, iDRAC, and we can see power and capacity usage.
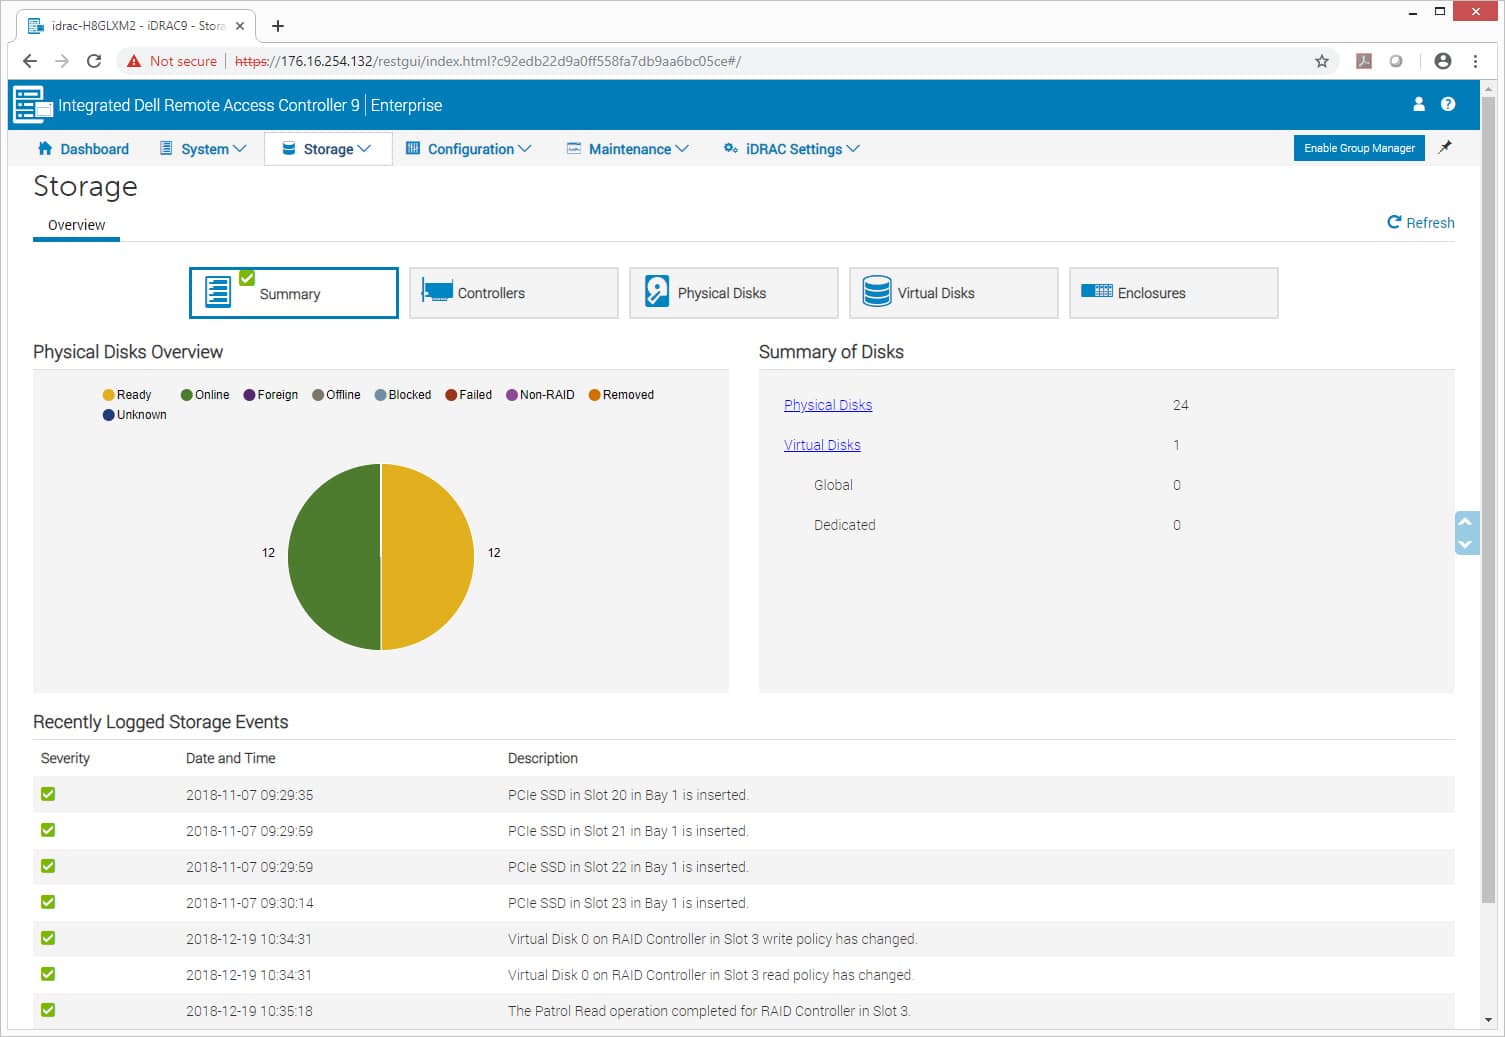
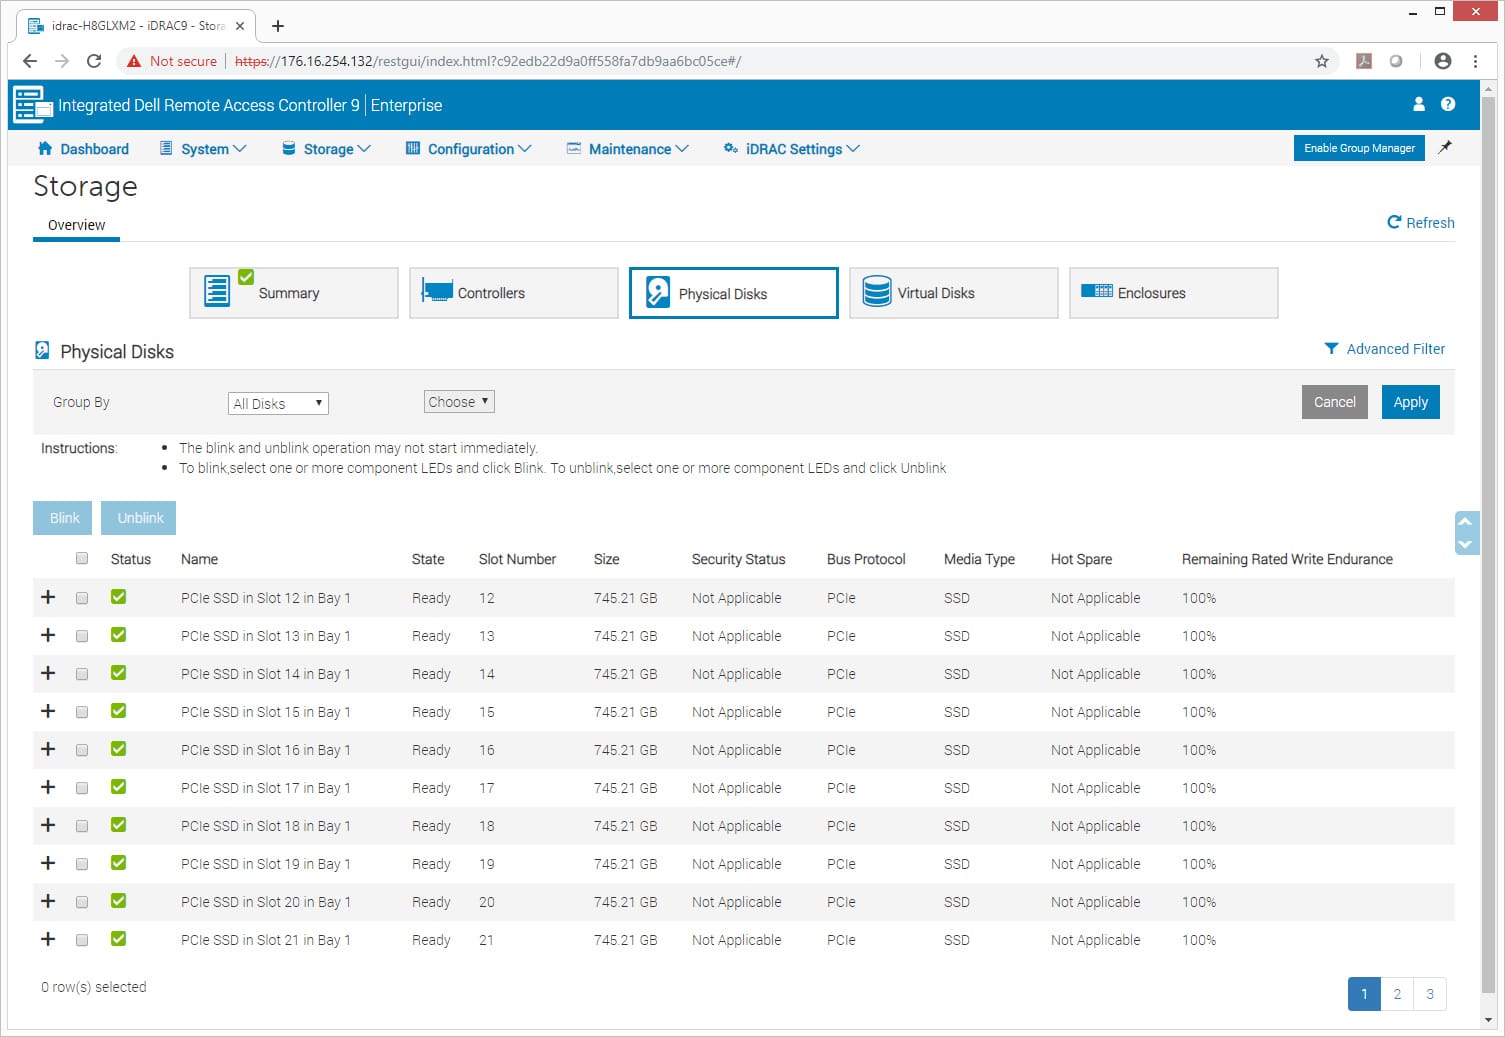
With the Storage tab users are once again given multiple options that they can drill down on including summary, controllers, physical disks, virtual disks, and enclosures. The summary sub-tab lets us see an overview of physical disks, and summary of both physical and virtual disks, and logged storage events.
Drilling down a bit further, under the physical disks sub-tab we see the status of the drives in the unit, their names, their state, slot number, capacity, security status, bus protocol, media type (SSDs in this case), whether or not they are a hot spare, and the remaining rated write endurance.
iDRAC continues to be the best integral server management tool on the market, giving both visibility and action item execution options to the system administrtor.
Performance
Testing Configuration
- 4 x Intel Xeon Platinum 8180M Processors (28 x 2.5GHz)
- 1.5TB 2666Mhz DDR4
- 12 x 3.2TB Memblaze PBlaze5 Mixed Use NVMe SSDs
- VMware ESXi 6.7u1 for SQL/Sysbench and Ubuntu 18.04.01 for bare-metal VDbench tests
SQL Server Performance
StorageReview’s Microsoft SQL Server OLTP testing protocol employs the current draft of the Transaction Processing Performance Council’s Benchmark C (TPC-C), an online transaction processing benchmark that simulates the activities found in complex application environments. The TPC-C benchmark comes closer than synthetic performance benchmarks to gauging the performance strengths and bottlenecks of storage infrastructure in database environments.
Each SQL Server VM is configured with two vDisks: 100GB volume for boot and a 500GB volume for the database and log files. From a system resource perspective, we configured each VM with 16 vCPUs, 64GB of DRAM and leveraged the LSI Logic SAS SCSI controller. While our Sysbench workloads tested previously saturated the platform in both storage I/O and capacity, the SQL test looks for latency performance.
This test uses SQL Server 2014 running on Windows Server 2012 R2 guest VMs, and is stressed by Dell’s Benchmark Factory for Databases. While our traditional usage of this benchmark has been to test large 3,000-scale databases on local or shared storage, in this iteration we focus on spreading out four 1,500-scale databases evenly across our servers.
SQL Server Testing Configuration (per VM)
- Windows Server 2012 R2
- Storage Footprint: 600GB allocated, 500GB used
- SQL Server 2014
- Database Size: 1,500 scale
- Virtual Client Load: 15,000
- RAM Buffer: 48GB
- Test Length: 3 hours
- 2.5 hours preconditioning
- 30 minutes sample period
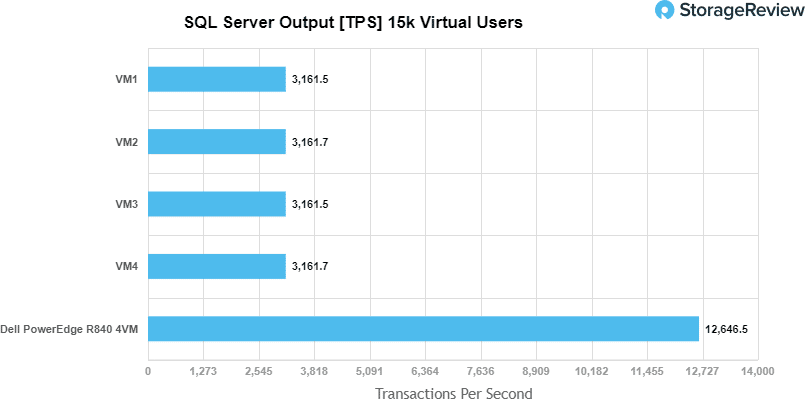
For our transactional SQL Server benchmark the R840 gave us an aggregate score of 12,646.5 TPS with individual VMs ranging from 3,161.5 to 3,161.7 TPS.
For SQL average latency the server had an impressive 1ms aggregate score as well as the score for all VMs.

Sysbench MySQL Performance
Our first local-storage application benchmark consists of a Percona MySQL OLTP database measured via SysBench. This test measures average TPS (Transactions Per Second), average latency, and average 99th percentile latency as well.
Each Sysbench VM is configured with three vDisks: one for boot (~92GB), one with the pre-built database (~447GB), and the third for the database under test (270GB). From a system resource perspective, we configured each VM with 16 vCPUs, 60GB of DRAM and leveraged the LSI Logic SAS SCSI controller.
Sysbench Testing Configuration (per VM)
- CentOS 6.3 64-bit
- Percona XtraDB 5.5.30-rel30.1
- Database Tables: 100
- Database Size: 10,000,000
- Database Threads: 32
- RAM Buffer: 24GB
- Test Length: 3 hours
- 2 hours preconditioning 32 threads
- 1 hour 32 threads
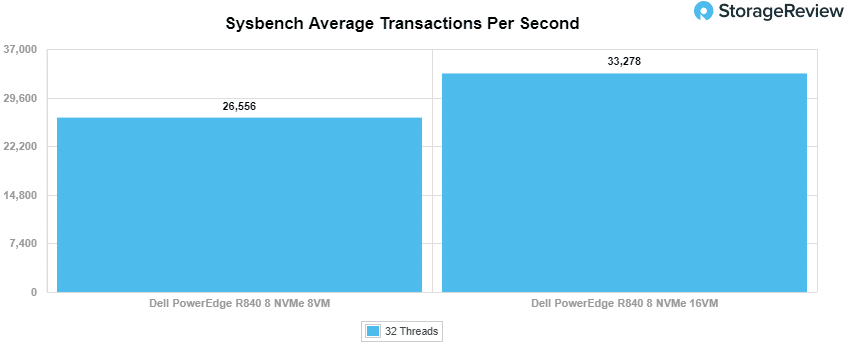
With the Sysbench OLTP we tested 8VM and 16VM with the R840 hitting 26,556 TPS and 33,278 TPS respectively. These numbers are incredible from a single 2U server, which comes directly from having quad Intel 8180M CPUs and up to 12 or 24 NVMe SSDs in a 2U package.
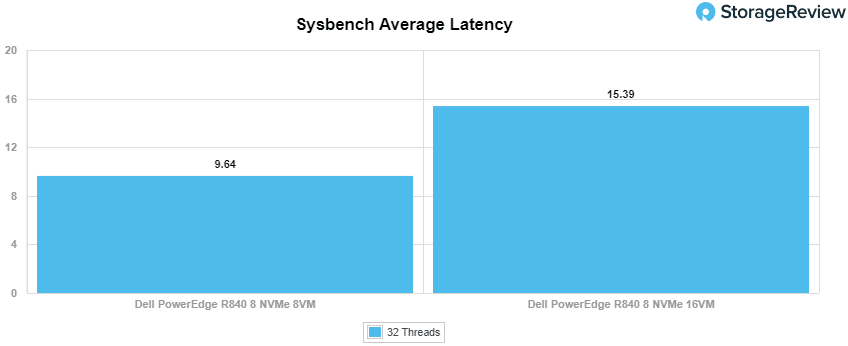
For Sysbench average latency the PowerEdge server gave us 9.6ms for 8VM and 15.4ms for 16VM.
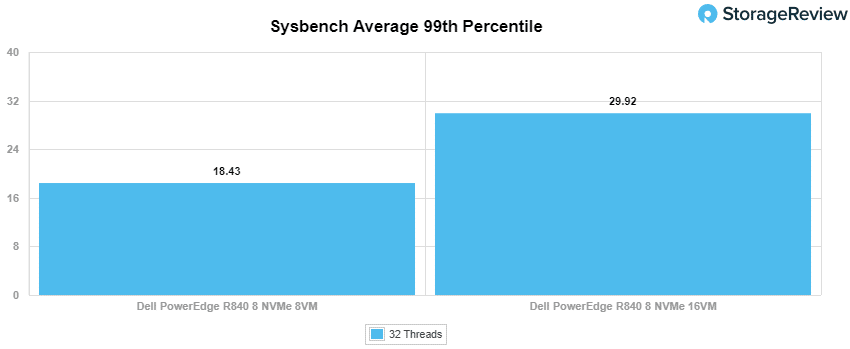
In our worst-case scenario (99th percentile) latency the R840 had the strong showing of 18.4ms for the 8VM and 29.9ms for the 16VM.
VDBench Workload Analysis
When it comes to benchmarking storage arrays, application testing is best, and synthetic testing comes in second place. While not a perfect representation of actual workloads, synthetic tests do help to baseline storage devices with a repeatability factor that makes it easy to do apples-to-apples comparison between competing solutions. These workloads offer a range of different testing profiles ranging from “four corners” tests, common database transfer size tests, as well as trace captures from different VDI environments. All of these tests leverage the common vdBench workload generator, with a scripting engine to automate and capture results over a large compute testing cluster. This allows us to repeat the same workloads across a wide range of storage devices, including flash arrays and individual storage devices.
Profiles:
- 4K Random Read: 100% Read, 128 threads, 0-120% iorate
- 4K Random Write: 100% Write, 64 threads, 0-120% iorate
- 64K Sequential Read: 100% Read, 16 threads, 0-120% iorate
- 64K Sequential Write: 100% Write, 8 threads, 0-120% iorate
- Synthetic Database: SQL and Oracle
- VDI Full Clone and Linked Clone Traces
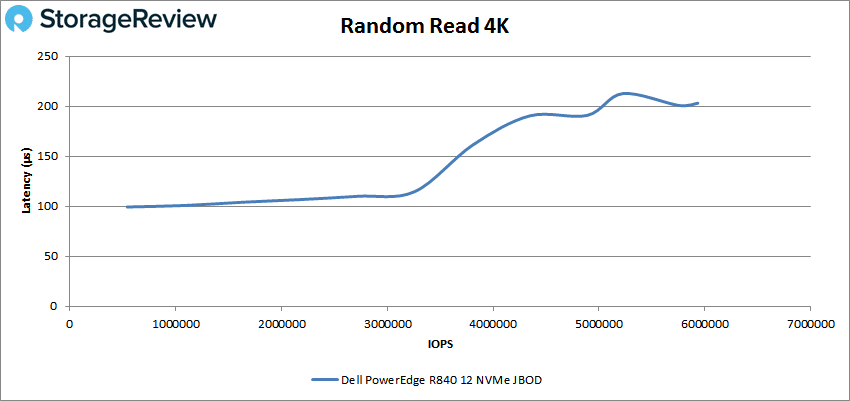
With 4K random read, the Dell EMC PowerEdge R840 started strong with at 543,298 IOPS and just under 100μs. The R840 went on to peak at 5,933,288 IOPS with a latency of only 203μs.
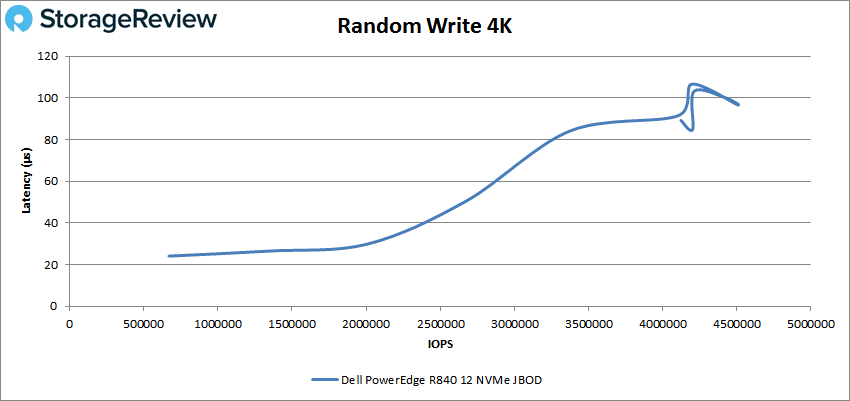
For 4K random write the server had a more impressive start at 669,974 IOPS and a latency of 24.1μs. The R840 stayed under 100μs until it went over 4 million IOPS. It peaked at 4,503,998 IOPS with 96.8μs latency before dropping off some.
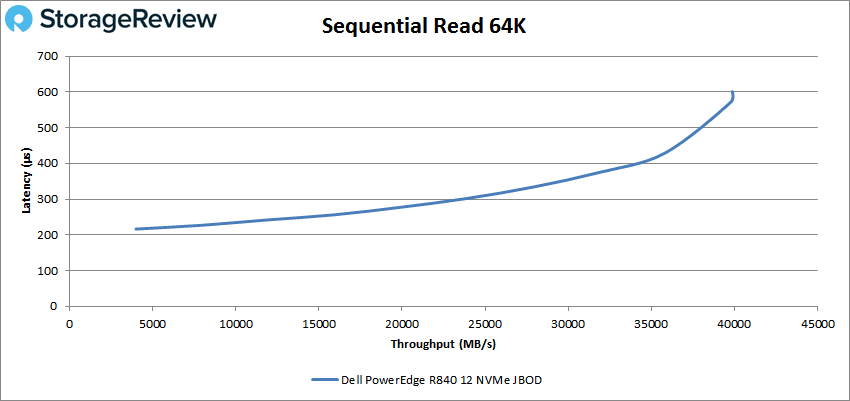
Switching over to sequential work, we see the R840 peak at 637,963 IOPS or 39.9GB/s at a latency of 60.7μs in 64K read.
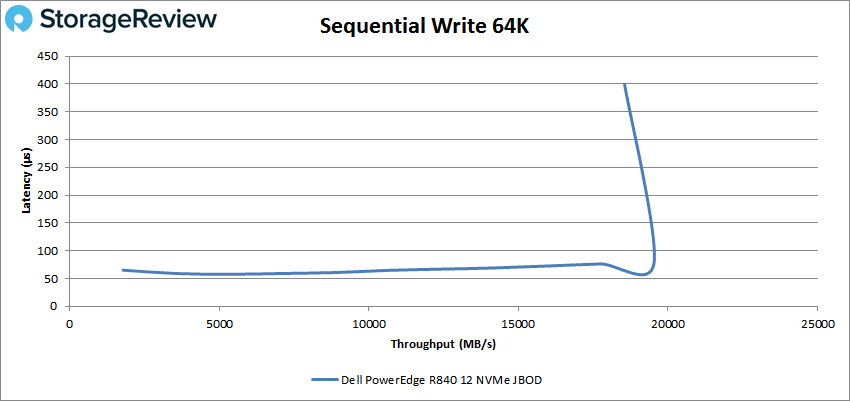
In 64K sequential write the server started with much lower latency with 65.1μs at 28,502 IOPS or 1.78GB/s. The server stayed below 100μs until about 312K IOPS or 19GB/s going on to end at 296,751 IOPS or 18.5GB/s at a latency of 400μs.
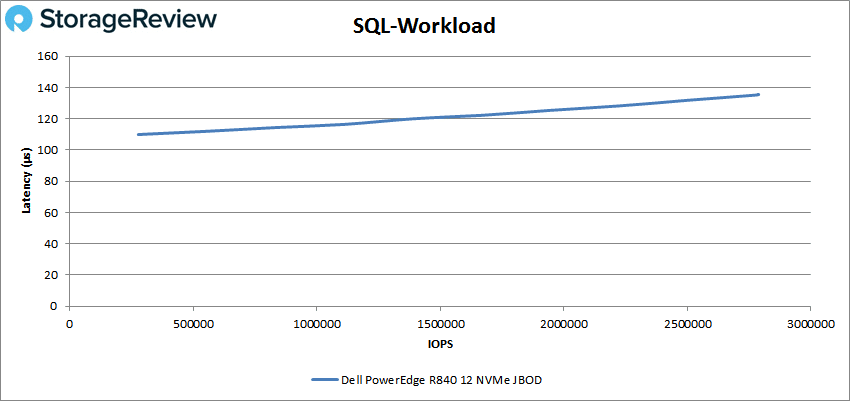
Are next set of tests are our SQL workloads: SQL, SQL 90-10, and SQL 80-20. For SQL the R840 hit a peak score of 2,780,783 IOPS at a latency of 135.2μs.
SQL 90-10 saw a peak performance of 2,613,286 IOPS with a latency of 144.5μs.

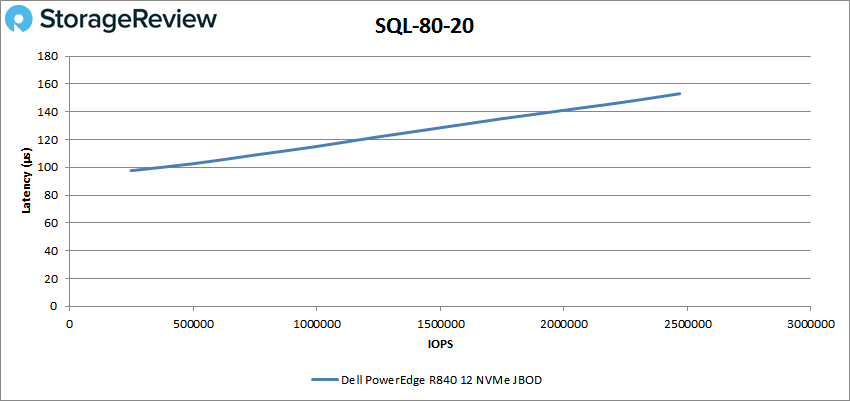
SQL 80-20 had the R840 start below 100μs at 248,460 and went on to peak at 2,468,464 IOPS at a latency of 153μs.
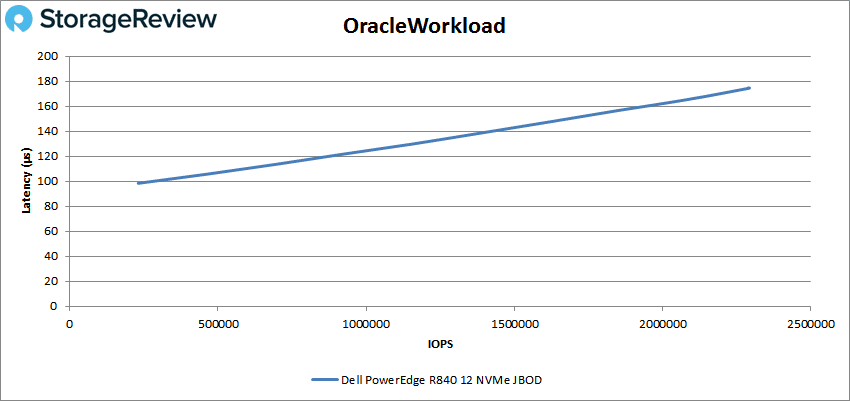
Our Oracle workloads showed more strong performance from the R840. Staring at just under 100μs the server went on to peak at 2,289,946 IOPS at a latency of 174.5μs.
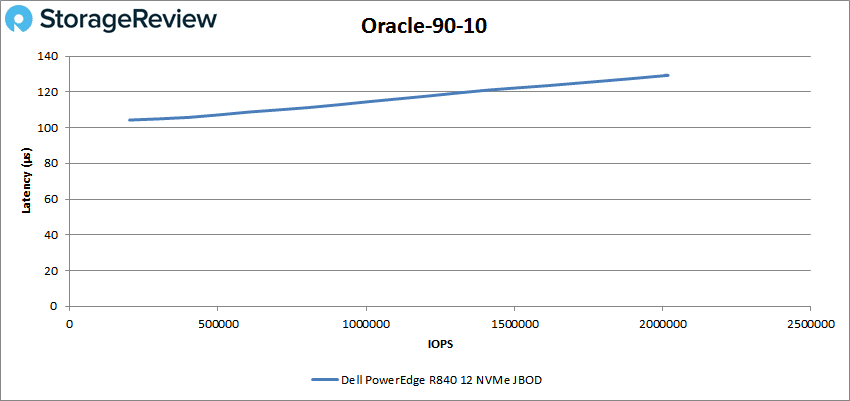
Oracle 90-10 had the server peak at 2,017,515 IOPS with a latency of 129.3μs a difference of only 25μs from start to finish.
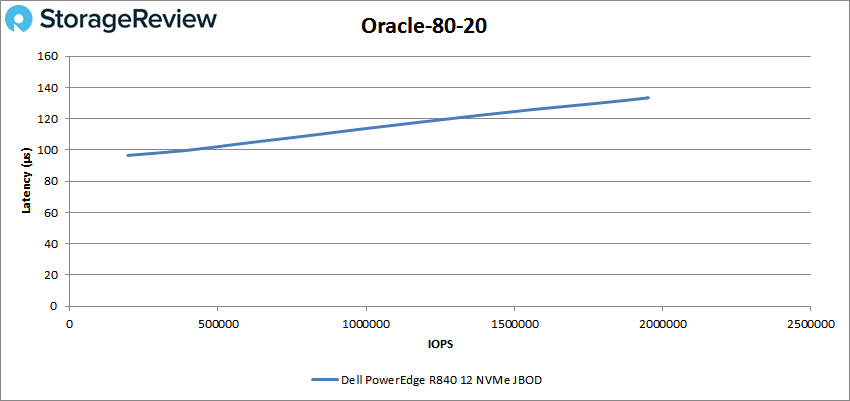
With Oracle 80-20 the R840 started off under 100μs and peaked at 1,952,348 IOPS with a latency of 133.4μs.
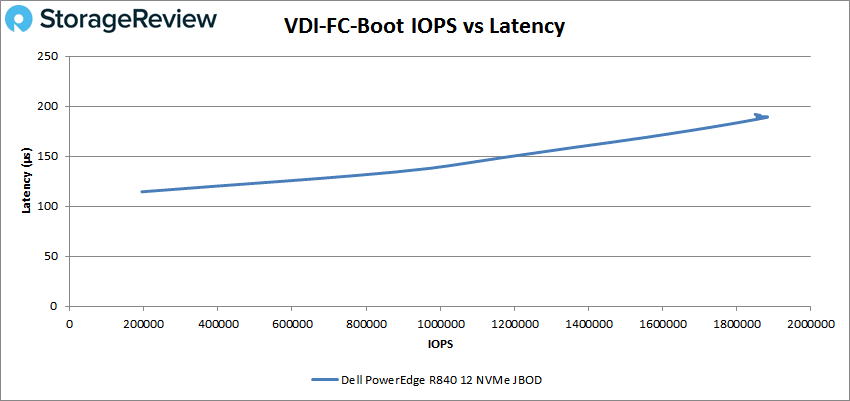
Next, we switched over to our VDI clone test, Full and Linked. For VDI Full Clone (FC) Boot, the R840 peaked at 1,880,908 IOPS with a latency of 189.4μs.
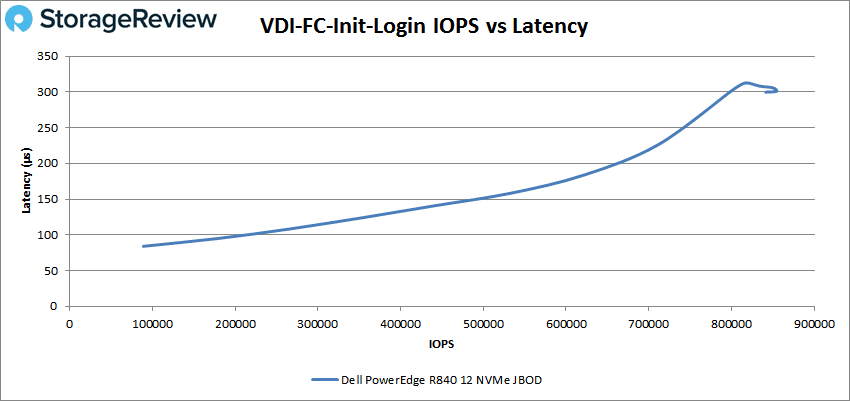
VDI FC Initial Login saw the server begin under 100μs and go on to peak at 854,707 IOPS with a latency of 301.1μs.
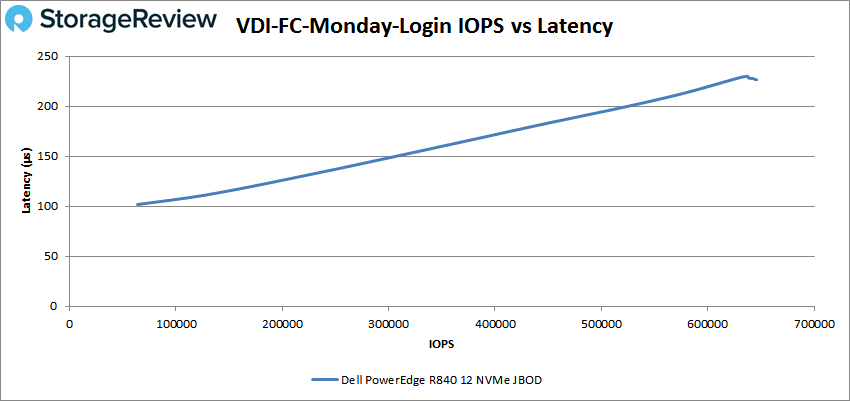
For VDI FC Monday Login the server started just over 100μs and went on to peak at 645,932 IOPS with a latency of 227μs.
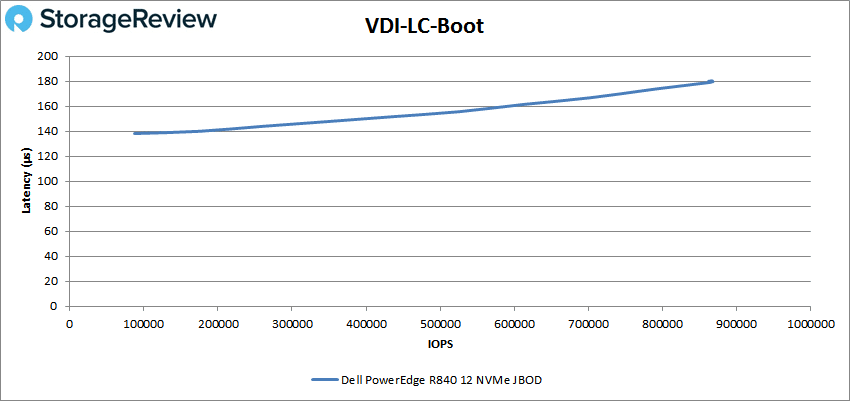
Switching over to VDI Linked Clone (LC) tests, the R840 peaked at 865,365 IOPS with a latency of 179.2μs.
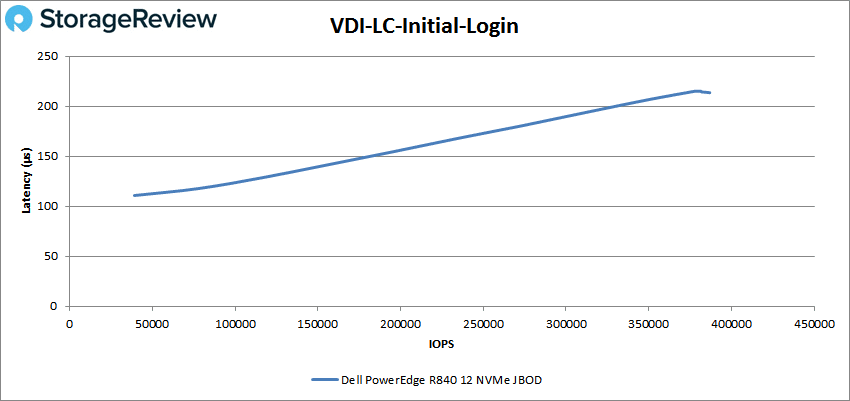
For VDI LC Initial Login the server had a peak score of 384,397 IOPS with a latency of 213.6μs.
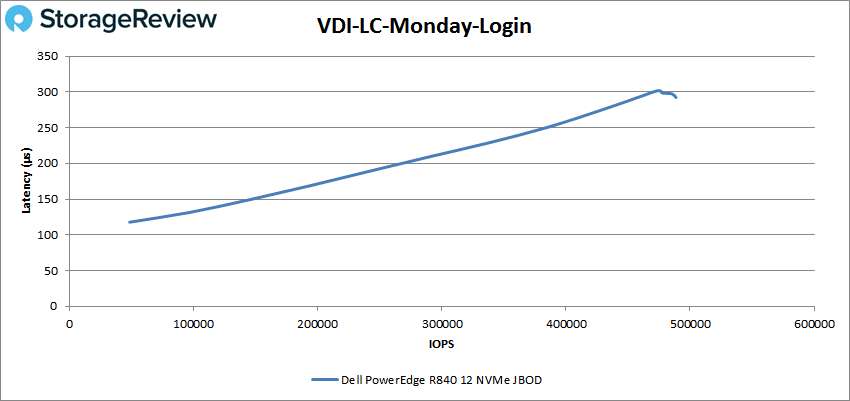
And finally for VDI LC Monday Login the R840 had a peak score of 487,261 IOPS at a latency of 295.1μs.
Conclusion
The Dell EMC PowerEdge R840 is a 2U server aimed at applications that need high-performance or for users with data-intensive workloads. On the top end the server can be outfitted with four Intel Xeon Scalable CPUs for up to 112 cores, up to 6TB of RAM, up to 24 direct attached NVMe SSDs and up to two double-wide GPUs or FPGAs. All this powerful hardware is ideal for those that need to run the new breed of emerging AI and/or ML workloads. The R840 comes with Dell EMC OpenManage to automate routine tasks saving admins time and energy and they can monitor the server from afar with QuickSync 2. System management is done via iDRAC which continues to be the best server management platform out there.
From a performance perspective, the server delivered on the potential of its hardware. With our Applications Analysis Workloads the Dell EMC PowerEdge R840 showed a strong SQL server performance with an aggregate transactional score of 12,646. TPS with an aggregate average latency of only 1ms. For Sysbench, the server continued to impress with transactional scores of 26,556 TPS for 8VM and 33,278 TPS for 16VM. For latencies, the R840 saw averages of 9.6ms and 15.4ms, and worst case scenarios of 18.4ms and 29.9ms for 8VM and 16VM respectively.
Looking at our VDBench workloads the PowerEdge R840 again impressed in most categories. Peak performance highlights include 6 million IOPS in 4K read, 4.5 million IOPS in 4K write, 18.5GB/s in 64K write, and 39.9GB/s in 64K read. For SQL workloads the server continued in its multi-millions of IOPS with peak scores of 2.8 million IOPS, 2.6 million IOPS in SQL 90-10, and 2.5 million IOPS in SQL 80-20. Oracle workloads also had impressive peak performances of 2.3 million IOPS, 2 million IOPS for 90-10, and 2 million IOPS for 80-20. The R840 also had a 1.9 million IOPS peak performance in VDI FC boot. While these peak numbers are high, the latency needs to be taken into consideration as well. The highest peak latency in any of our tests was only 400μs. The lowest peak performance was 60.7μs.
We often hear vendors talk about multi-million IOPS performance with sub-millisecond; these numbers typically come from ideal test conditions and not what normal users can expect from actual usage. It’s a delight to see such massive performance in our testing, not only extremely high peak performance but extremely low latencies as well. After several weeks working with the Dell EMC PowerEdge R840 server, it’s clear that it provides the best combination of performance, rock-solid engineering and comprehensive system management in the 2U server category and a StorageReview Editor’s Choice.


 Amazon