

The Ultrastar SN100 Series of enterprise SSDs is HGST’s first foray into NVMe drives, with their prior work being centered on the SAS interface. The family of drives is broken into two categories, the SN100 referring to the 2.5″ form factor and the SN150 meaning half-height half-length add-in-card (AIC) form factor. In either shape the drives are designed to meet the most demanding workloads with an emphasis in cloud, hyperscale and enterprise applications. The SN100 Series comes in capacities up to 3.2TB and offers read throughput of up to 3GB/s (seq 128k) and random read and write IOPS of 743,000 and 140,000 respectively.
The SN150 AIC drives are available in 1.6TB and 3.2TB capacities, the 2.5″ form factor adds an 800GB capacity as well. All of the drives build on HGST’s lengthy history of delivering quality enterprise flash solutions and include; UEFI boot support, advanced power management, and enterprise-grade reliability thanks to features like flash-aware RAID, end-to-end data-path protection, advanced ECC and power fail protection. The drives carry a five-year warranty and support an endurance figure of three drive writes per day.
Our review unit is the 3.2TB capacity of the SN150 AIC.
HGST Ultrastar SN100 Series NVMe SSD Specifications
- Interface: PCIe 3.0 x4:
- Form Factor:
- HH-HL add-in card
- SFF 2.5-inch drive
- Capacities (GB):
- 3200 / 1600 (AIC)
- 800 (2.5 inch)
- Performance
- Read Throughput (max MB/s, sequential 128k): 3000
- Write Throughput (max MB/s, sequential 128k): 1600
- Read IOPS (max IOPS, random 4k): 743,000
- Write IOPS (max IOPS, random 4k): 140,000
- Mixed IOPS (70/30 R/W, random 4k): 310,000
- Read IOPS (max IOPS, random 8k): 385,000
- Write IOPS (max IOPS, random 8k): 75,000
- Latency 512B (µs): 20
- Reliability
- MTBF (M hours): 2
- Annual Failure Rate (AFR): 0.44%
- Endurance: 3 DW/D
- Power Consumption (active/idle): 25 Watts / 8 Watts
- Operating Temperature: 0° to 55°C
- Non-Operating Temperature: -40° to 70°C
- Airflow (LFM): 300
- Warranty: 5 years
Design and build
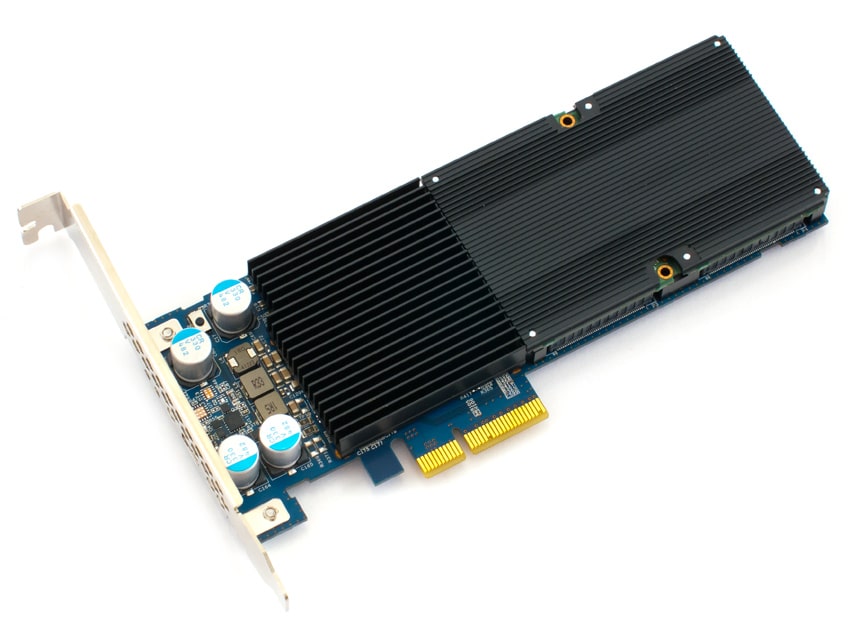
The HGST Ultrastar SN150 is of the half-height, half-length PCIe x4 form factor. The card itself is does not use any branding and is vacant of any drive information on the front side.
A heat sink covers the majority of the drive; with this design, any heat generated by the card will be dissipated via forced convection. HGST indicates that the airflow should exhaust toward the bracket end of the card. In addition, the SN150 has multiple on-board temperature sensors, which monitor the critical components of the drive. If an issue is detected, it will trigger the thermal throttling system to prevent damage due to overheating.
The PCIe 3.0 x4 interface is located along the bottom of the SN150 AIC.
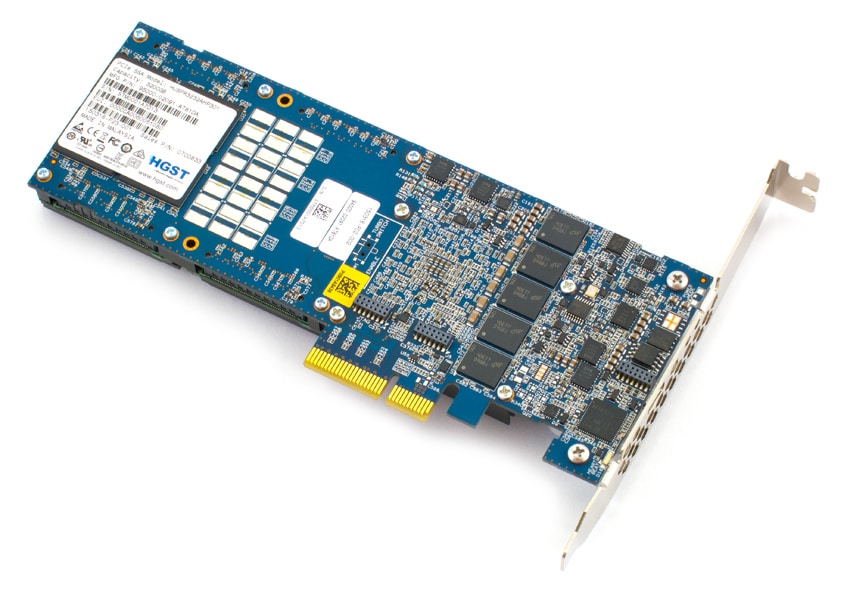
On the opposite side of the heat sink we can see the four NAND packages, each of which leverages A19nm eMLC NAND technology, beneath the sticker with the device information on it. We can also see the Micron DRAM.
Testing Background and Comparables
The StorageReview Enterprise Test Lab provides a flexible architecture for conducting benchmarks of enterprise storage devices in an environment comparable to what administrators encounter in real deployments. The Enterprise Test Lab incorporates a variety of servers, networking, power conditioning, and other network infrastructure that allows our staff to establish real-world conditions to accurately gauge performance during our reviews.
We incorporate these details about the lab environment and protocols into reviews so that IT professionals and those responsible for storage acquisition can understand the conditions under which we have achieved the following results. None of our reviews are paid for or overseen by the manufacturer of equipment we are testing. Additional details about the StorageReview Enterprise Test Lab and an overview of its networking capabilities are available on those respective pages.
We tested the HGST SN100 while comparing it to the following other AIC NVMe SSDs:
- Memblaze PBlaze4 3.2TB
- Intel DC P3608 1.6TB
- Huawei ES3000v2 3.2TB
- Huawei ES3000v1 1.6TB
Application Workload Analysis
In order to understand the performance characteristics of enterprise storage devices, it is essential to model the infrastructure and the application workloads found in live production environments. Our first benchmarks for the HGST Ultrastar SN100 are therefore the MySQL OLTP performance via SysBench and Microsoft SQL Server OLTP performance with a simulated TCP-C workload. For our application workloads each drive will be running 2-4 identically configured VMs.
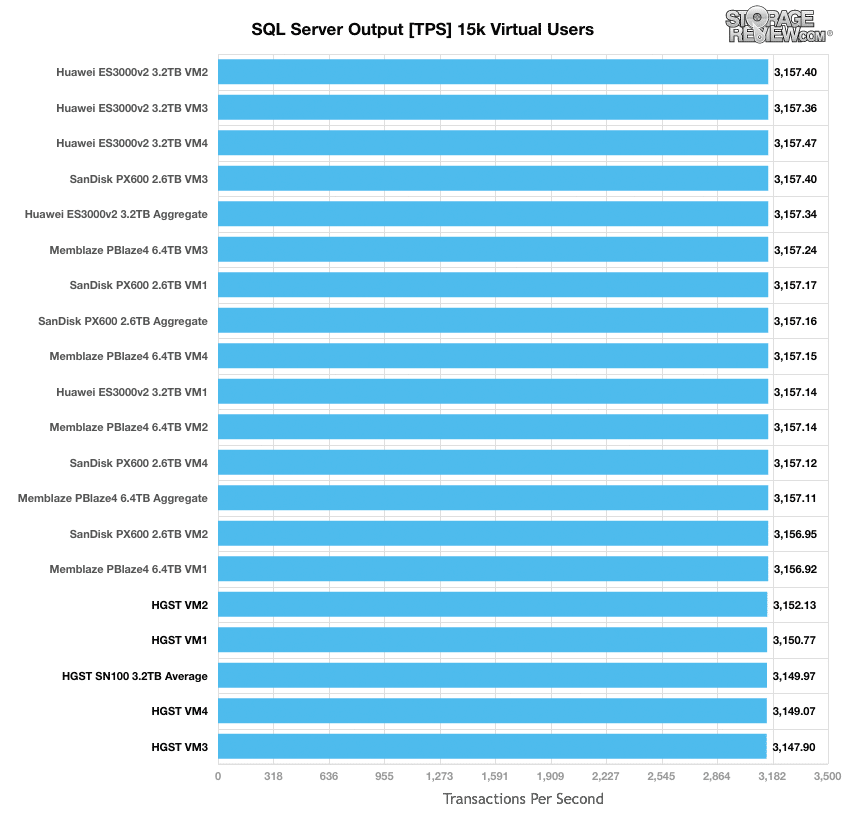
StorageReview’s Microsoft SQL Server OLTP testing protocol employs the current draft of the Transaction Processing Performance Council’s Benchmark C (TPC-C), an online transaction processing benchmark that simulates the activities found in complex application environments. The TPC-C benchmark comes closer than synthetic performance benchmarks to gauging the performance strengths and bottlenecks of storage infrastructure in database environments. Each instance of our SQL Server VM for this review uses a 333GB (1,500 scale) SQL Server database and measures the transactional performance and latency under a load of 15,000 virtual users.
When looking at SQL Server Output, the HGST drive showed results at the bottom of the leaderboard with a top TPS of 3,152.13 with an aggregate of 3,149.97 TPS.
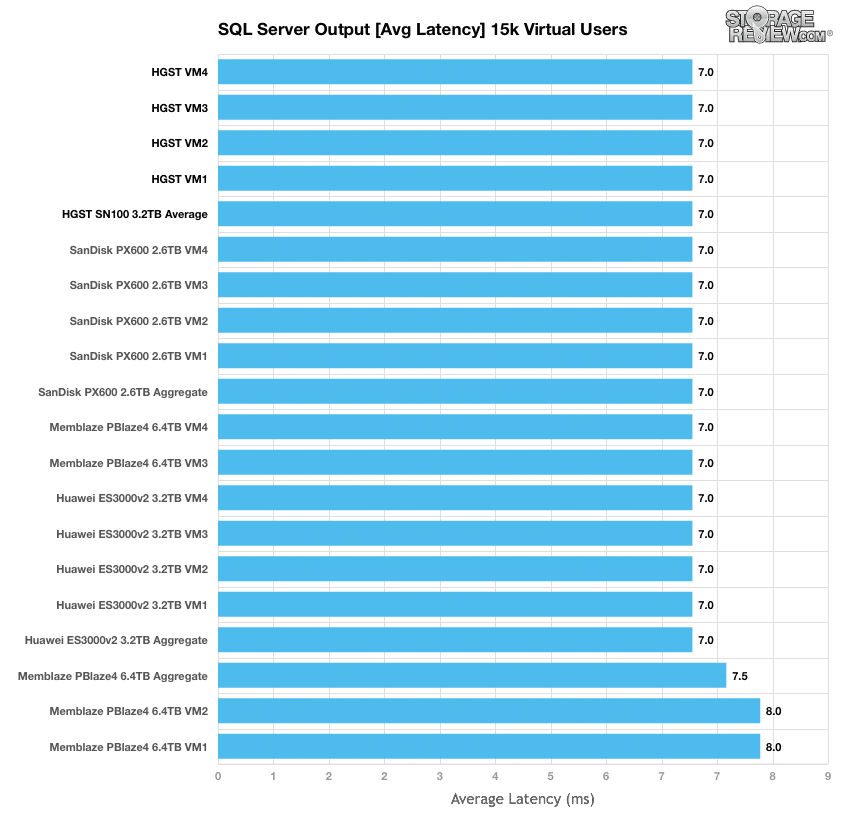
Looking at average latency results during the 15k user SQL Server benchmark showed the HGST drive at the top of the leaderboard with the SanDisk, Memblaze and Huawei SSDs (all of which posted 7.0ms).
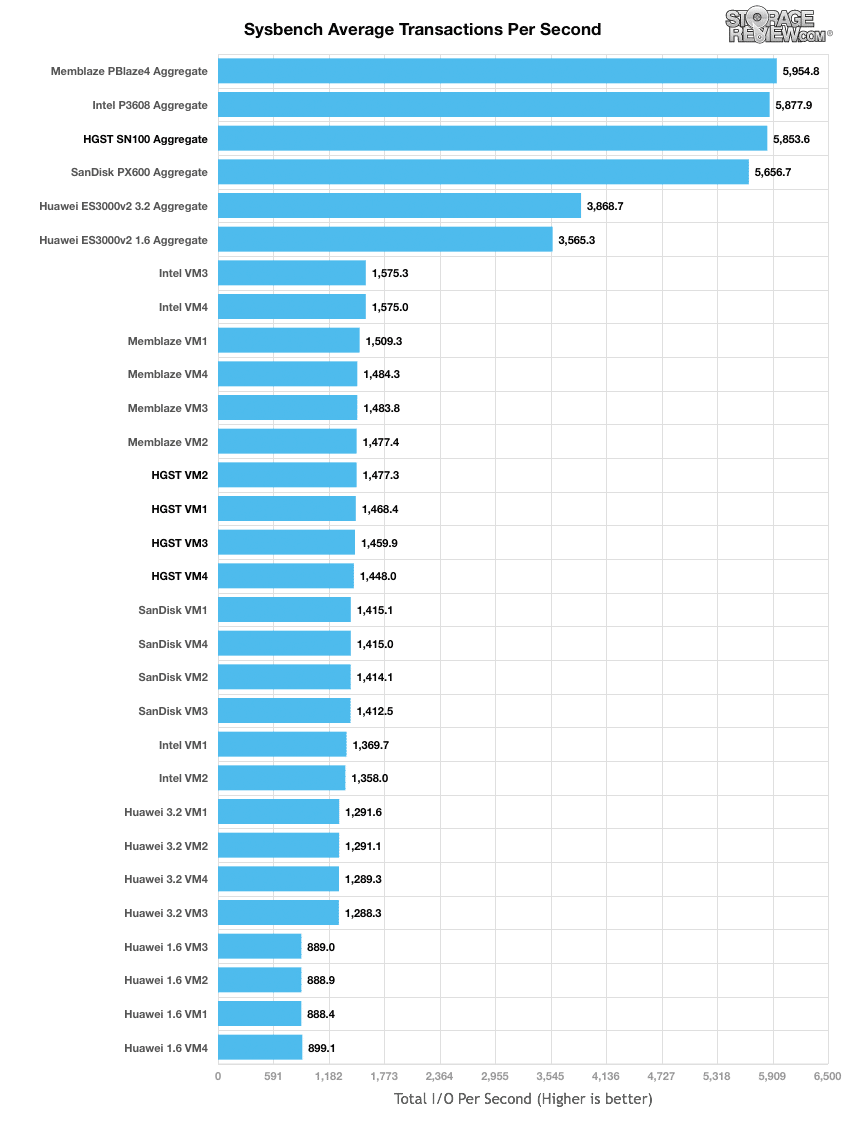
The next application benchmark consists of a Percona MySQL OLTP database measured via SysBench. This test measures average TPS (Transactions Per Second), average latency, as well as average 99th percentile latency. Percona and MariaDB are using the Fusion-io flash-aware application APIs in the most recent releases of their databases, although for the purposes of this comparison we test each device in their “legacy” block-storage modes.
In the average transactions per second benchmark, the HGST was near the top of the leaderboard and just behind the Memblaze and Intel drives with 5,853.6 TPS in aggregate. Individual VMs ranged from 1,477.3 TPS to 1,448.0 TPS.
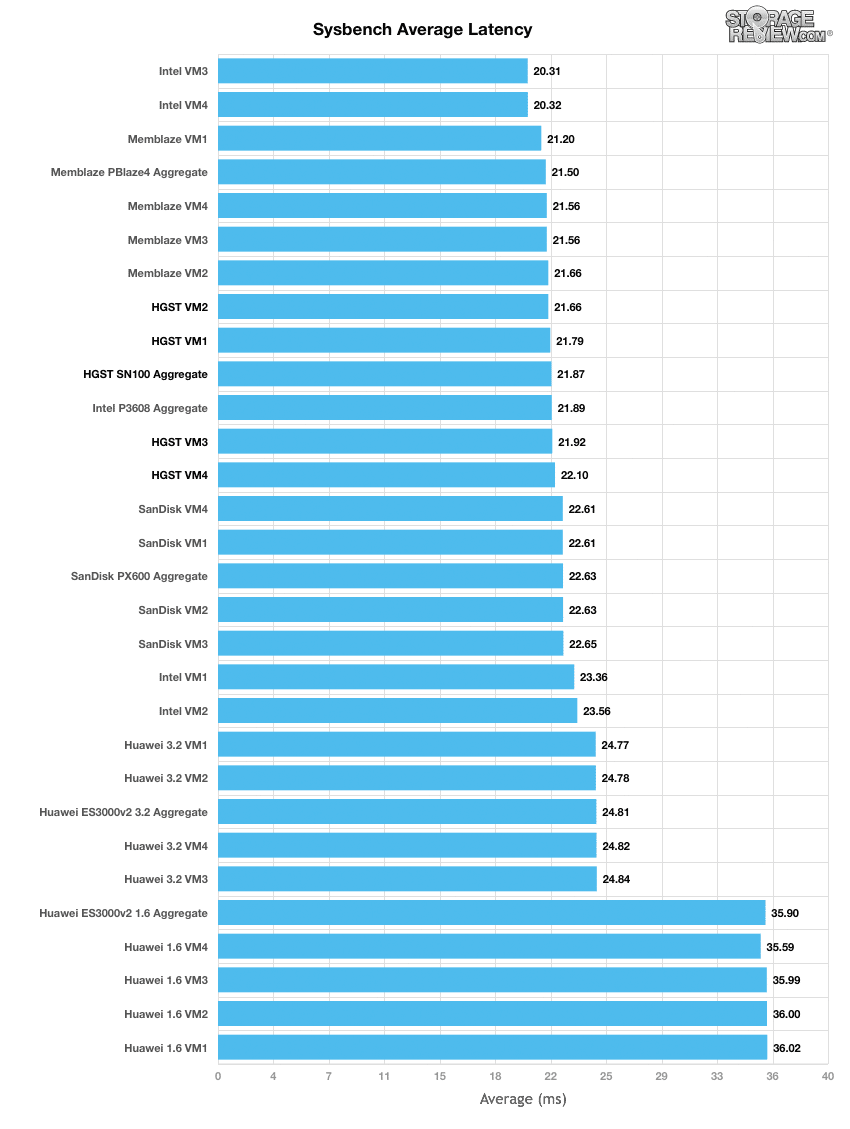
When looking at average latency results, the HGST boasted fairly good results, with individual VMs running between 21.66ms through 22.10ms and aggregate latency of 21.87ms.
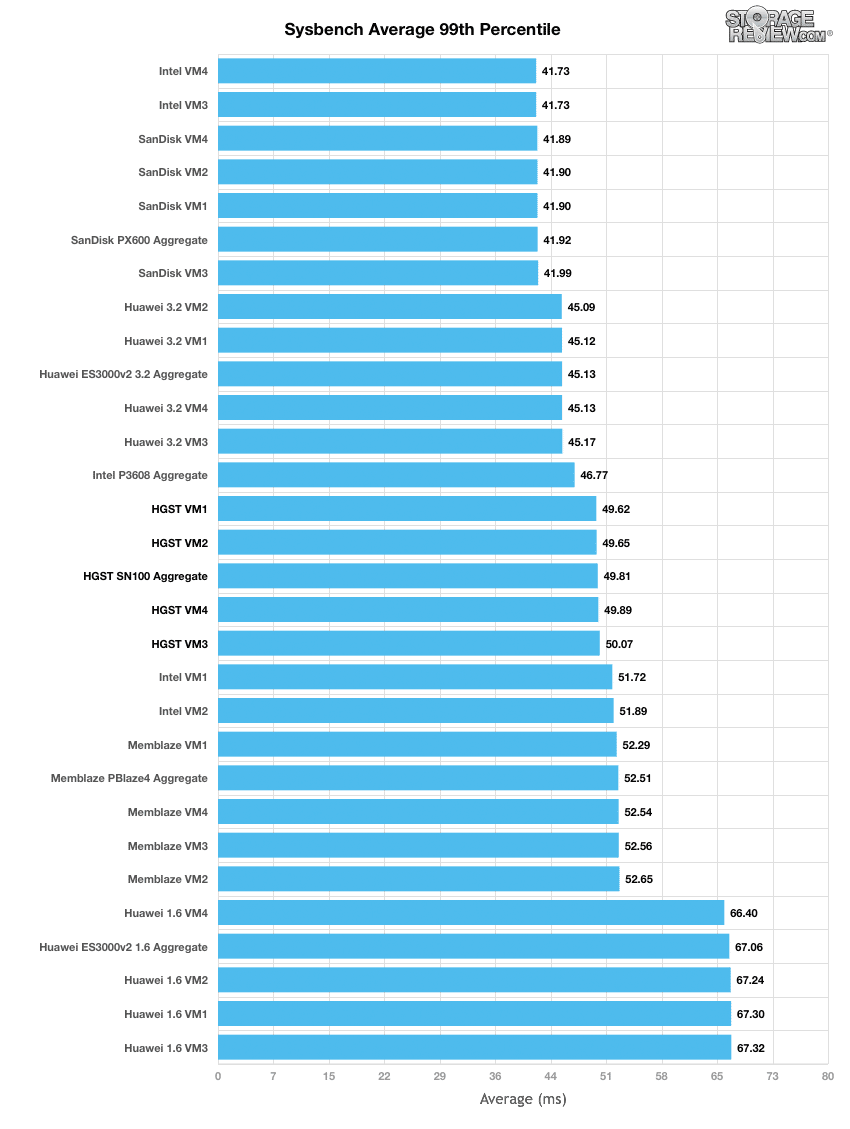
In terms of our worst-case MySQL latency scenario (99th percentile latency), the HGST showed VMs running between 49.62ms and 50.07ms (with an aggregate of 49.81ms) while the top performing SanDisk drive boasted an impressive aggregate of just 41.92ms.
Enterprise Synthetic Workload Analysis
Flash performance varies as the drive becomes conditioned to its workload, meaning that flash storage must be preconditioned before each of the fio synthetic benchmarks in order to ensure that the benchmarks are accurate. Each of the comparable drives are secure erased using the vendor’s tools and preconditioned into steady-state with a heavy load of 16 threads and an outstanding queue of 16 per thread.
- Preconditioning and Primary Steady-State Tests:
- Throughput (Read+Write IOPS Aggregate)
- Average Latency (Read+Write Latency Averaged Together)
- Max Latency (Peak Read or Write Latency)
- Latency Standard Deviation (Read+Write Standard Deviation Averaged Together)
Once preconditioning is complete, each device is then tested in intervals across multiple thread/queue depth profiles to show performance under light and heavy usage. Our synthetic workload analysis for the Memblaze PBlaze4 uses two profiles, which are widely used in manufacturer specifications and benchmarks. It is important to take into consideration that synthetic workloads will never 100% represent the activity seen in production workloads, and in some ways inaccurately portray a drive in scenarios that wouldn’t occur in the real world.
- 4k
- 100% Read and 100% Write
- 8k
- 70% Read/30% Write
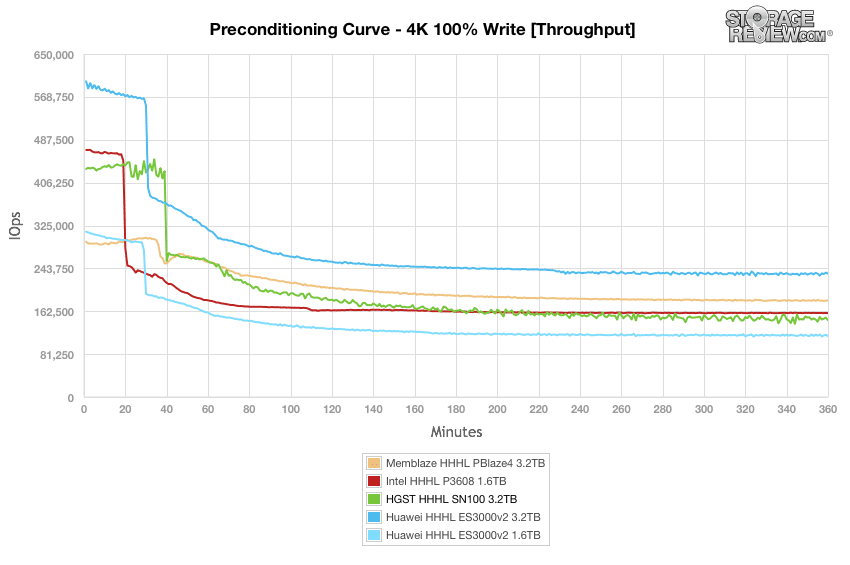
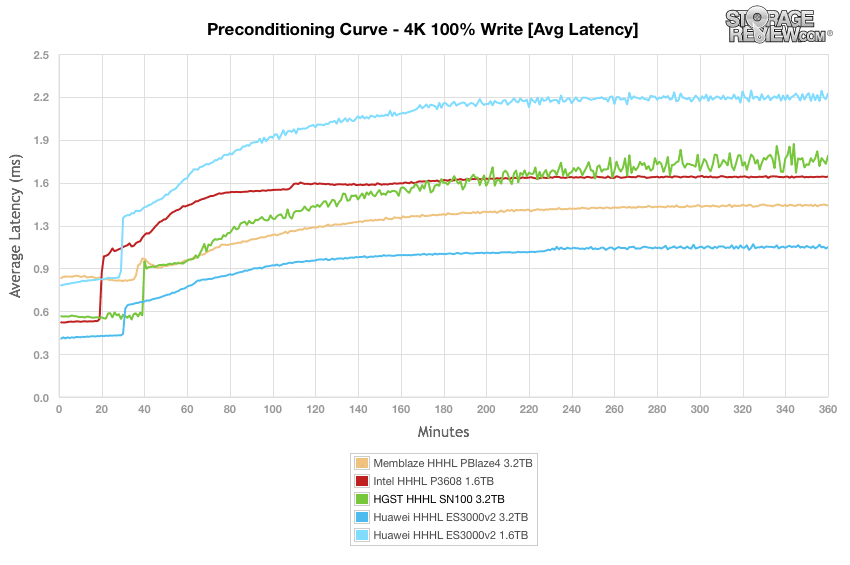
In our throughput 4k write preconditioning test, the HGST started at roughly 440,000 IOPS while hitting somewhat of a steady-state around 160,000 IOPS mark. The top overall performing drive here was the Huawei 3.2TB drive.
Next we look at average latency where the least consistent drive was mostly the HGST, as it had the largest latency spikes during the majority of the test. The top drive here was the Huawei 3.2TB once again, with a steady state that measured just over 1.0ms.
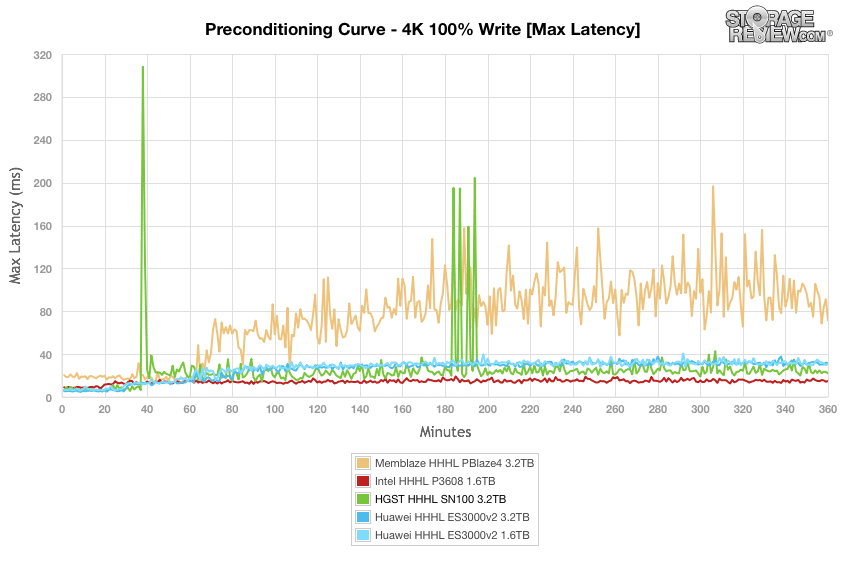
When measuring max latency, the HGST was one of the more inconsistent drives due to some serious spikes at several points during the test (though it did end up with the 2nd lowest latency by the end). Overall, the Intel drive showed the best performance.
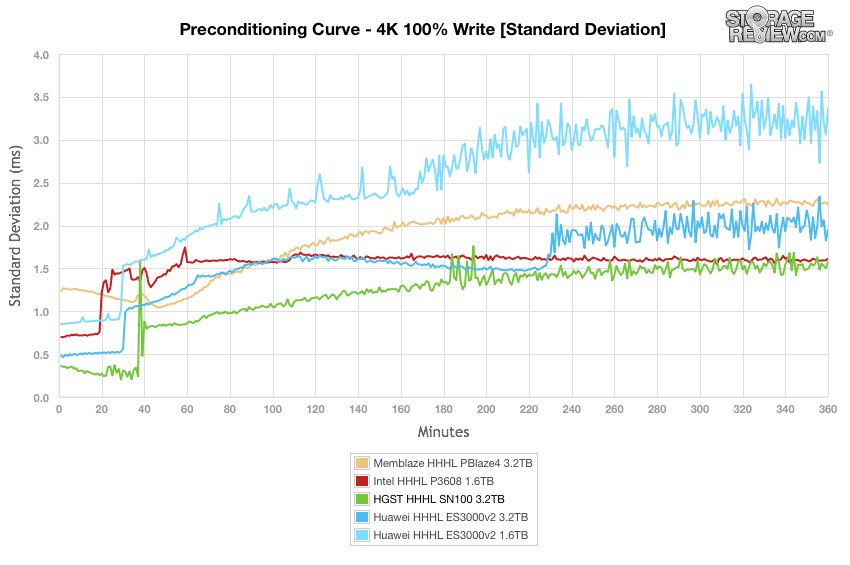
Standard deviation calculations is designed make it easier visualize the consistency of the SSD latency performance results. In this scenario, readings were quite inconsistent across the board. Though it had a few noticeable spikes along the way, the HGST actually had the best latency by the end of the test. The Intel had the most stable results overall, hovering under 1.6ms in its stable-state.
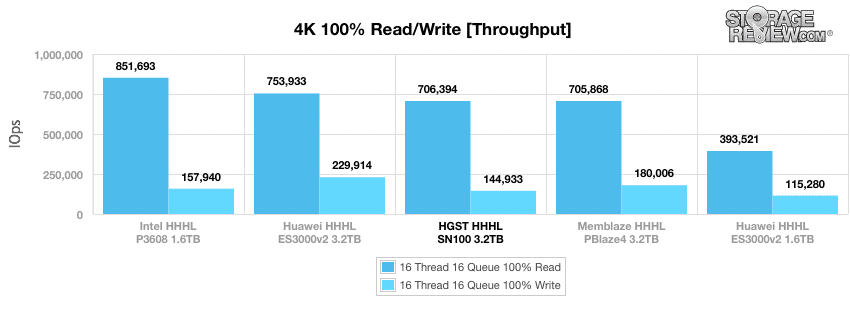
Now that the drives have been pre-conditioned, we will look the primary 4k synthetic benchmark. In throughput, the HGST showed middle of the pack results with 706,394 IOPS read and 144,933 IOPS write. Intel drive was by the top performer in the read column with an impressive 851,693 IOPS (reaching 157,940 IOPS write) while the Huawei 3.2TB drive showed the best write performance with 229,914 IOPS.
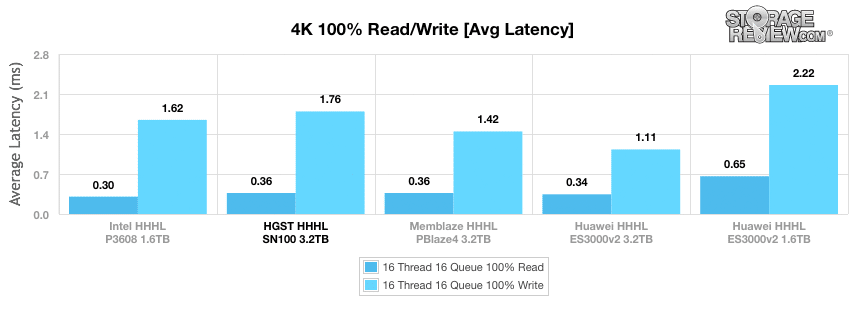
Looking at average latency showed the HGST drive with the 0.36ms read and 1.76ms write. The Intel posted the best average latency in reads with 0.30ms while the Huawei 3.2TB drive posted the best write latency with 1.11ms.
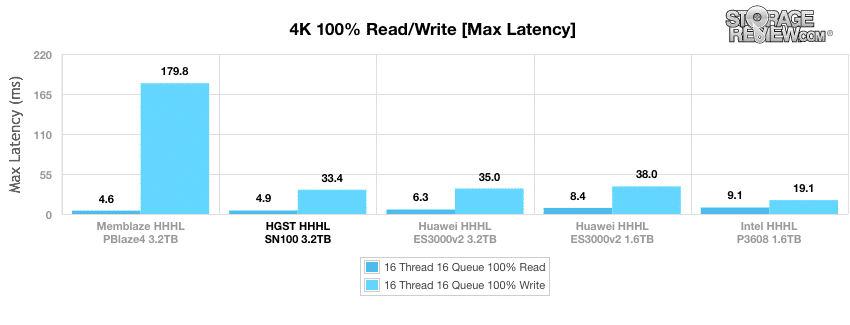
In max latency, the HGST drive posted impressive results with 4.9ms read and 33.4ms write. The top performer in reads was the Memblaze drive with 4.6ms; however, it had significantly higher write latency.
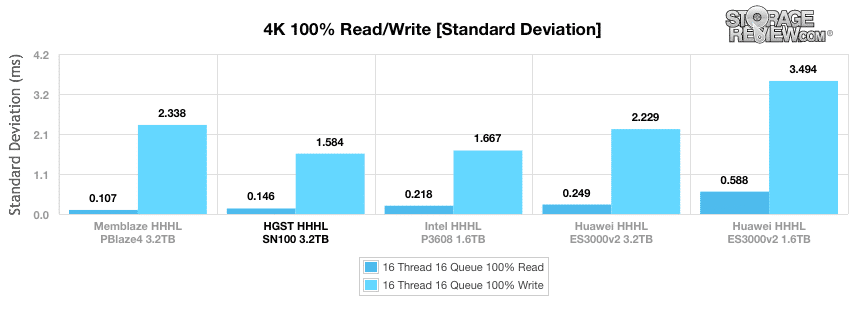
Looking at standard deviation shows the HGST with impressive results once again, boasting 0.146ms read and 1.584ms write, the latter which was the top write latency among the tested drives. The top performer in reads was the Memblaze drive, which boasted 0.107ms in reads.
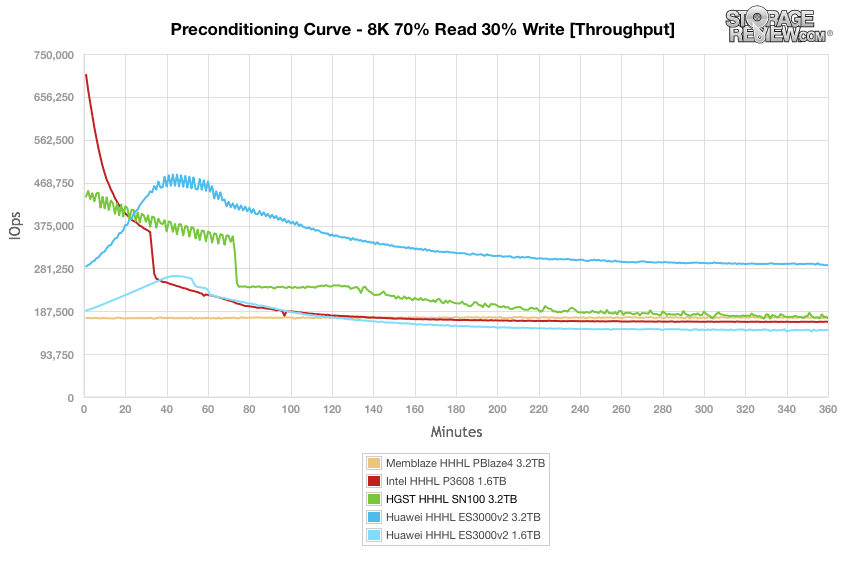
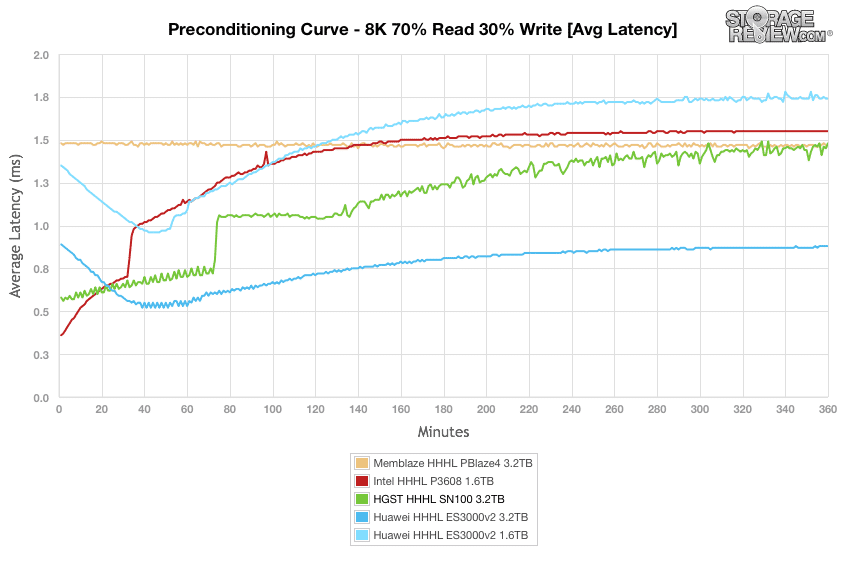
Our next workload uses 8k transfers with a ratio of 70% read operations and 30% write operations. Again, we will start off with the preconditioning results before switching to the main tests. In throughput, the HGST drive showed inconsistent performance through the 80 minute mark, with burst speeds reaching roughly 460,000 IOPS. It ended up with somewhat of a steady-state around 187,000 IOPS where most of the drives ended up as well. The most stable drive by far was the Memblaze.
Next we look at average latency where the least consistent drive was the HGST, though it had the second best average latency by the end of the test. The top drive here was the Huawei 3.2TB once again, with a terminal average latency of just under 1.0ms.
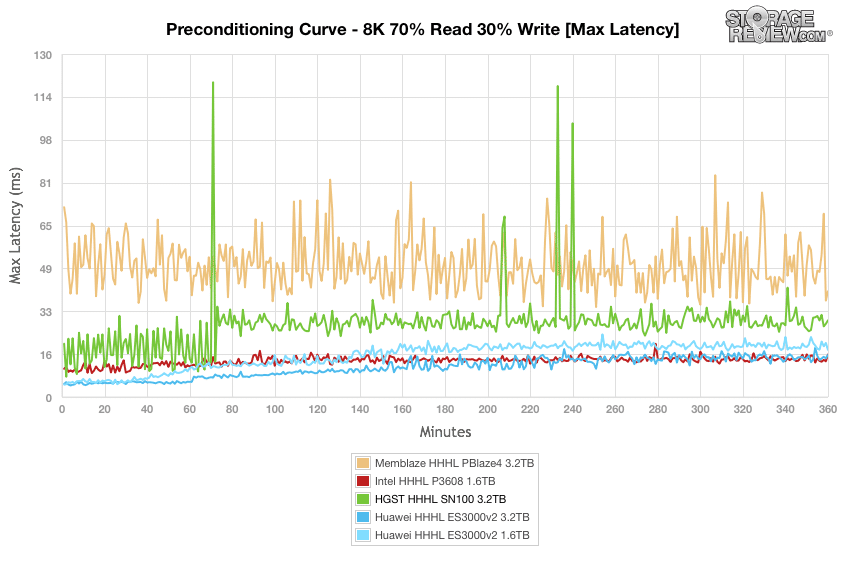
When measuring max latency, the HGST was one of the more inconsistent drives, suffering from major spikes during the entirety of our test. Overall, however, the Memblaze drive had the least consistent results while the Huawei and Intel drives showed the best performance.
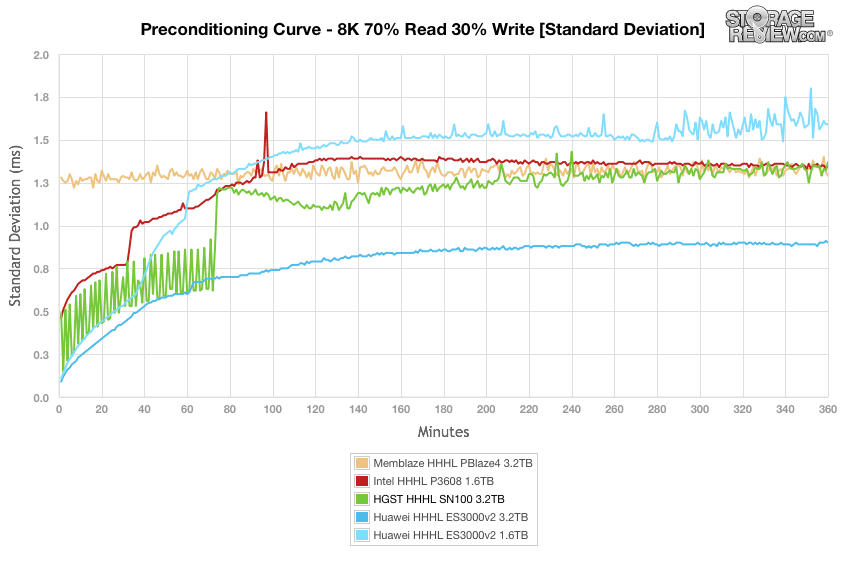
Standard deviation calculations is designed make it easier visualize the consistency of the SSD latency performance results. In this scenario, the HGST had a major series of spikes at the beginning of the test until approximately the 70 minute mark. The Huawei 3.2TB had the most stable results, hovering under 1.0ms in its stable-state.
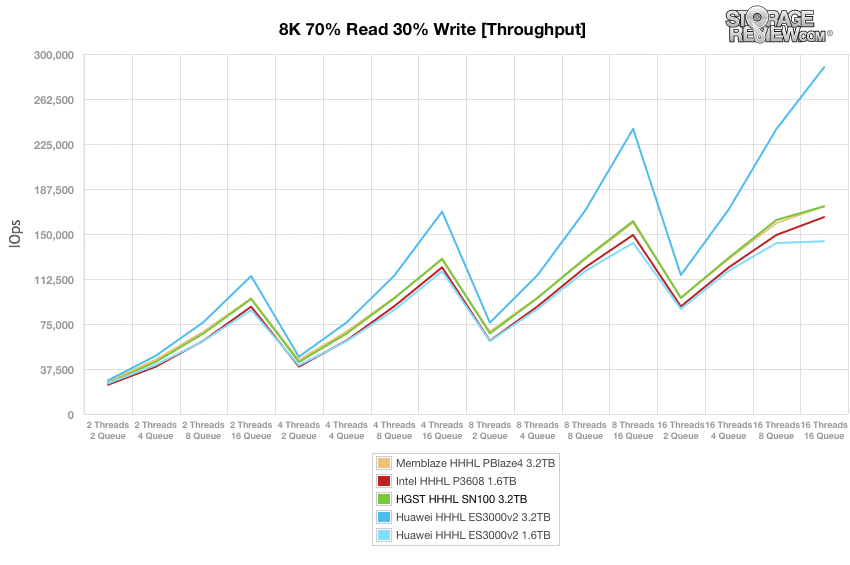
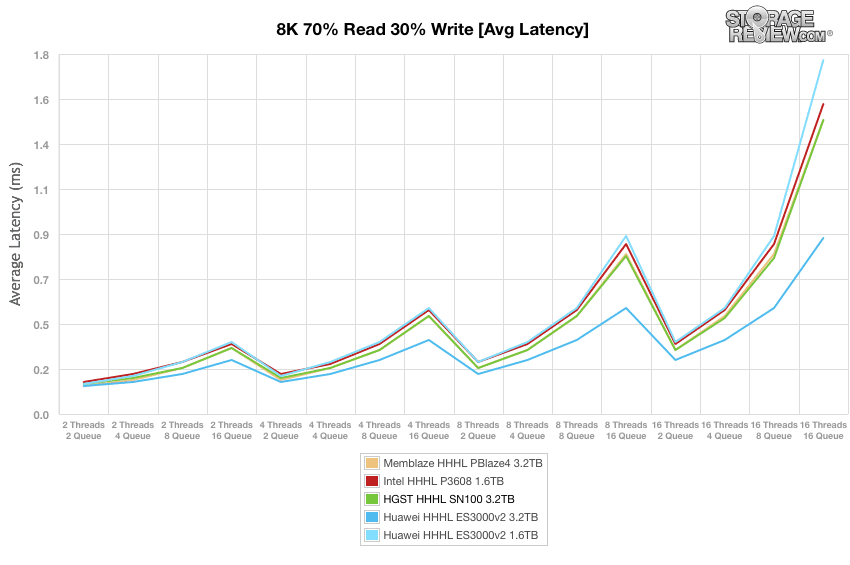
After we fully preconditioned the HGST drive, we put it through our main 8k 70/30 test. In throughput, most of the drive boasted near identical performance with the exception of the Huawei 3.2TB, which pulled away. The HGST ended up with almost 170,000 IOPS in the terminal.
Average latency showed very similar results, with the Intel, Memblaze, HGST, and 1.6TB Huawei drives performing neck and neck all the way to the last queue depth. The top performing drive here was the 3.2TB Huawei drive again, which ended up just under 0.9ms at 16T/16Q.
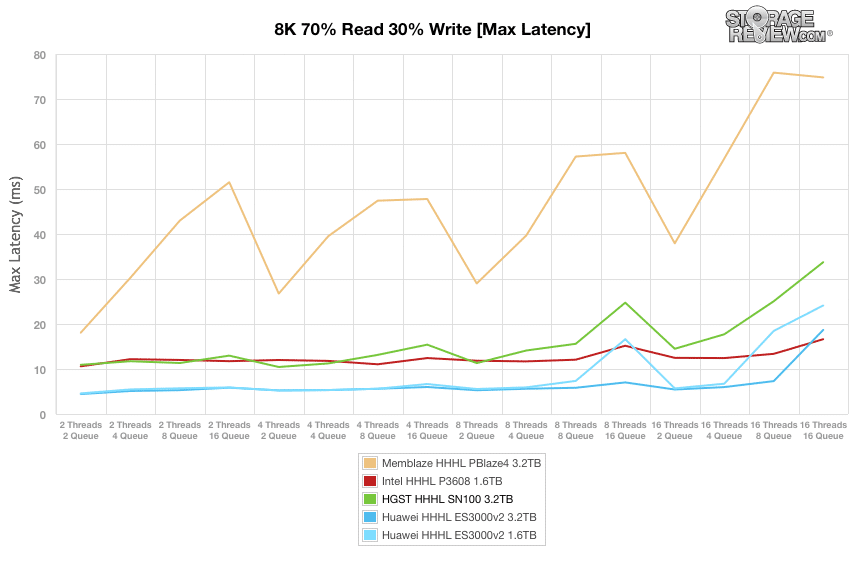
Looking at max latency showed the HGST drive with fairly consistent results, though it did begin to spike near the end of the test. Intel and Huawei drives showed the best overall performance.
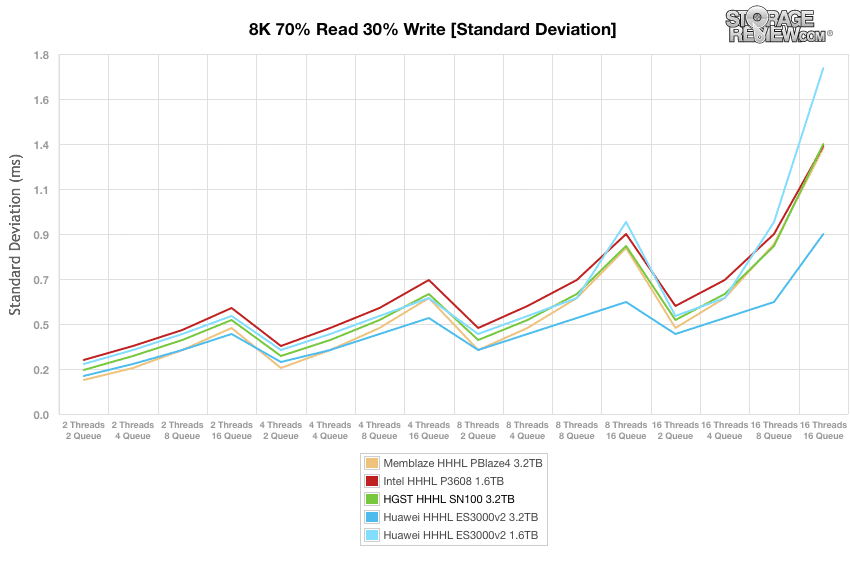
Standard deviation demonstrated a very similar trend in performance (max/average latency) between all of the drives. Here, the Huawei 3.2TB drive pulled away around the 8T8Q mark, posting the best overall results with just over 0.9ms.
Conclusion
HGST has a long history of creating excellent enterprise flash storage solutions and the new SN100 series of NVMe SSDs is no exception, as it features UEFI boot support, advanced power management, and enterprise-grade reliability thanks to features like flash-aware RAID, end-to-end data-path protection, advanced ECC and power fail protection. The HGST family is available in both AIC (SN150) and 2.5” (SN100) form factors, the former which is easier to deploy since virtually any modern server can handle that type of card with seamless deployment.
When looking at performance, the HGST Ultrastar SN100 Series showed good performance throughout our tested benchmarks, even leading in a few categories. In our first application workload analysis, the HGST drive showed results at the bottom of the leaderboard with a top TPS of 3,152.13 and an aggregate of 3,149.97 TPS in the SQL Server Output test, while hitting 7.0ms in average latency. In our Sysbench tests, we saw decent overall performance from the HGST drive. In the average transactions per second benchmark, the HGST Ultrastar SN100 Series measured an aggregate of 5,853.6 TPS, which was just slightly less than the both the Intel and Memblaze drives. When looking at average latency results, the HGST had individual VMs running between 21.66ms through 22.10ms and aggregate latency of 21.87ms. In terms of our worst-case MySQL latency scenario, the HGST showed VMs running between 49.62ms and 50.07ms with an aggregate of 49.81ms, which placed it in the middle of the rankings among our tested AIC SSDs.
During our synthetic benchmarks, the HGST Ultrastar posted a fairly good numbers with a 4k throughput of 706,933 IOPS read and 229,914 IOPS write. In comparison, the Intel drive boasted top results with 851,693 IOPS read while writes hit 197,940 IOPS. Average latency showed great results, with the 0.36ms read and 1.76ms write (just behind the Intel drive). In our 8k transfers (which consists of a ratio of 70% read operations and 30% write operations), the HGST topped out at 173,022 IOPS, edging out the Intel model, but coming in just below the Memblaze PBlaze4 which measured 173,275 IOPS.
Pros
- Multiple form factors for given needs
- Strong database performance
Cons
- Some max latency spikes under heavy workloads
Bottom Line
The HGST SN100 Series is HGST’s first NVMe SSD that delivers good performance with a track record of excellent quality in a variety of form factors and capacities.


 Amazon