

The Kingston DC500R, announced in mid-March of this year, is an enterprise-grade SSD, ideal for read-intensive applications such as server boot, web serving, virtual desktop infrastructure, operational databases, and analytics. This 2.5” form factor SSD is optimized for read-intensive applications and is the first to implement Kingston’s strict QoS requirements to ensure predictable random I/O performance and low latencies over a wide range of read and write workloads.
Built on 3D TLC NAND technology, this Kingston DC500R comes in 480GB, 960GB, 1.92TB, and 3.84TB capacities, providing more economical choices for companies looking to spend a little less money or for those that just don’t require a higher capacity drive. In this review, we’ll be looking at the 3.84TB drive, which is quoted to have sequential read and write speed of 555MB/s and 520MB/s, respectively, as well as steady-state 4K read and write speeds of 98,000 IOPS and 28,000 IOPS respectively. It should be noted that Kingston also offers the DC500M within this family, which is targeted toward mixed workload use cases.
Kingston DC500R Specifications
| Form Factor | 2.5 inch | |||
| Interface | SATA Rev. 3.0 (6GB/s) – with backwards compatibility to SATA Rev. 2.0 (3Gb/s) | |||
| Capacities | 480GB | 960GB | 1.92TB | 3.84TB |
| NAND | 3D TLC | |||
| Self-Encrypting Drive | AES 256-bit Encryption | |||
| Performance | ||||
| Sequential Read/Write | 555MB/s, 500MB/s | 555MB/s, 525MB/s | 555MB/s, 525MB/s | 555MB/s, 520MB/s |
| Steady-State 4k Read/Write | 98K, 12K IOPS | 98K, 20K IOPS | 98K, 24K IOPS | 98K, 28K IOPS |
| Enterprise SMART tools | Reliability tracking Usage statistics life remaining wear leveling temperature |
|||
| Power Loss Protection | Tantalum Capacitors | |||
| Endurance | 438TBW (0.5 DWPD) | 876TBW (0.5 DWPD) | 1,752TBW (0.5 DWPD) | 3,504TBW (0.5 DWPD) |
| Power Consumption | Idle – 1.56W Average – 1.6W Max Read – 1.8W Max Write – 7.5W |
|||
| Storage Temperature | -40oC~ 85oC | |||
| Operating Temperature | 0oC ~ 70oC | |||
| Dimensions | 69.9mm x 100mm x 7mm | |||
| Weight | 92.34g | |||
| Vibration operating | 2.17G Peak (7-800Hz) | |||
| Vibration non-operating | 20G Peark (10-2000Hz) | |||
| MTBF | 2 million hours | |||
| Warranty/support | Limited 5-year warranty with free technical support | |||
Performance
Testbed
Our Enterprise SSD reviews leverage a Lenovo ThinkSystem SR850 for application tests and a Dell PowerEdge R740xd for synthetic benchmarks. The ThinkSystem SR850 is a well-equipped quad-CPU platform, offering CPU power well in excess of what's needed to stress high-performance local storage. Synthetic tests that don't require a lot of CPU resources use the more traditional dual-processor server. In both cases, the intent is to showcase local storage in the best light possible that aligns with storage vendor maximum drive specs.
Lenovo ThinkSystem SR850
- 4 x Intel Platinum 8160 CPU (2.1GHz x 24 Cores)
- 16 x 32GB DDR4-2666Mhz ECC DRAM
- 2 x RAID 930-8i 12Gb/s RAID Cards
- 8 NVMe Bays
- VMware ESXI 6.5
Dell PowerEdge R740xd
- 2 x Intel Gold 6130 CPU (2.1GHz x 16 Cores)
- 4 x 16GB DDR4-2666MHz ECC DRAM
- 1x PERC 730 2GB 12Gb/s RAID Card
- Add-in NVMe Adapter
- Ubuntu-16.04.3-desktop-amd64
Testing Background
The StorageReview Enterprise Test Lab provides a flexible architecture for conducting benchmarks of enterprise storage devices in an environment comparable to what administrators encounter in real deployments. The Enterprise Test Lab incorporates a variety of servers, networking, power conditioning, and other network infrastructure that allows our staff to establish real-world conditions to accurately gauge performance during our reviews.
We incorporate these details about the lab environment and protocols into reviews so that IT professionals and those responsible for storage acquisition can understand the conditions under which we have achieved the following results. None of our reviews are paid for or overseen by the manufacturer of equipment we are testing.
Application Workload Analysis
In order to understand the performance characteristics of enterprise storage devices, it is essential to model the infrastructure and the application workloads found in live-production environments. Our benchmarks for the Samsung 883 DCT are therefore the MySQL OLTP performance via SysBench and Microsoft SQL Server OLTP performance with a simulated TCP-C workload. For our application workloads, each drive will be running 2-4 identically configured VMs.
SQL Server Performance
Each SQL Server VM is configured with two vDisks: 100GB volume for boot and a 500GB volume for the database and log files. From a system-resource perspective, we configured each VM with 16 vCPUs, 64GB of DRAM and leveraged the LSI Logic SAS SCSI controller. While our Sysbench workloads tested previously saturated the platform in both storage I/O and capacity, the SQL test is looking for latency performance.
This test uses SQL Server 2014 running on Windows Server 2012 R2 guest VMs, and is stressed by Quest's Benchmark Factory for Databases. StorageReview’s Microsoft SQL Server OLTP testing protocol employs the current draft of the Transaction Processing Performance Council’s Benchmark C (TPC-C), an online transaction-processing benchmark that simulates the activities found in complex application environments. The TPC-C benchmark comes closer than synthetic performance benchmarks to gauging the performance strengths and bottlenecks of storage infrastructure in database environments. Each instance of our SQL Server VM for this review uses a 333GB (1,500 scale) SQL Server database and measures the transactional performance and latency under a load of 15,000 virtual users.
SQL Server Testing Configuration (per VM)
- Windows Server 2012 R2
- Storage Footprint: 600GB allocated, 500GB used
- SQL Server 2014
- Database Size: 1,500 scale
- Virtual Client Load: 15,000
- RAM Buffer: 48GB
- Test Length: 3 hours
- 2.5 hours preconditioning
- 30 minutes sample period
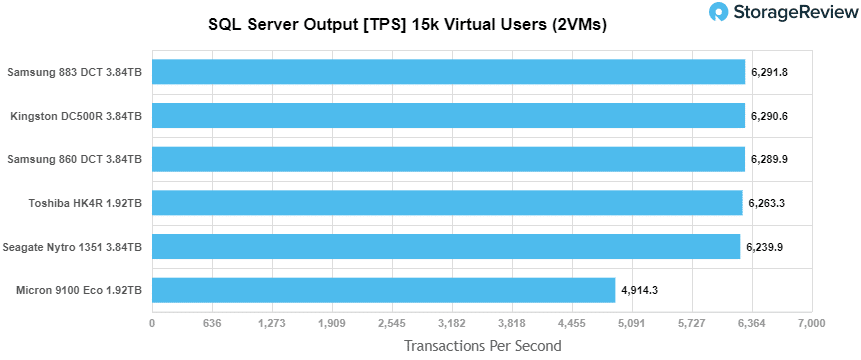
For our SQL Server transactional benchmark, the Kingston DC500R barely fell behind the Samsung 883 DCT, posting a total of 6,290.6 TPS.
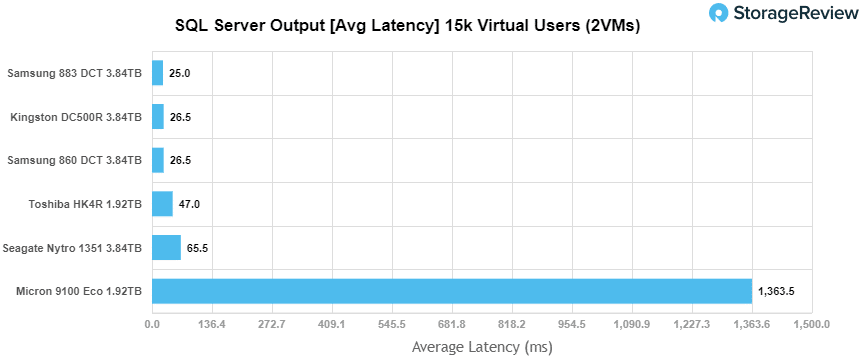
A better indication of SQL Server performance is latency compared to TPS. Here, we see the Samsung 860 DCT and the Kingston DC500R tie for second, showing 26.5ms.
Sysbench Performance
The next application benchmark consists of a Percona MySQL OLTP database measured via SysBench. This test measures average TPS (Transactions Per Second), average latency, and average 99th percentile latency as well.
Each Sysbench VM is configured with three vDisks: one for boot (~92GB), one with the pre-built database (~447GB), and the third for the database under test (270GB). From a system-resource perspective, we configured each VM with 16 vCPUs, 60GB of DRAM and leveraged the LSI Logic SAS SCSI controller.
Sysbench Testing Configuration (per VM)
- CentOS 6.3 64-bit
- Percona XtraDB 5.5.30-rel30.1
- Database Tables: 100
- Database Size: 10,000,000
- Database Threads: 32
- RAM Buffer: 24GB
- Test Length: 3 hours
- 2 hours preconditioning 32 threads
- 1 hour 32 threads
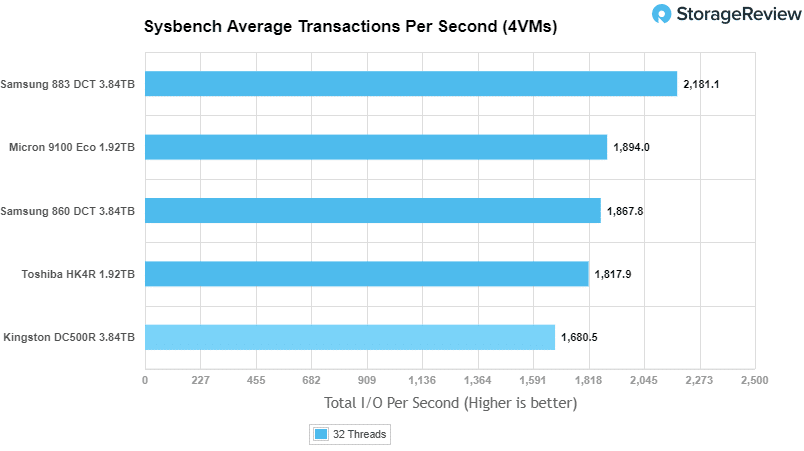
With the Sysbench transactional benchmark, the DC500R fell behind the other drives, showing 1,680.47 TPS.
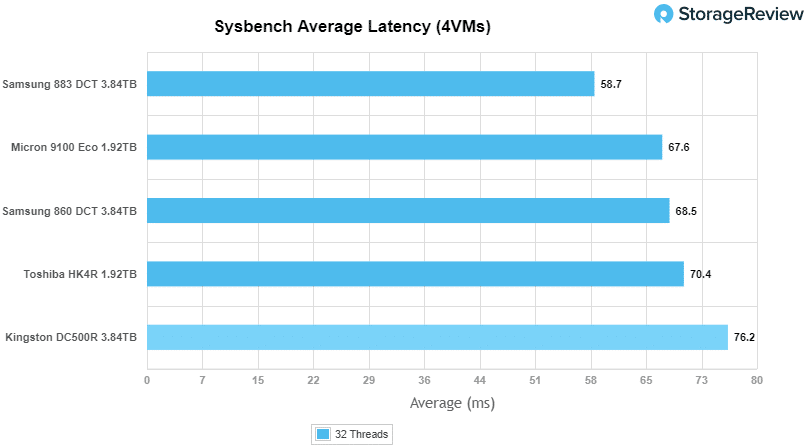
Sysbench average latency also had the DC500R at the bottom of the pack with 76.2ms.
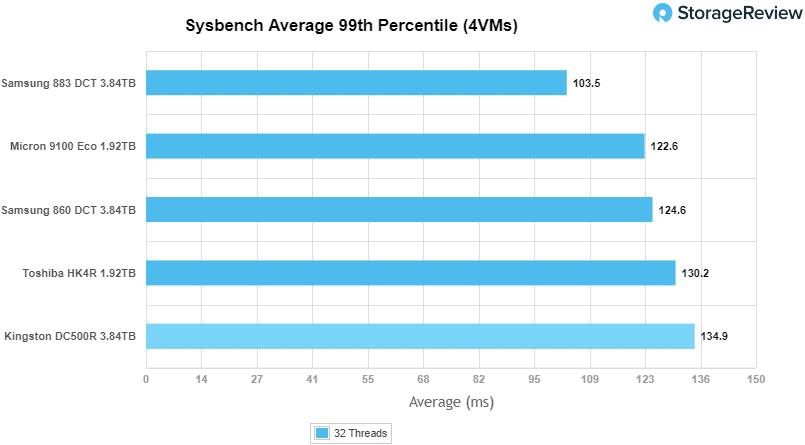
For our worst-case scenario latency (99thpercentile), the DC500R, again, placed last with 134.9ms latency.
VDBench Workload Analysis
When it comes to benchmarking storage devices, application testing is best, and synthetic testing comes in second place. While not a perfect representation of actual workloads, synthetic tests do help to baseline storage devices with a repeatability factor that makes it easy to do apples-to-apples comparison between competing solutions. These workloads offer a range of different testing profiles ranging from "four corners" tests, common database transfer size tests, to trace captures from different VDI environments. All of these tests leverage the common vdBench workload generator, with a scripting engine to automate and capture results over a large compute testing cluster. This allows us to repeat the same workloads across a wide range of storage devices, including flash arrays and individual storage devices. Our testing process for these benchmarks fills the entire drive surface with data, then partitions a drive section equal to 25% of the drive capacity to simulate how the drive might respond to application workloads. This is different than full entropy tests which use 100% of the drive and take them into steady state. As a result, these figures will reflect higher-sustained write speeds.
Profiles:
- 4K Random Read: 100% Read, 128 threads, 0-120% iorate
- 4K Random Write: 100% Write, 64 threads, 0-120% iorate
- 64K Sequential Read: 100% Read, 16 threads, 0-120% iorate
- 64K Sequential Write: 100% Write, 8 threads, 0-120% iorate
- Synthetic Database: SQL and Oracle
- VDI Full Clone and Linked Clone Traces
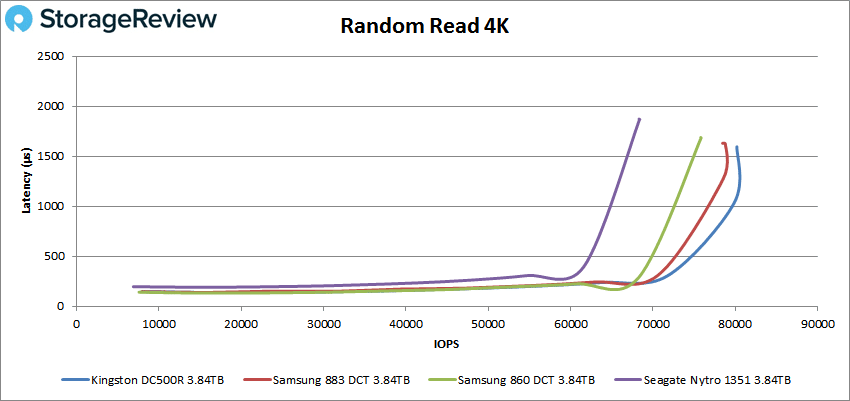
In our first VDBench Workload Analysis, Random 4K Read, the Kingston DC500R had impressive performance figures, staying under 1ms latency until nearly 80,000 IOPS, and went on to a peak performance of 80,209 IOPS with a latency of 1.59ms.
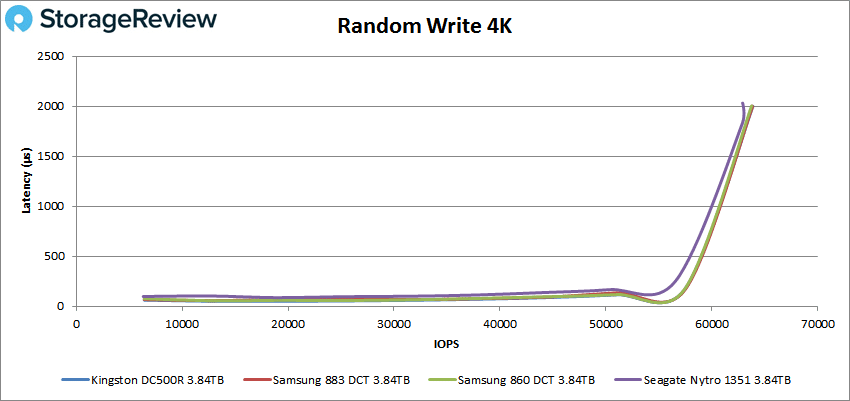
With Random 4K writes, all of the drives had nearly identical results, posting a bit over 63,000 IOPS with a latency of 2ms.
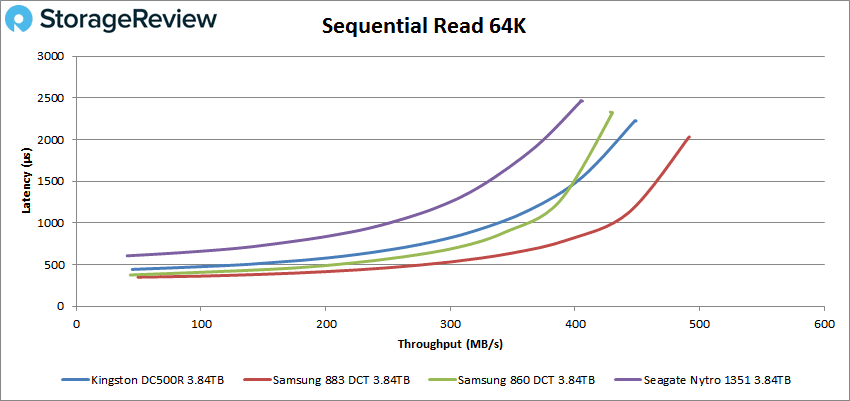
Switching over to sequential workloads, we first look at our 64K read test. Here, the Kingston drive had sub-millisecond latency until around 5,200 IOPS or 325MB/s. The drive peaked in second place at 7,183 IOPS or 449MB/s with a latency of 2.22ms.
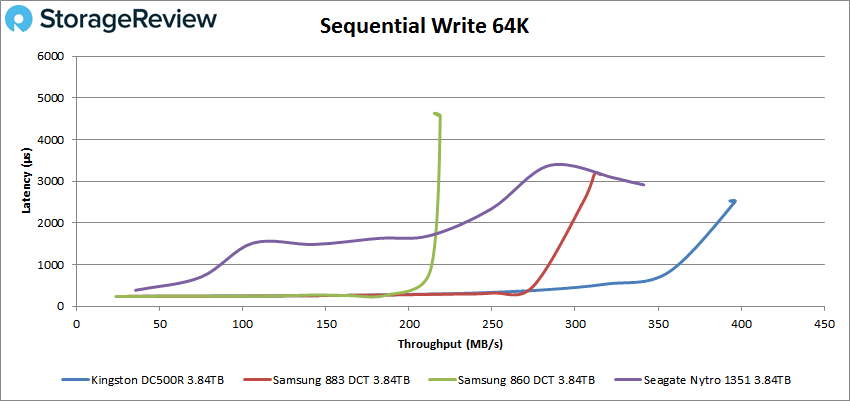
With sequential writes, the Kingston drive had the overall best performance, keeping sub-millisecond latency until around 5,700 IOPS or 356MB/s, going on to peak at 6,291 IOPS or 395MB/s with a latency of 2.51ms.
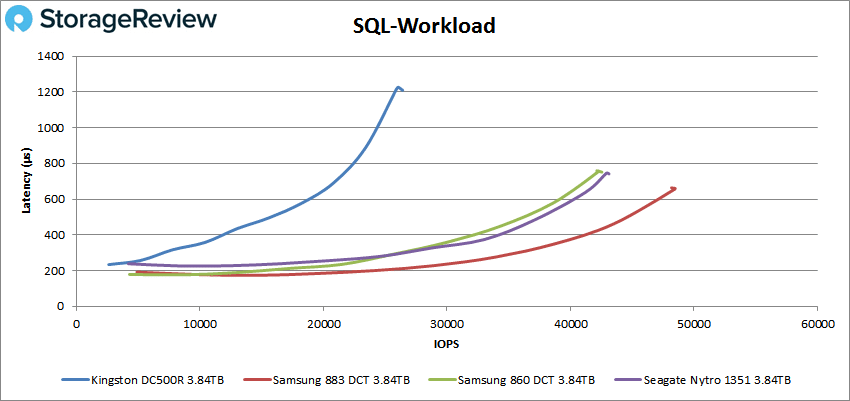
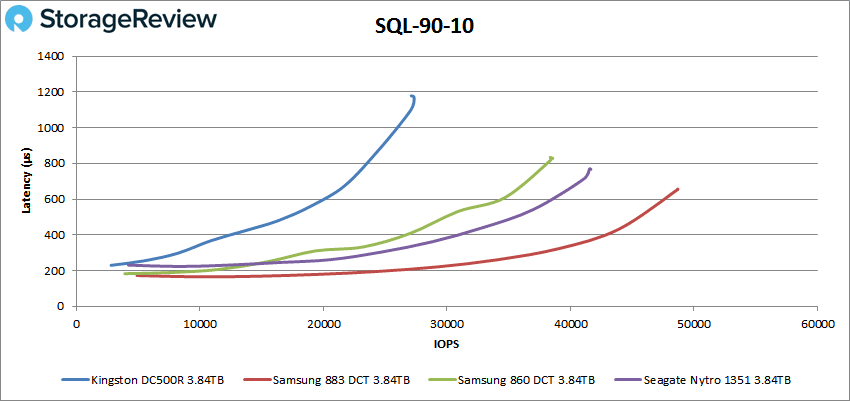
Next, we move on to our SQL workloads where the Kingston DC500R was the only drive to exceed sub-millisecond latency in all three tests. Here, the DC500R had a peak performance of 26,411 IOPS and a latency of 1.2ms.
For SQL 90-10, the Kingston drive stayed behind the other drives with a peak performance of 27,339 IOPS and a latency of 1.17ms.
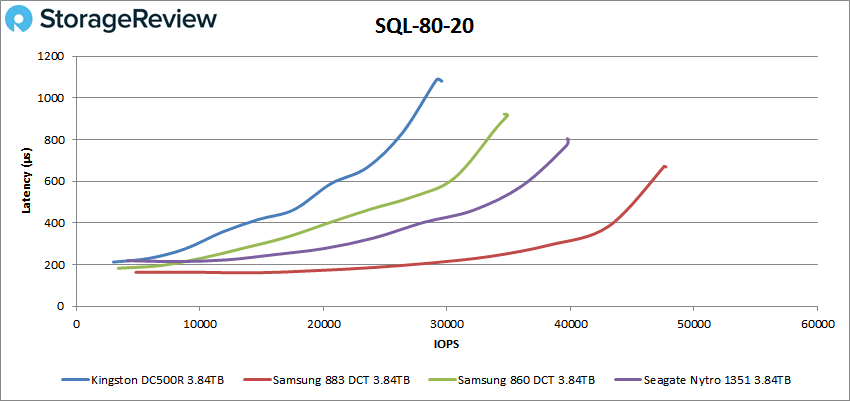
In SQL 80-20, the trend continues. Here, the Kingston drive posted a peak performance of 29,576 IOPS with a latency of 1.08ms.
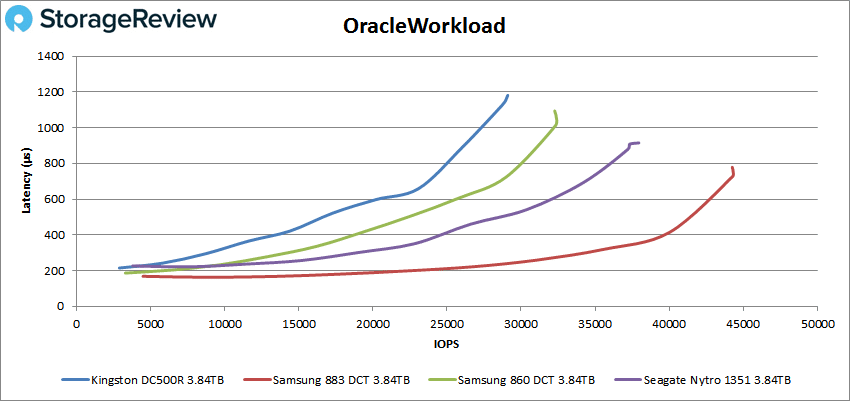
Moving on to Oracle workloads, the DC500R found itself in last again, but was able to maintain sub-millisecond latency in two out of three tests. For the first test, the Kingston had a peak performance of 29,098 IOPS with a latency of 1.18ms.
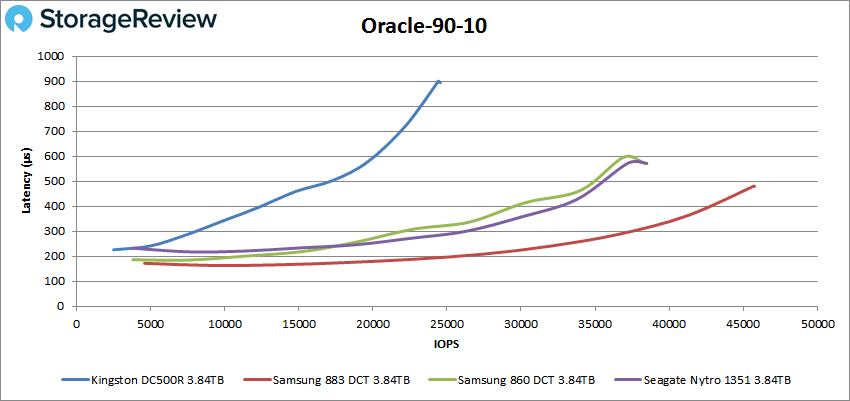
With Oracle 90-10, the DC500R had a peak performance of 24,555 IOPS with a latency of 894.3μs.
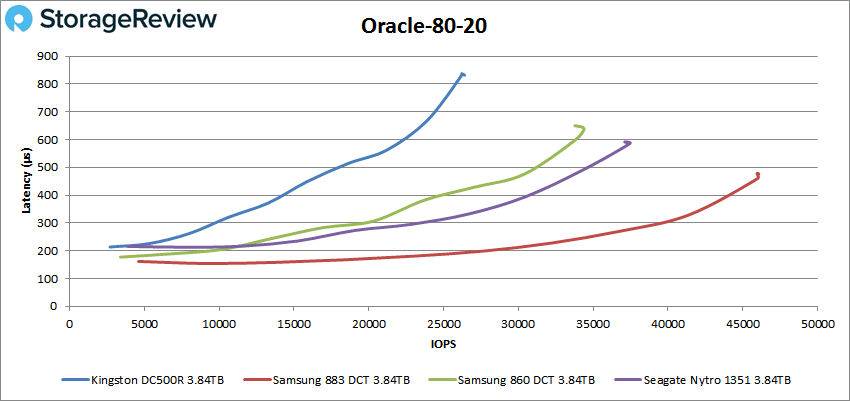
Oracle 80-20 had the Kingston drive at 26,401 IOPS with a latency of 831.9μs.
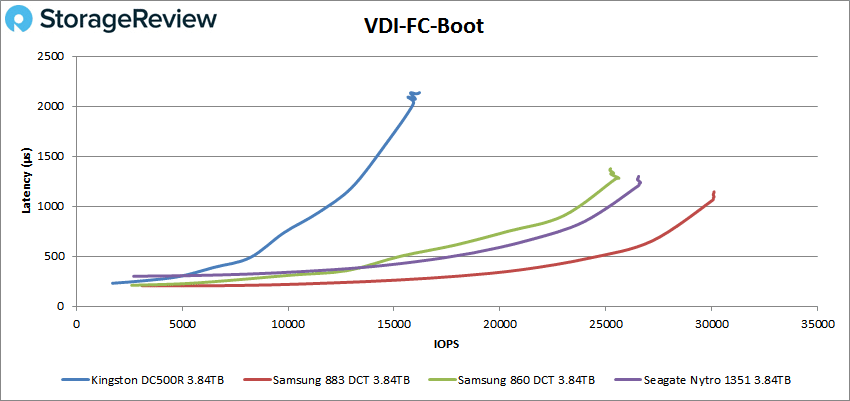
Next, we switched over to our VDI clone test, Full and Linked. For VDI Full Clone Boot, the Kingston drive continued holding last with a breaking sub-millisecond latency at around 12,000 IOPS and peaking at 16,203 IOPS with a latency of 2.14ms.
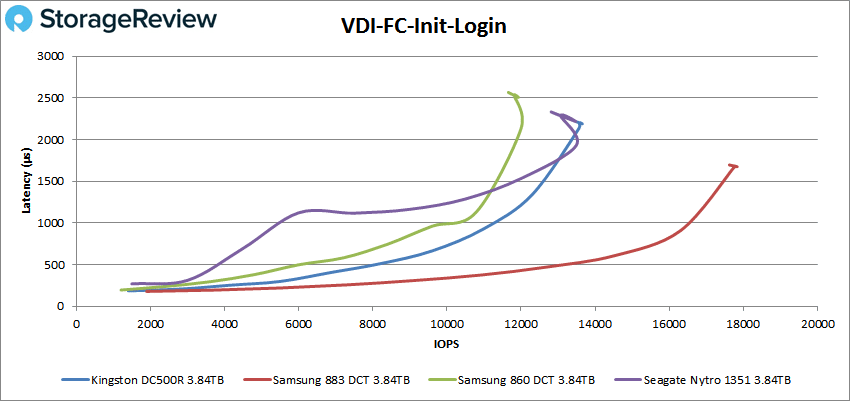
VDI FC Initial Login saw the Kingston drive post some improvements, taking (a very close) second place. The drive maintained sub-millisecond latency up until around 11,000 IOPS and went on to peak at 13,652 IOPS with a latency of 2.18ms.
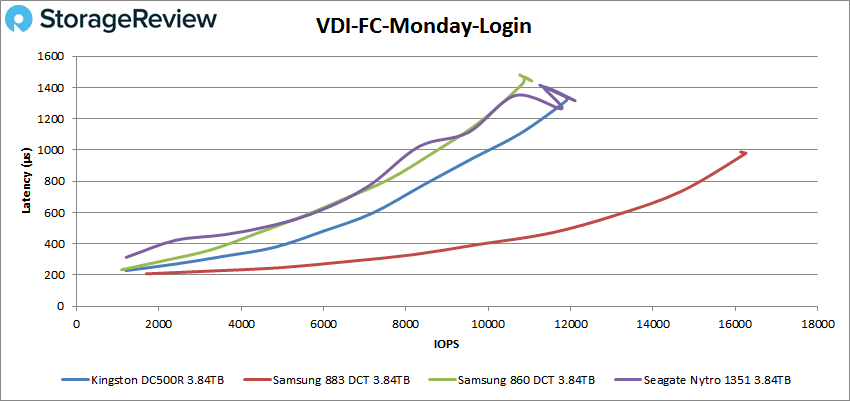
The Kingston drive came in a very close second again with VDI FC Monday Login. While the Seagate Nytro 1351 had slightly better peak performance, the Kingston drive maintained a better latency throughout the majority of the test. The DC500R had a peak performance of 11,897 IOPS with a latency of 1.31ms.
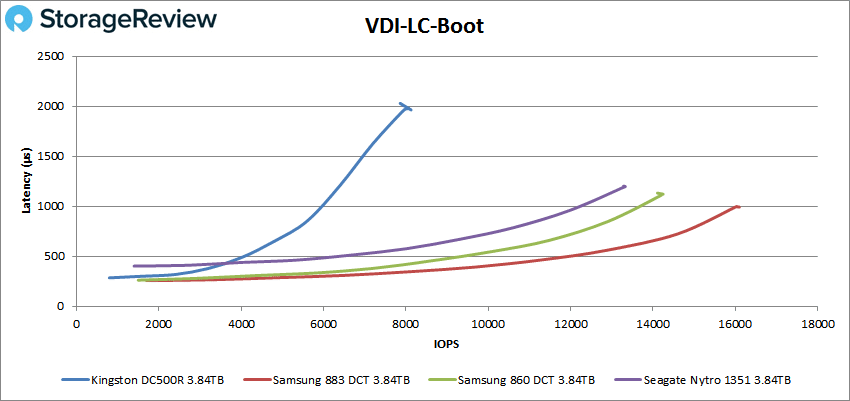
Switching over to Linked Clone (LC), the Kingston drive posted last in the boot test, breaking sub-millisecond latency at less than 6000 IOPS. The DC500R had a peak performance of 7,861 IOPS and a latency of 2.03ms.
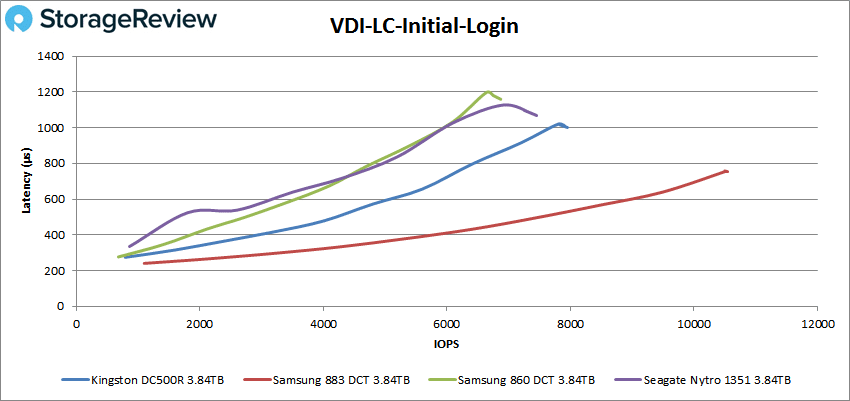
VDI LC Initial Login had the drive jump back up to second place, however, with the drive barely breaking sub-millisecond latency at its peak, showing 7,950 IOPS at a latency of 1.001ms.
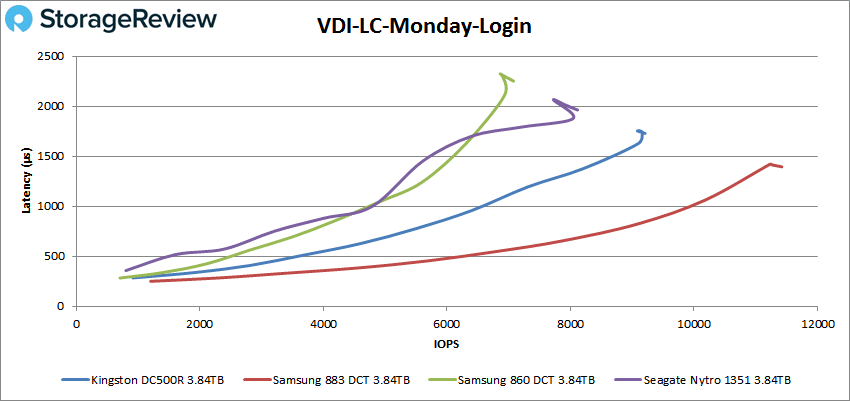
For our final test, we look at VDI LC Monday Login. Here, the drive maintained second with a peak performance of 9,205 IOPS and a latency of 1.72ms. The drive had sub-millisecond latency until about 6,400 IOPS.
Conclusion
The Kingston DC500R is the company’s latest SATA SSD designed for the enterprise. The DC500R is a 2.5” form factor SSD that comes in capacities ranging from 480GB to 3.84TB. The drive, which is built with 3D TLC NAND, is designed to blend performance and endurance, quoting 3,504 TB written for the 3.84TB model, sequential speeds up to 555MB/s read and 520MB/s write, and throughput going as high as 98,000 IOPS read and 28,000 IOPS write.
To test performance, we put the Kingston DC500R up against other popular SATA SSDs including Samsung’s 860 DCTand 883 DCT, as well as the Seagate Nytro 3530. The Kington DC500R was able to keep up with (and in some cases, outperform) these drives. In our application workloads the Kingston DC500R performed well in the SQL Workload, with a second overall TPS performance of 6,291.8 keeping up with a lower latency profile at 26.5ms. Migrating to our Sysbench workload with a heavier write profile though, the DC500R slipped and fell to the back of the pack with 1,680.5 TPS, an average latency of 76.2, and a worst-case scenario latency of 134.9ms.
In our 4K random tests, the Kingston DC500R measured reads at 80,209 IOPS with a latency of 1.59ms and posted a bit over 63,000 IOPS with a latency of 2ms. In 64K read/write, the DC500R hit speeds of 7,183 IOPS or 449MB/s with a latency of 2.22ms, and 6,291 IOPS or 395MB/s with a latency of 2.51ms, respectively. In synthetic workloads such as SQL and Oracle, the DC500R's performance slipped as the bias towards write activity increased. In our SQL workloads, the Kingston DC500R didn’t do as well, placing last in each of the three tests, and being the only drive to exceed sub-millisecond latency. However, our Oracle tests told a different story, showing the drive place second in two of the three tests, where it was able to maintain sub-millisecond latency levels throughout. In both Linked and Full Clone VDI benchmarks, the Kingston DC500R posted solid performance throughout.
Overall, the Kingston DC500R SSD is an impressive drive in a class that is at times overlooked. As fun as high-performance NVMe and other technologies are, SATA drives still carry most of the water when it comes to server or storage controller boot duties, where reliability is critical. They also make for affordable in-server storage where capacity and price are key, along with all of the other TCO benefits SSDs offer over HDDs. For its part, the DC500R placed near the top of the charts in a many of our tests, when compared with other worthy drives. All in all, the DC500R is a good option for use cases that use the SATA interface and need a reliable, well-performing drive with good endurance and a range of capacities.


 Amazon