

Samsung’s new data center drive, the 860DCT, is a SATA, 2.5” SSD. The drive is designed for read-intensive, data-streaming data centers. Part of being designed for read-intensive, data-streaming uses is having the drive engineered for the endurance needed. The company states that leveraging its V-NAND technology, reinforced controller and high TBW, make the 860DCT the right drive for the above use cases.
Built off of the proven V-NAND technology the drive comes in three models that offer capacities ranging from 960GB to 3.84TB. The drives promise speeds up to 550MB/s sequential and up to 98K IOPS random. Samsung also claims better TCO through reduced power and consolidation versus the typical legacy storage systems.
Our review will focus on the 3.84TB model that comes with a 3-year limited warranty and can be purchased for $1,209.99.
Samsung 860DCT specifications
| Model Number | MZ-76E960E | MZ-76E1T9E | MZ-76E3T8E |
| Form Factor | 2.5” | ||
| Capacity | 960GB | 1.92TB | 3.84TB |
| Interface | SATA 6Gb/s | ||
| Controller | Samsung MJX | ||
| NAND | Samsung V-NAND 3-bit MLC | ||
| DRAM Cache (Samsung) | 1GB LPDDR SDRAM | 2GB LPDDR SDRAM | 4GB LPDDR SDRAM |
| Performance | |||
| 4KB Sequential Read | 550MB/s | ||
| 4KB Sequential Write | 520MB/s | ||
| 4KB Random Read | 98K IOPS | ||
| 4KB Random Write | 19K IOPS | ||
| Endurance | |||
| MTBF | 1.5 million hours | ||
| TBW | 349TB | 698TB | 1,396TB |
| Warranty | 3-year limited | ||
| Power Consumption | |||
| Active | 2.9W | 2.95W | |
| Idle | 1.05W | ||
| Temperature | |||
| Operating | 32 ̊ ~ 158 ̊F (0 ̊C ~ 70 ̊C) | ||
| Non-operating | -49 ̊ ~ 185 ̊F (-45 ̊C to 85 ̊C) | ||
| Humidity | 5% to 95%, Non-Condensing | ||
| Vibration (Non-operating) | 20-2000Hz, 20G | ||
| Shock (Non-operating) | 1500G, Duration 0.5 m/sec, Half-Sine | ||
| Physical | |||
| WxHxD | 3.94" x 2.75" x 0.27" | ||
| Weight | 51g | 60g | 62g |
Design and Build
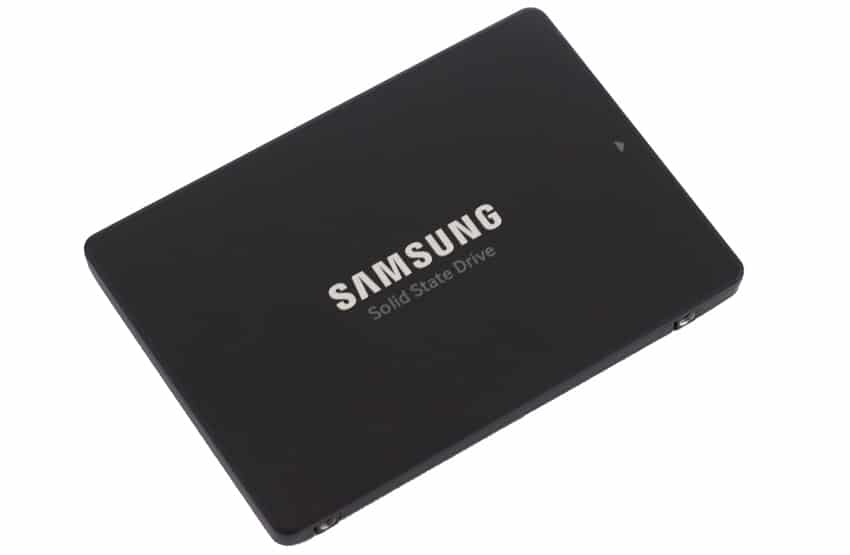
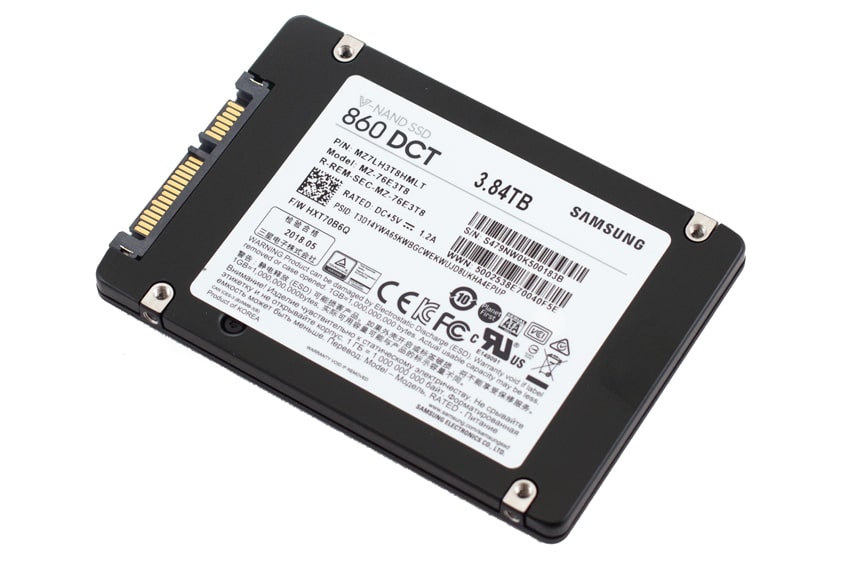
The Samsung 860DCT is 2.5” form factor SSD in a flat black case. The top of the drive has the companies branding as most of their 2.5” SSDs do. Flipping it over on the other side shows a sticker with information such as the model number and capacity.
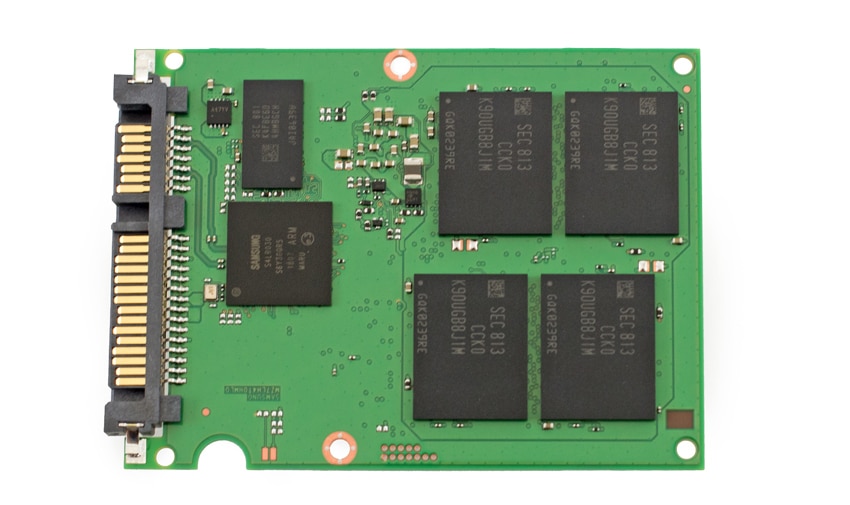
Opening up the drive we can see the controller, DRAM, and NAND packs on top.
Flipping over the PCB we see the rest of the NAND packs. 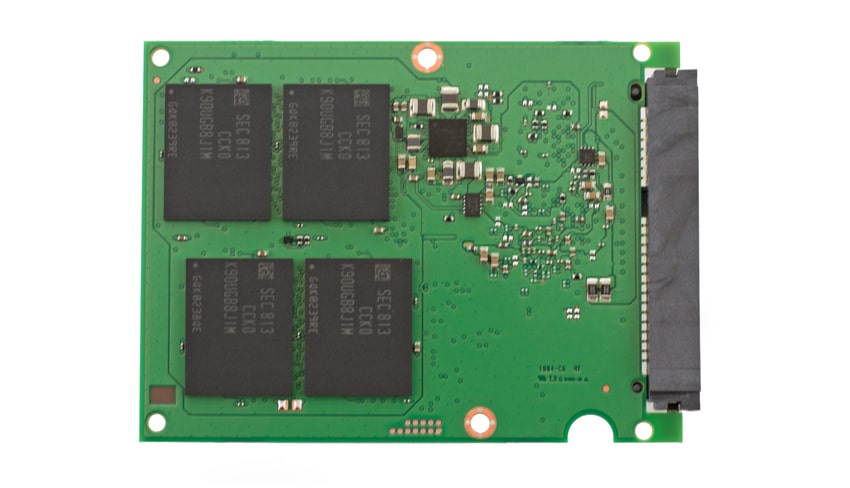
Performance
Testbed
Our Enterprise SSD reviews leverage a Dell PowerEdge R740xd for synthetic benchmarks. Synthetic tests that don't require a lot of CPU resources use the more traditional dual-processor server. In both cases, the intent is to showcase local storage in the best light possible that aligns with storage vendor maximum drive specs.
Dell PowerEdge R740xd
- 2 x Intel Gold 6130 CPU (2.1GHz x 16 Cores)
- 16 x 16GB DDR4-2666MHz ECC DRAM
- 1x PERC 730 2GB 12Gb/s RAID Card
- Add-in NVMe Adapter
- Ubuntu-16.04.3-desktop-amd64
Testing Background
The StorageReview Enterprise Test Lab provides a flexible architecture for conducting benchmarks of enterprise storage devices in an environment comparable to what administrators encounter in real deployments. The Enterprise Test Lab incorporates a variety of servers, networking, power conditioning, and other network infrastructure that allows our staff to establish real-world conditions to accurately gauge performance during our reviews.
We incorporate these details about the lab environment and protocols into reviews so that IT professionals and those responsible for storage acquisition can understand the conditions under which we have achieved the following results. None of our reviews are paid for or overseen by the manufacturer of equipment we are testing. Additional details about the StorageReview Enterprise Test Lab and an overview of its networking capabilities are available on those respective pages.
VDBench Workload Analysis
When it comes to benchmarking storage devices, application testing is best, and synthetic testing comes in second place. While not a perfect representation of actual workloads, synthetic tests do help to baseline storage devices with a repeatability factor that makes it easy to do apples-to-apples comparison between competing solutions. These workloads offer a range of different testing profiles ranging from "four corners" tests, common database transfer size tests, to trace captures from different VDI environments. All of these tests leverage the common vdBench workload generator, with a scripting engine to automate and capture results over a large compute testing cluster. This allows us to repeat the same workloads across a wide range of storage devices, including flash arrays and individual storage devices. Our testing process for these benchmarks fills the entire drive surface with data, then partitions a drive section equal to 25% of the drive capacity to simulate how the drive might respond to application workloads. This is different than full entropy tests which use 100% of the drive and take them into steady state. As a result, these figures will reflect higher-sustained write speeds.
Profiles:
- 4K Random Read: 100% Read, 128 threads, 0-120% iorate
- 4K Random Write: 100% Write, 64 threads, 0-120% iorate
- 64K Sequential Read: 100% Read, 16 threads, 0-120% iorate
- 64K Sequential Write: 100% Write, 8 threads, 0-120% iorate
- Synthetic Database: SQL and Oracle
- VDI Full Clone and Linked Clone Traces
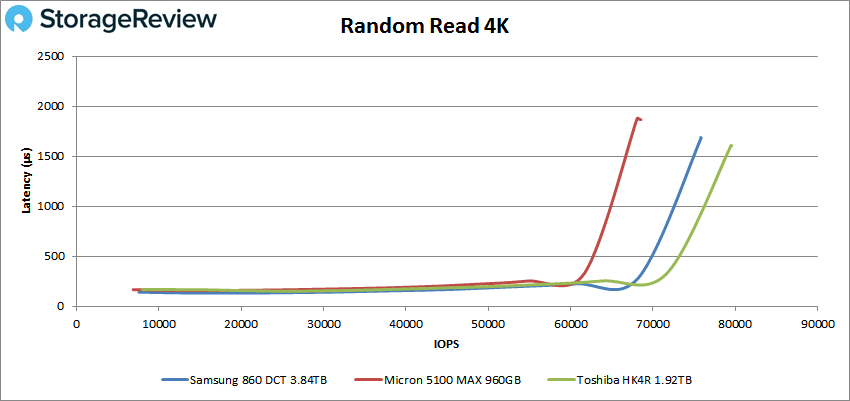
In our first VDBench Workload Analysis, Random 4K Read, the Samsung 860DCT had sub-millisecond latency performance until around 72K IOPS and peaked at 75,862 IOPS with latency of 1.68ms for second place.
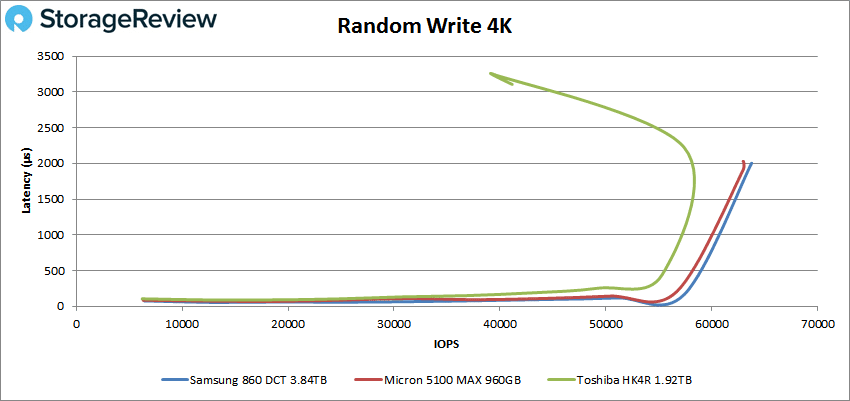
With Random 4K writes the Samsung pulled off a better performance to first place with a peak score of 63,764 IOPS and a latency of 2ms. The Samsung had made it to roughly 58K IOPS at less than 1ms of latency.
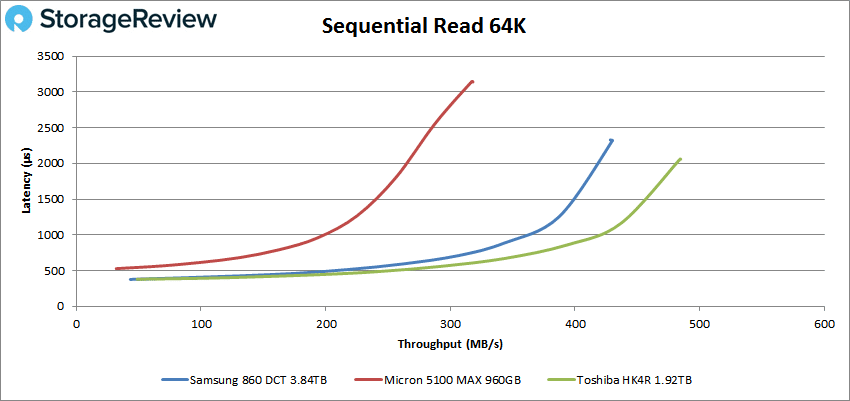
Switching over to sequential workloads, first we look at our 64K read test. Here the Samsung drive had sub-millisecond latency until around 5,500 IOPS or 350MB/s. The drive peaked in second place at 6,882 IOPS or 430MB/s with a latency of 2.32ms.
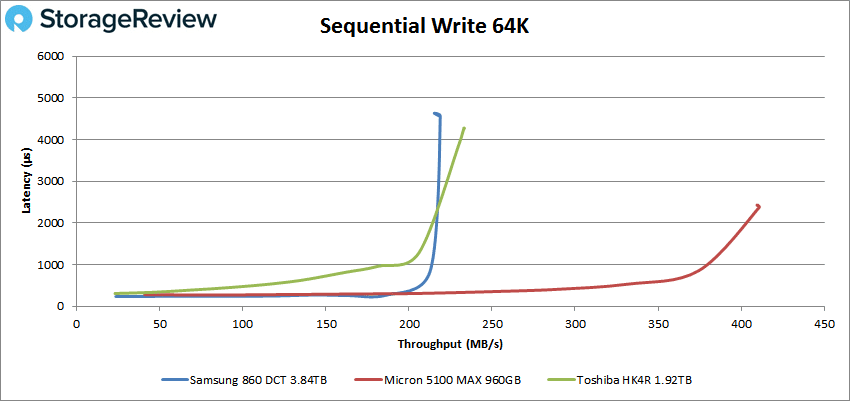
With sequential writes, the Samsung was had the poorest performance of the drives tested. It made it to roughly 3,400 IOPS or 212MB/s and shot straight up to peak at 3,502 IOPS or 219MB/s with 4.6ms latency before dropping off some.
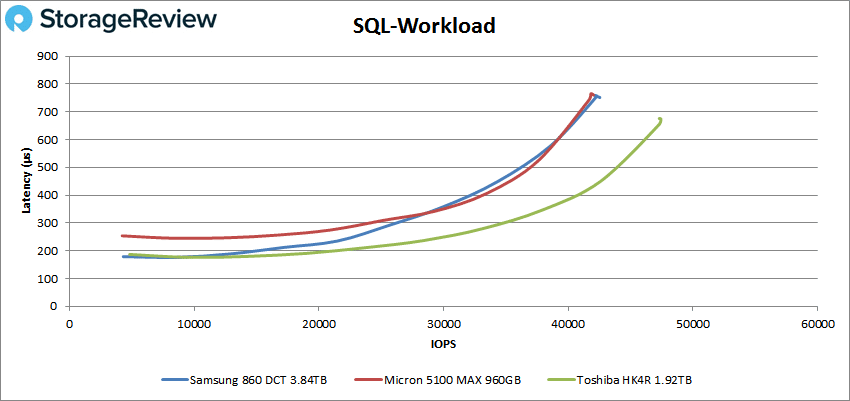
Next we move on to our SQL workloads where the Samsung 860DCT was able to maintain sub-millisecond latency performances throughout all three tests. In the SQL test the drive places second with a peak performance of 42,288 IOPS and a latency of 752μs.
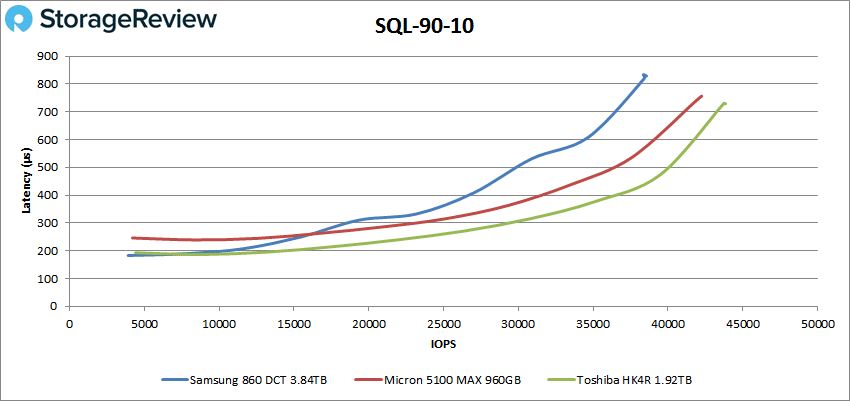
For SQL 90-10 the Samsung drive dropped to the bottom of the pack with peak performance of 38,407 IOPS and a latency of 829μs.
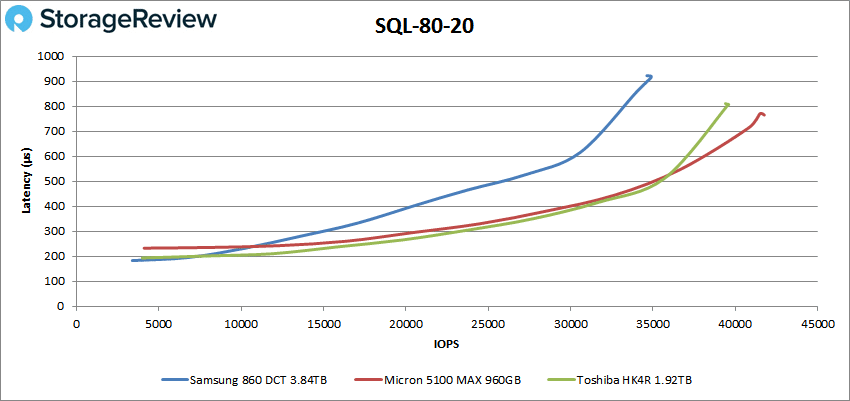
In SQL 80-20 the Samsung drops to last once again with a peak performance of 34,898 IOPS with a latency of 916μs.
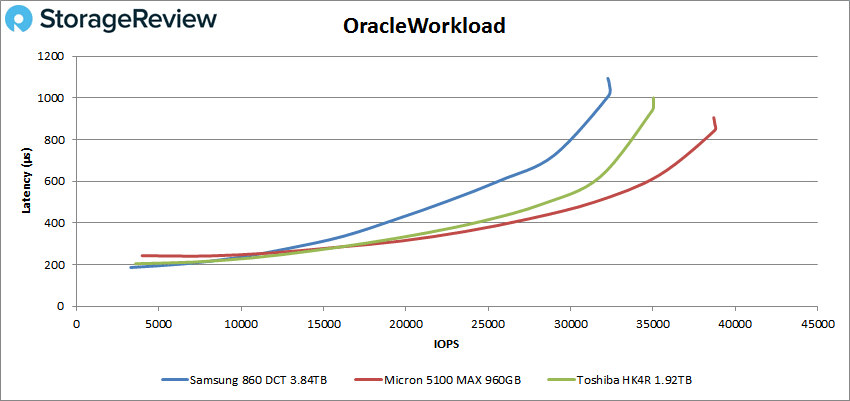
Moving on to Oracle workloads the Samsung drive found itself in last once more with a peak performance of about 32K IOPS and the highest latency of around 1.01ms.
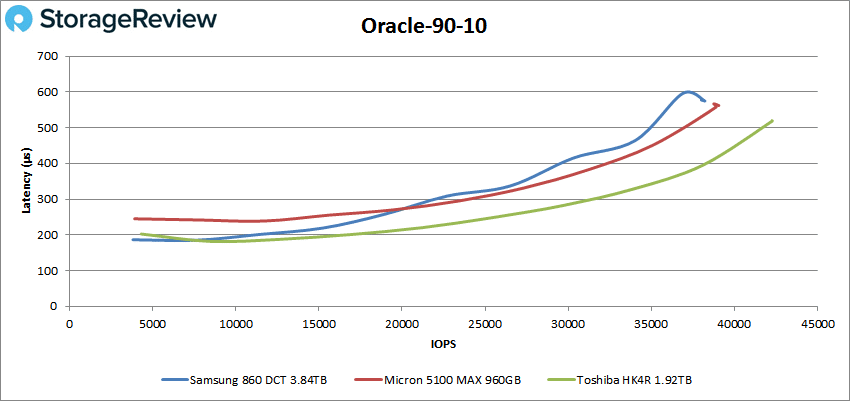
Oracle 90-10 showed the Samsung having a peak performance of 38,202 IOPS with a latency of 575μs.
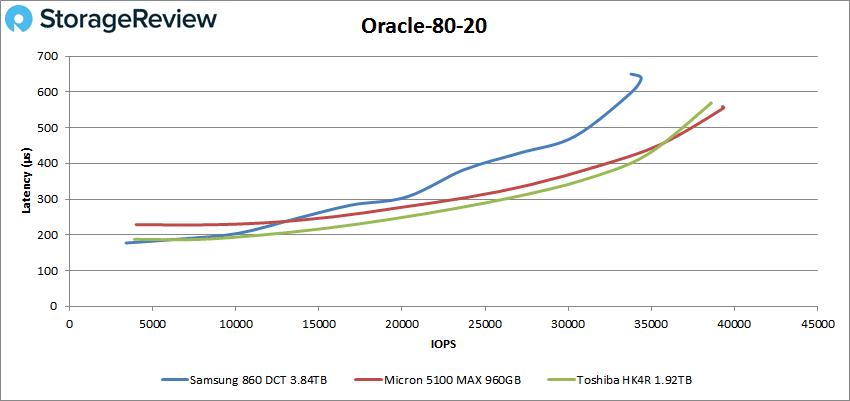
With Oracle 80-20 the Samsung trailed the other drives tested with a peak performance of roughly 34K IOPS and a latency of 639μs.
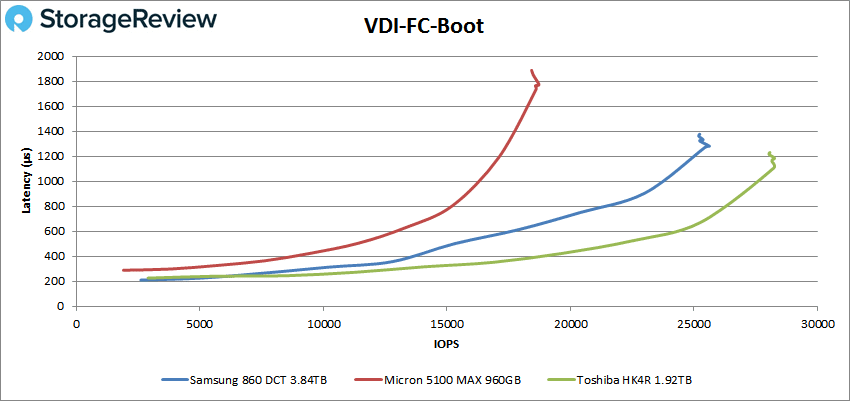
Next, we switched over to our VDI clone test, Full and Linked. For VDI Full Clone Boot, the Samsung drive showed some improvement in placing moving to second place with a peak performance of 25,621 IOPS with a latency of 1.28ms before dropping off some. The drive was able to maintain sub-millisecond latency until roughly 23.5K IOPS.
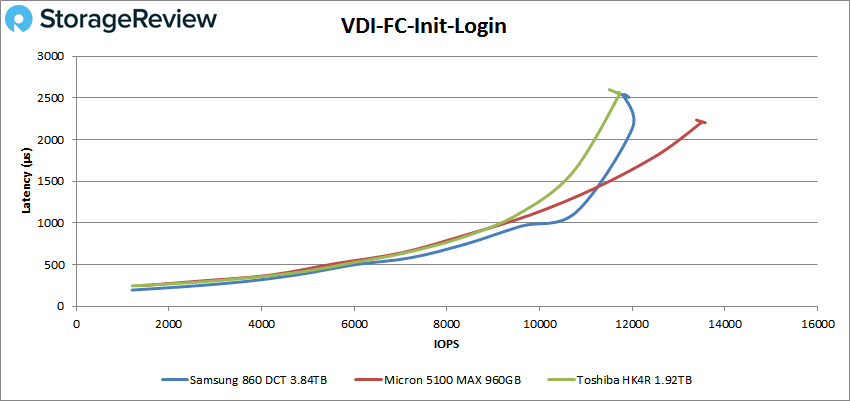
VDI FC Initial Login saw the Samsung take second place once more but only just. The drive stayed under 1ms up to about 9,600 IOPS. It peaked at roughly 12K IOPS with a latency of about 2.5ms.
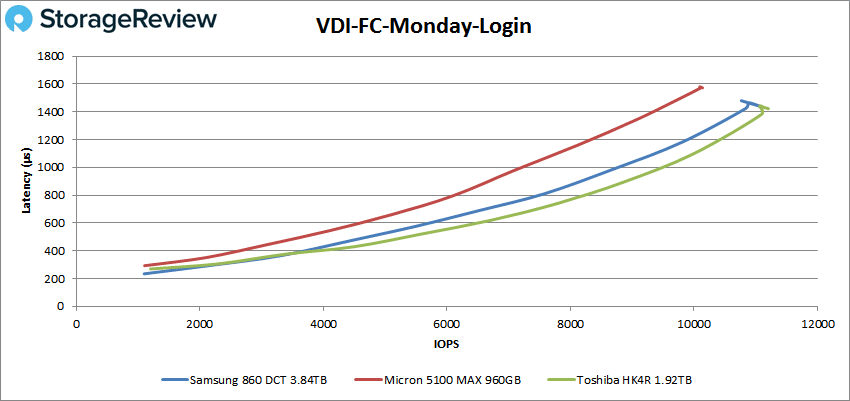
For VDI FC Monday Login the Samsung drive almost made it to first place losing just slightly to the Toshiba HK4R. The drive peaked at 11,058 IOPS with a latency of 1.44ms. The drive had sub-millisecond latency until about 9,800 IOPS.
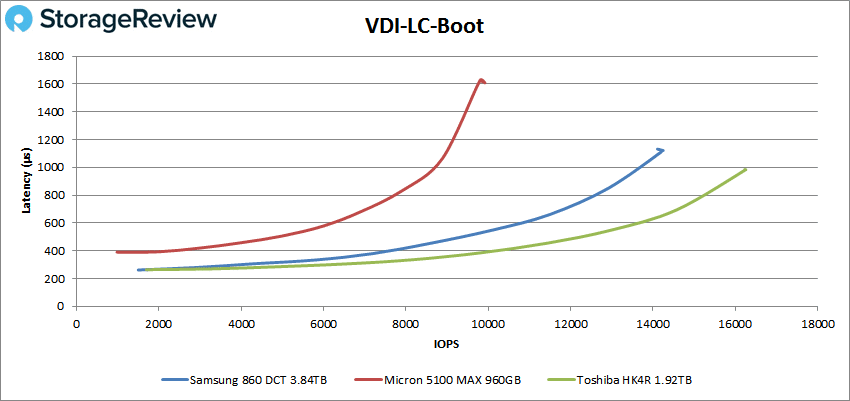
Switching over to Linked Clone (LC), in the boot test the Samsung was in second place with sub-millisecond latency until about 13K IOPS and a peak performance of 14,222 IOPS and a latency of 1.11ms.
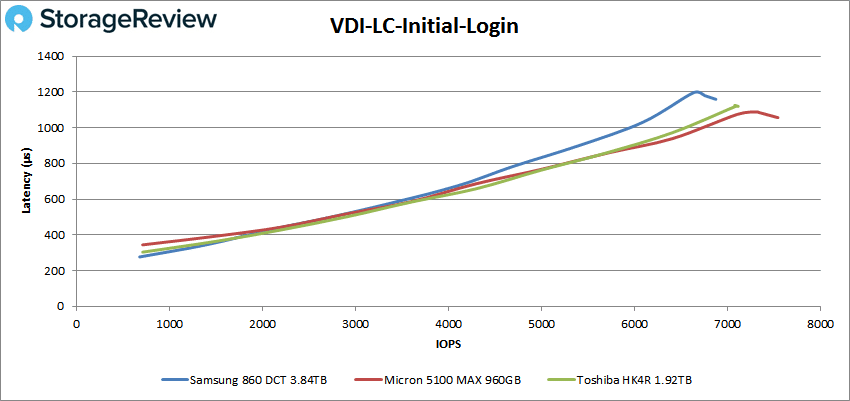
VDI LC Initial Login had the drive drop back to third place with a peak performance of 6,867 IOPS and a latency of 1.17ms. The drive performed under 1ms until about 6K IOPS.
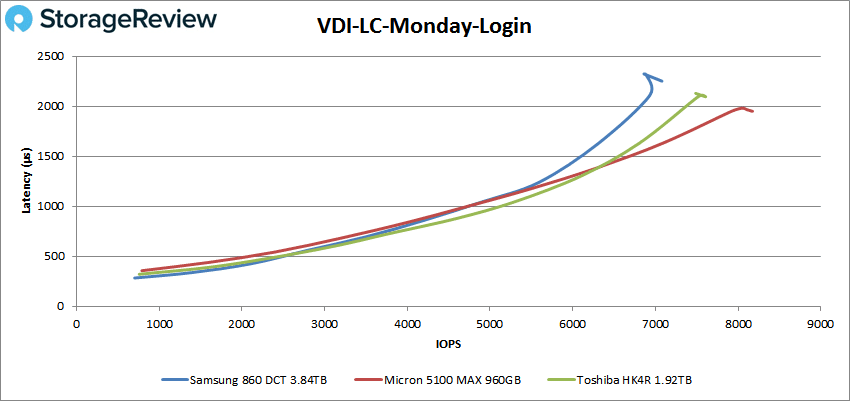
And finally, VDI LC Monday Login had the drive come in last with peak performance of 7,078 IOPS and a latency of 2.25ms. The drive had sub-millisecond latency until about 4,900 IOPS.
Conclusion
The Samsung 860DCT is the company’s new data center SATA SSD. The 860DCT is a 2.5” form factor SSD with capacities as high as 3.84TB. The drive is built off of Samsung’s proven 3D V-NAND technology and is built for some serious endurance, 1,396 total TB written on the 3.84TB model. Samsung quotes sequential speeds up to 550MB/s read and up to 520MB/s write with random speeds of 98K IOPS read and 19K IOPS write. The drive is all about read-intensive and data-streaming data centers.
With our VDBench performance, the Samsung 860DCT’s performance came in as expected. It traded places frequently with the read-centric Toshiba HK4R, and fell back on writes compared to the write-centric Micron 5100 Max, again no surprises. The drive did take the top spot in 4K random write with about 64K IOPS and 2ms of latency. The drive hit 76K IOPS in 4k read, 430MB/s in 64K read, and 219MB/s in 64K write. In our SQL workloads the Samsung was able to maintain sub-millisecond latency with results of 42K IOPS, 38K IOPS for 90-10, and 35K IOPS for 80-20. For both our Linked and Full Clone VDI benchmarks the Samsung drive did a bit better with placement coming in second throughout both tests.
The Samsung 860DCT is not a record setter nor is it intended to be. Though in our pack it tended to come in second or third, all the drives tested were fairly close in performance in most cases. The new Samsung drive offers a lot more capacity in the same 2.5” 7mm form factor allowing for drop in SATA replacement that greatly increases density, and thus lower TCO. The Samsung 860DCT performs well for its given target with ample capacity.


 Amazon