

Earlier this year, Micron launched its new 5100 SSD family of data center drives. The family had three flavors of drives, the ECO for read-intensive workloads such as video streaming, the PRO for latency-sensitive transactional databases, and the MAX for write-intensive logging applications. In January we reviewed the ECO, finding that while it lacked in performance in some of our workloads, it did offer things such as up to 8TB (making it an ideal HDD replacement) and FlexPro firmware. For this review we will be looking at the 5100 MAX.
The MAX has been designed specifically for write-intensive applications and has much higher endurance than the ECO. All of the 5100 series come with built-in AES-256 bit encryption and TCG enterprise protection. The MAX drives also come with FIPS 140-2 validation. As with the rest of the 5100 series, the MAX can be optimized through Micron’s FlexPro firmware.
Micron 5100 MAX specifications:
- Form factor: 2.5”
- NAND: Micron 3D eTLC
- Capacity: 240GB, 480GB, 960GB, 1.92TB,
- Interface: SATA 6Gb/s
- Endurance
- DWPD: 5
- TBW: 2.2-17.6PB
- MTTF: 2M
- Performance
- Sequential read performance (128K): 540MB/s
- Sequential write performance (128K): 310-520MB/s
- Random read performance (4K): 93,000 IOPS
- Random write performance (4K): 48,000-74,000 IOPS
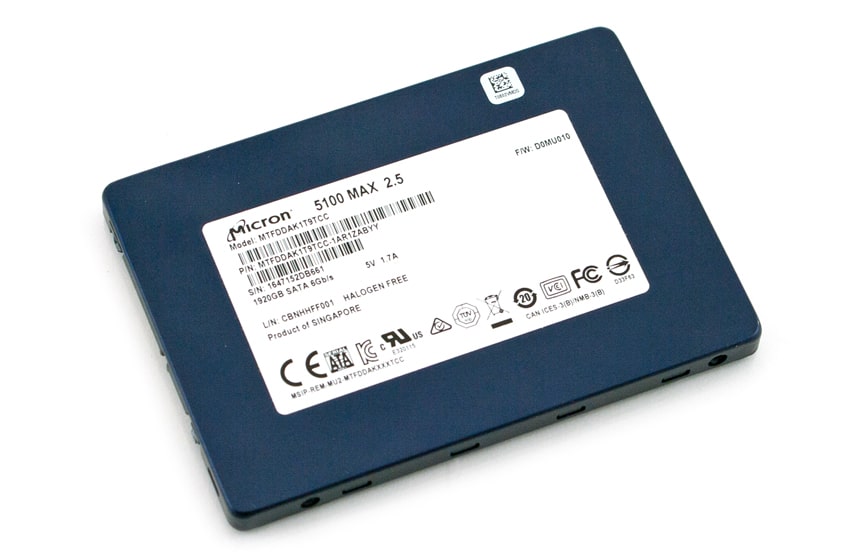
Design and Build
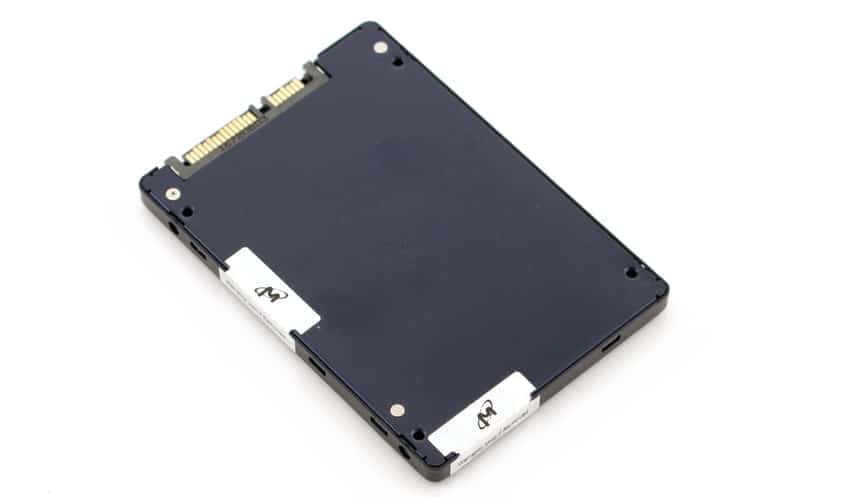
The Micron 5100 MAX has a very similar design to the ECO, in fact they are nearly identical. The drive is housed in a dark blue aluminum case with a large sticker taking up most of the real estate on the front with information such as model, capacity, and so on. The back of the drive is mostly blank with tamper proof stinkers on the corners.
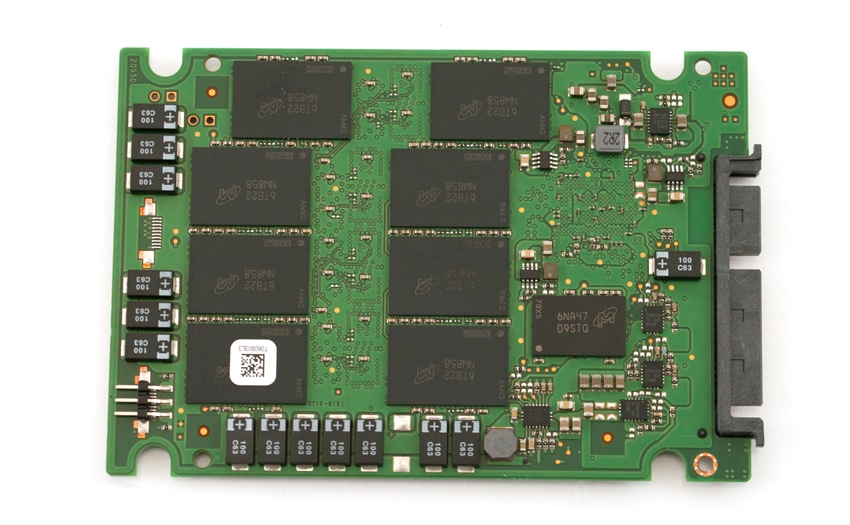
Taking off of the cover reveals the PCB with 8 Micron NAND packs on the top.
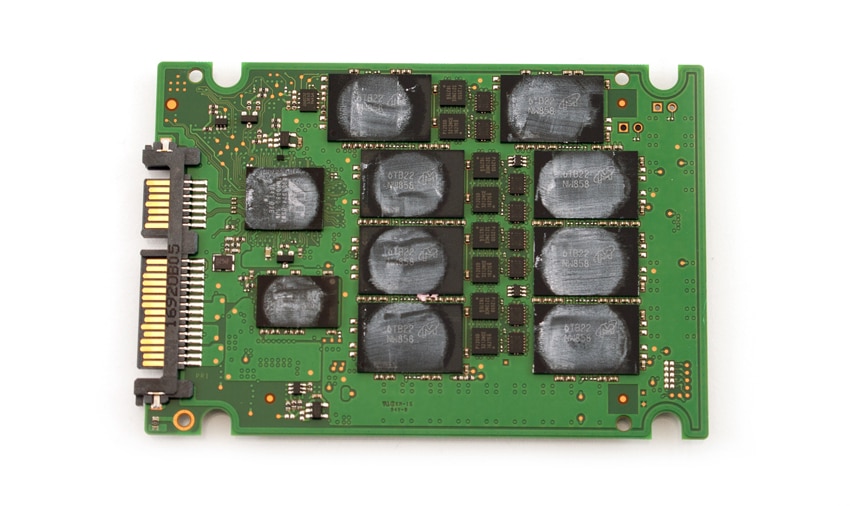
The other side of the PCB has 8 more NAND packs as well as the Micron controller and DRAM.
Testing Background and Comparables
The StorageReview Enterprise Test Lab provides a flexible architecture for conducting benchmarks of enterprise storage devices in an environment comparable to what administrators encounter in real deployments. The Enterprise Test Lab incorporates a variety of servers, networking, power conditioning, and other network infrastructure that allows our staff to establish real-world conditions to accurately gauge performance during our reviews.
We incorporate these details about the lab environment and protocols into reviews so that IT professionals and those responsible for storage acquisition can understand the conditions under which we have achieved the following results. None of our reviews are paid for or overseen by the manufacturer of equipment we are testing. Additional details about the StorageReview Enterprise Test Lab and an overview of its networking capabilities are available on those respective pages.
Comparables for this review:
- Toshiba SAS3 1.6TB PX04SMB
- Toshiba HK4R 1.92TB THNSN81Q92
- Seagate SAS3 1.6TB 1200.2
- HGST 1.6TB SAS3
- Micron ECO 1.92TB
As the capacity and performance for SATA and SAS drives increase, StorageReview has pivoted to a more aggressive testing regimen for individual SSDs. This testing process is mirrored across NVMe products as well, making the comparison process easier–even though products perform in vastly different classes at the top-end. In this review, we compare the Micron MAX to the Micron Eco and 1.92TB Toshiba HK4R, as well as three additional SAS3 products that help set a high-performance reference point. As more drives come into the test lab with a capacity greater than 1.2TB, we will continue to add comparables into this group.
Application Workload Analysis
In order to understand the performance characteristics of enterprise storage devices, it is essential to model the infrastructure and the application workloads found in live production environments. Our first benchmarks for the Micron 5100 MAX are therefore the MySQL OLTP performance via SysBench and Microsoft SQL Server OLTP performance with a simulated TCP-C workload. For our application workloads, each drive will be running 2-4 identically configured VMs.
SQL Server Performance
Each SQL Server VM is configured with two vDisks: 100GB volume for boot and a 500GB volume for the database and log files. From a system resource perspective, we configured each VM with 16 vCPUs, 64GB of DRAM and leveraged the LSI Logic SAS SCSI controller. While our Sysbench workloads tested previously saturated the platform in both storage I/O and capacity, the SQL test is looking for latency performance.
This test uses SQL Server 2014 running on Windows Server 2012 R2 guest VMs, being stressed by Dell’s Benchmark Factory for Databases. StorageReview’s Microsoft SQL Server OLTP testing protocol employs the current draft of the Transaction Processing Performance Council’s Benchmark C (TPC-C), an online transaction-processing benchmark that simulates the activities found in complex application environments. The TPC-C benchmark comes closer than synthetic performance benchmarks to gauging the performance strengths and bottlenecks of storage infrastructure in database environments. Each instance of our SQL Server VM for this review uses a 333GB (1,500 scale) SQL Server database and measures the transactional performance and latency under a load of 15,000 virtual users.
SQL Server Testing Configuration (per VM)
- Windows Server 2012 R2
- Storage Footprint: 600GB allocated, 500GB used
- SQL Server 2014
- Database Size: 1,500 scale
- Virtual Client Load: 15,000
- RAM Buffer: 48GB
- Test Length: 3 hours
- 2.5 hours preconditioning
- 30 minutes sample period
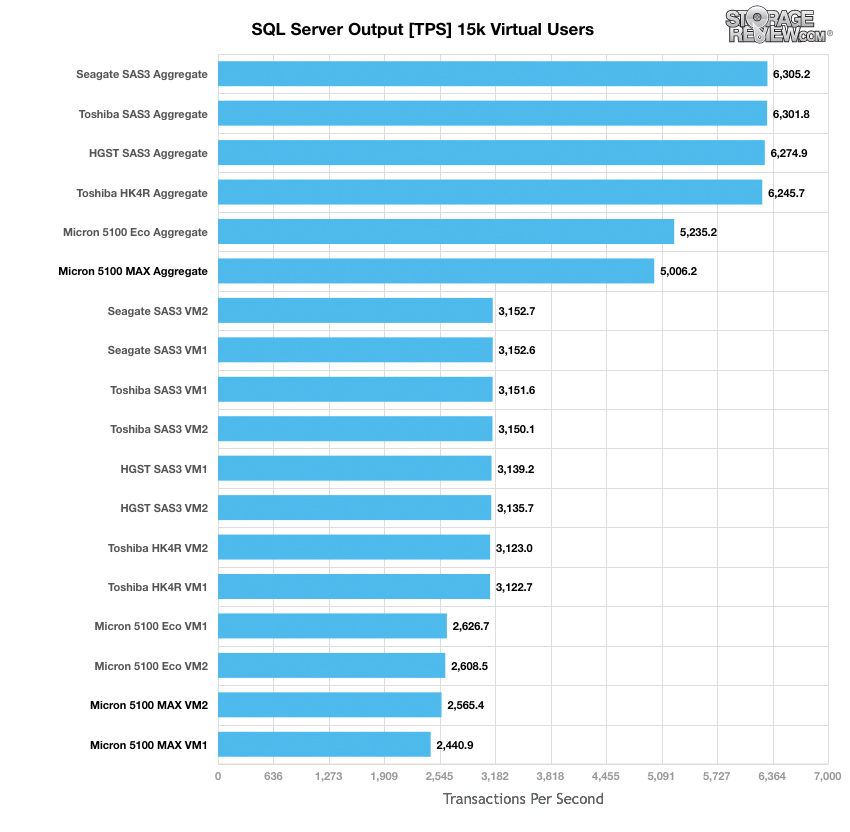
When looking at SQL Server Output, the 5100 MAX had the lowest individual scores, ranging from 2,440.9 to 2,565.4 TPS, as well as the lowest aggregate score of 5,006.2 TPS.
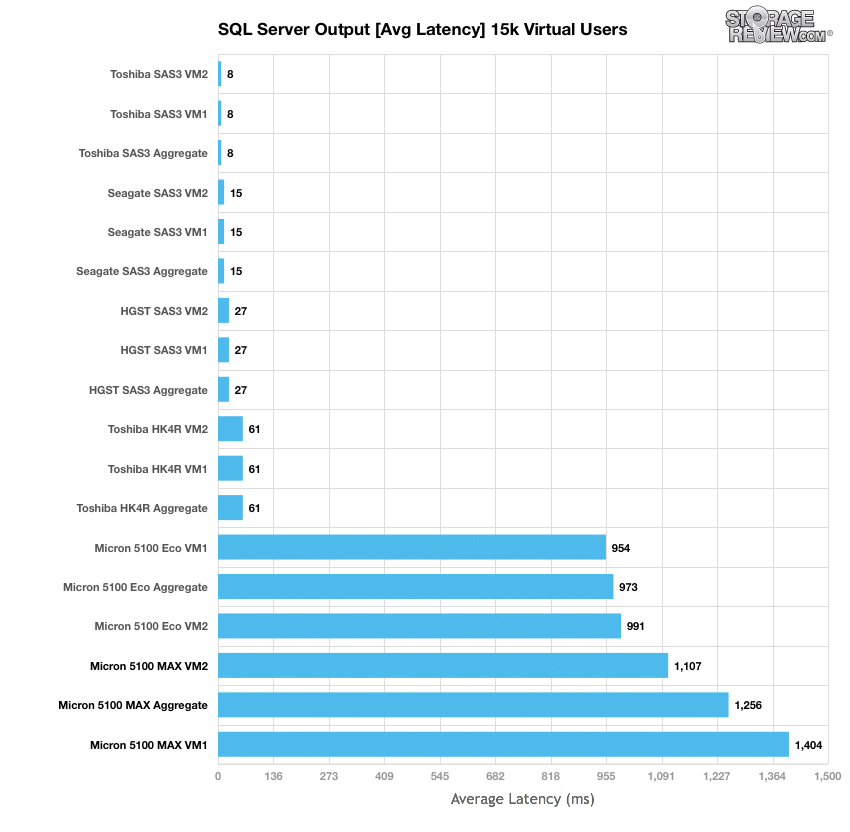
Average latency showed the 5100 MAX again place at the bottom with individual VMs placing as high as 1,107ms and 1,404ms and an aggregate score of 1,256ms.
Sysbench Performance
The next application benchmark consists of a Percona MySQL OLTP database measured via SysBench. This test measures average TPS (Transactions Per Second), average latency, and average 99th percentile latency as well.
Each Sysbench VM is configured with three vDisks: one for boot (~92GB), one with the pre-built database (~447GB), and the third for the database under test (270GB). From a system resource perspective, we configured each VM with 16 vCPUs, 60GB of DRAM and leveraged the LSI Logic SAS SCSI controller.
Sysbench Testing Configuration (per VM)
- CentOS 6.3 64-bit
- Percona XtraDB 5.5.30-rel30.1
- Database Tables: 100
- Database Size: 10,000,000
- Database Threads: 32
- RAM Buffer: 24GB
- Test Length: 3 hours
- 2 hours preconditioning 32 threads
- 1 hour 32 threads
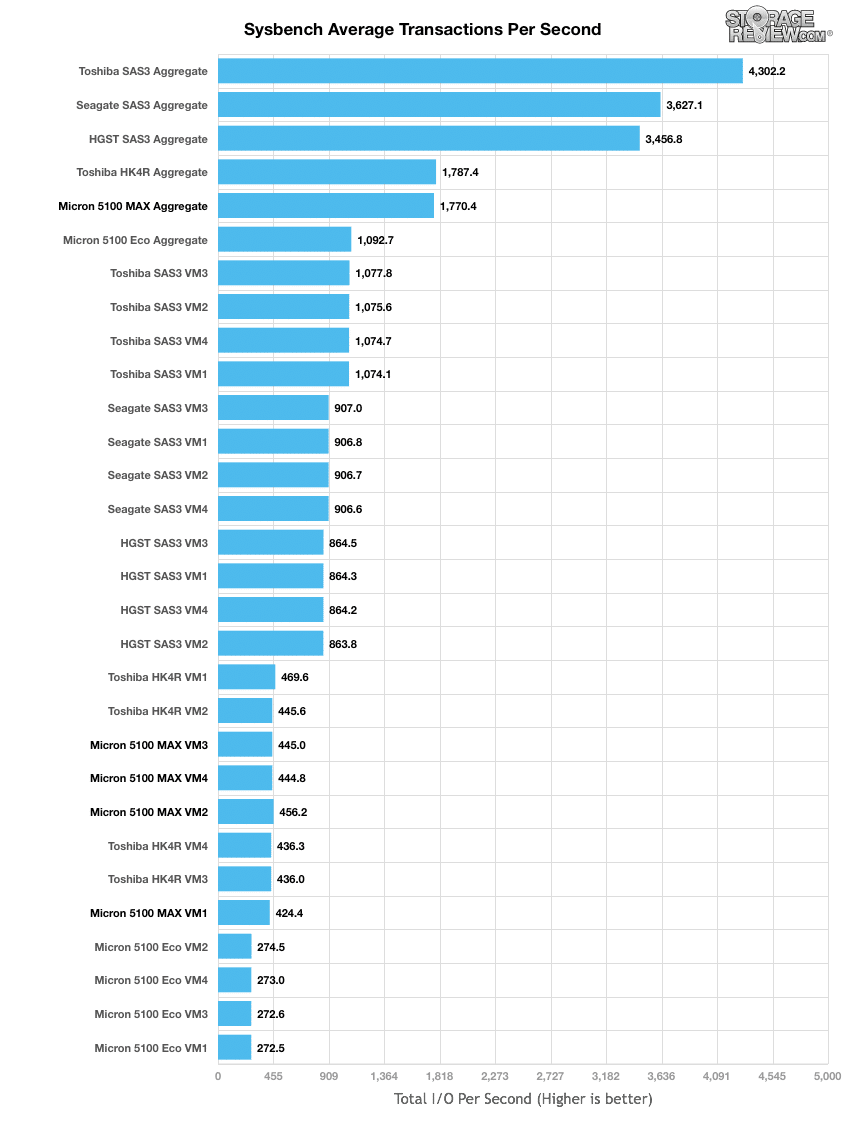
In the average transactions-per-second benchmark, the 5100 MAX was able to outperform its ECO brethern with individual VMs ranging from 424.4 TPS to 445 TPS and an aggregate score of 1,770.4 TPS.
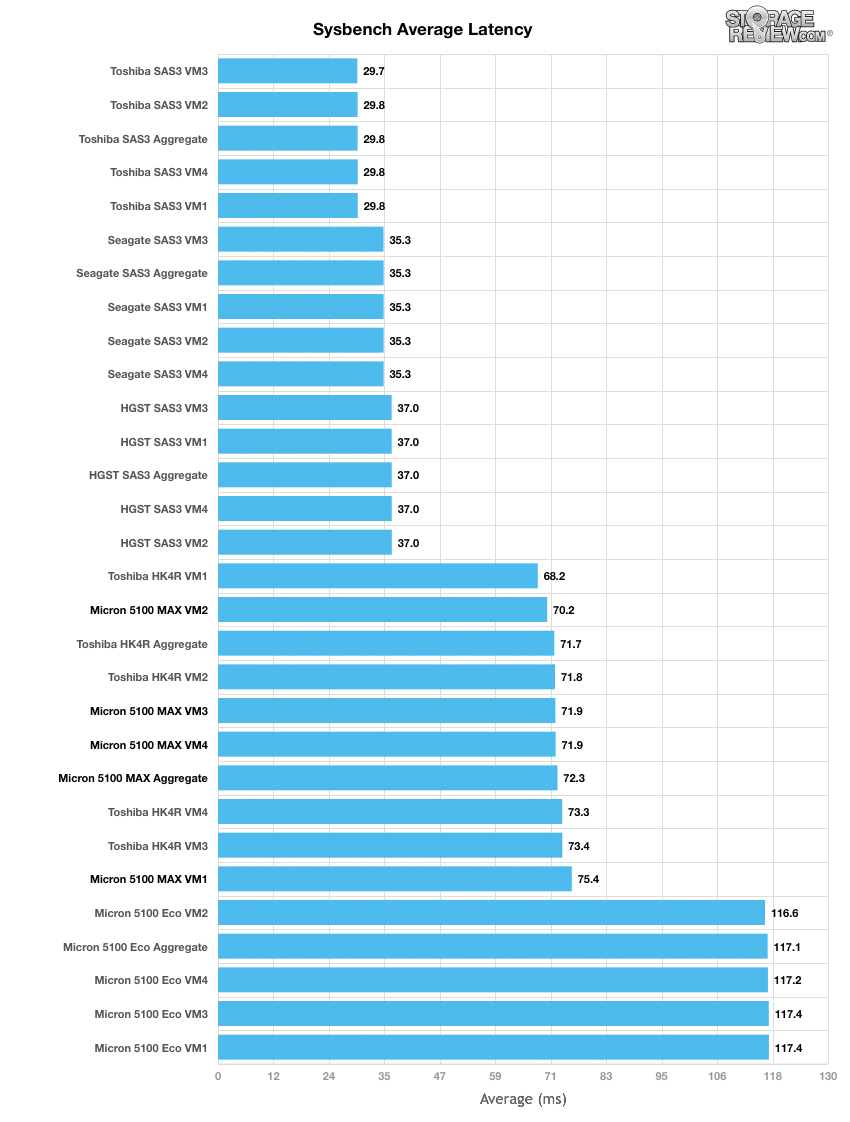
Looking at average Sysbench VM latency, we measured individual VMs between 70.2ms to 75.4ms and an aggregate of 72.3ms putting it near the bottom.
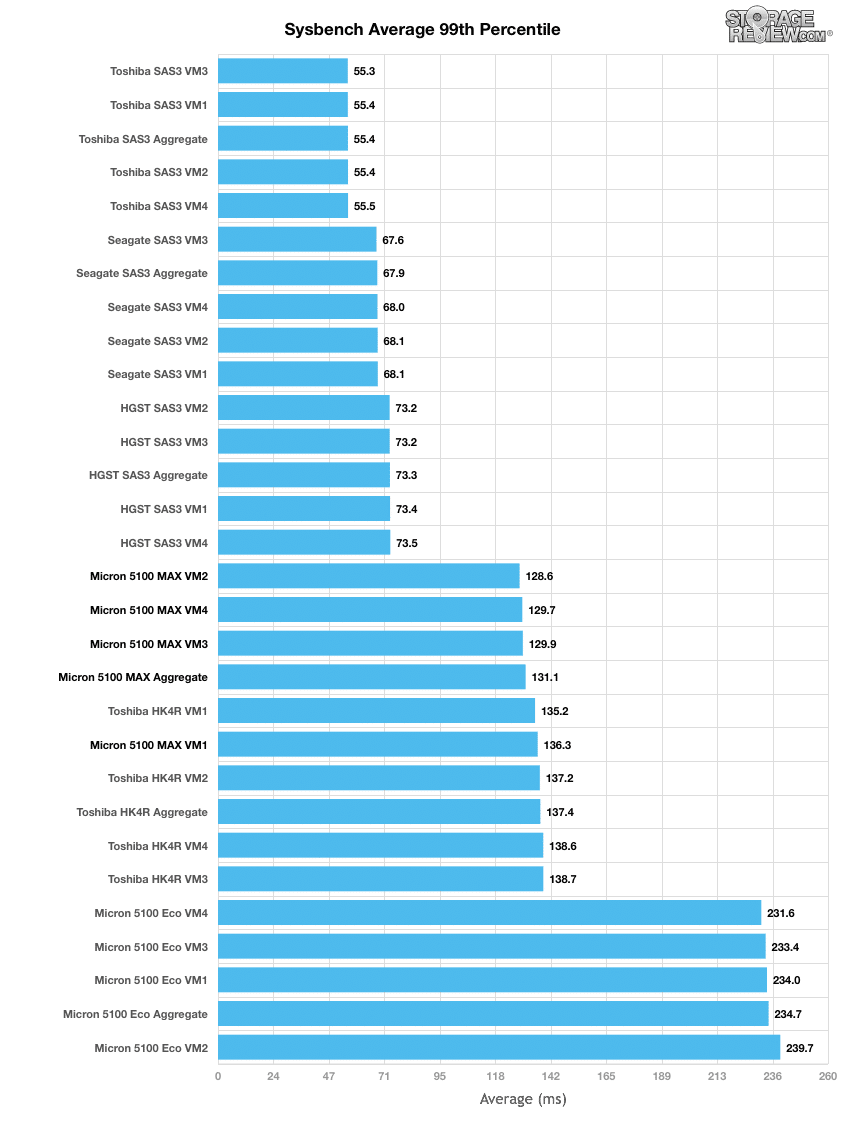
In terms of our worst-case MySQL latency scenario (99th percentile latency), the 5100 MAX placed slightly better with individual VMs ranging from 128.6ms to 136.2ms and an aggregate score of 131.1ms.
Enterprise Synthetic Workload Analysis
Flash performance varies as the drive becomes conditioned to its workload, meaning that flash storage must be preconditioned before each of the fio synthetic benchmarks in order to ensure that the benchmarks are accurate. Each of the comparable drives are preconditioned into steady-state with a heavy load of 16 threads and an outstanding queue of 16 per thread.
Preconditioning and Primary Steady-State Tests:
- Throughput (Read+Write IOPS Aggregate)
- Average Latency (Read+Write Latency Averaged Together)
- Max Latency (Peak Read or Write Latency)
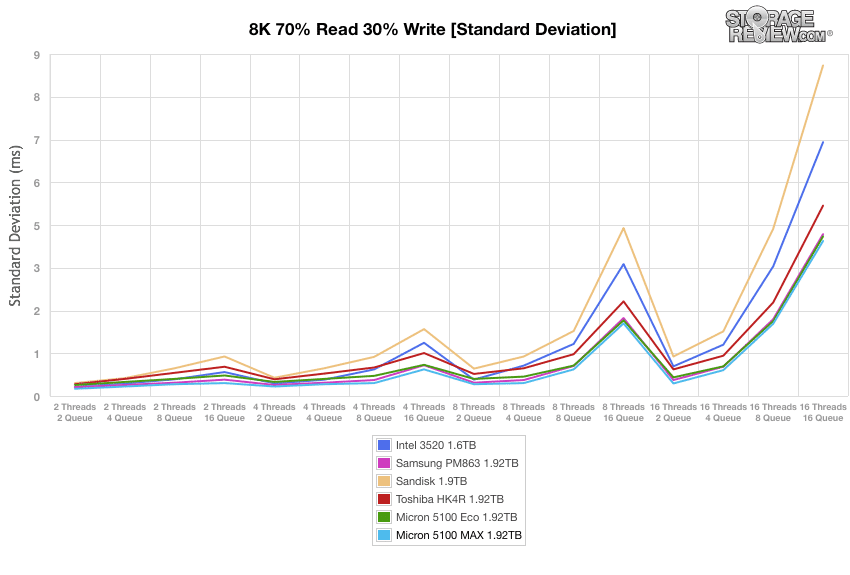
- Latency Standard Deviation (Read+Write Standard Deviation Averaged Together)
Once preconditioning is complete, each device is then tested in intervals across multiple thread/queue depth profiles to show performance under light and heavy usage. Our synthetic workload analysis for the RI SATA SSDs focuses on one profile, our 8K 70/30 mixed random workload It is important to take into consideration that synthetic workloads will never 100% represent the activity seen in production workloads, and in some ways inaccurately portray a drive in scenarios that wouldn’t occur in the real world.
- 8k
- 70% Read/30% Write
FIO Host
- Supermicro SuperServer 2028U-TNR4T+
- Dual Intel E5-2699 v3 CPUs (2.3GHz, 18-cores, 45MB Cache)
- 768GB RAM (32GB x 24 DDR4, 384GB per CPU)
- CentOS 7.2
- Supermicro AOC-S3008L-L8i HBA
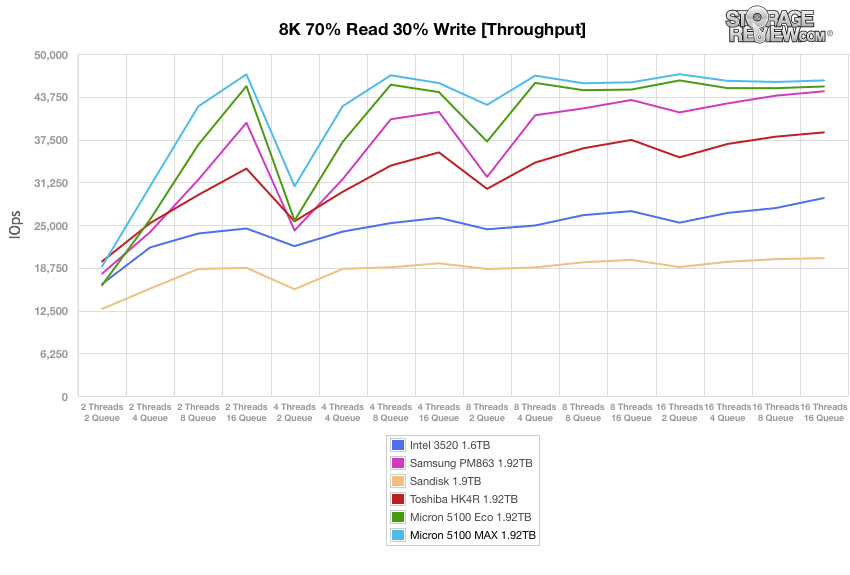
Our 8k benchmark uses a ratio of 70% read operations and 30% write operations. In our throughput test the Micron 5100 MAX ran at the top from beginning to end, peaking at 47,045 IOPS.
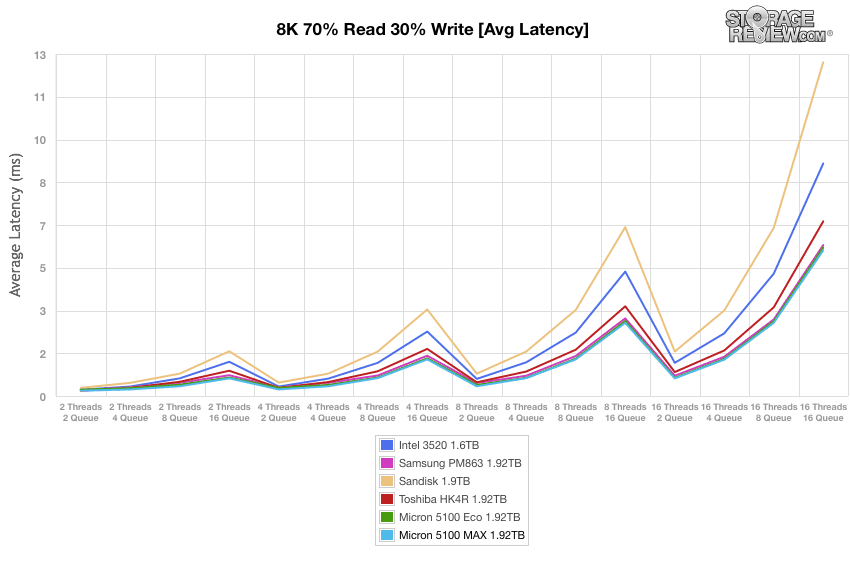
Looking at average latency, the Micron 5100 MAX was again the best performer, very narrowly beating at the other drives throughout.
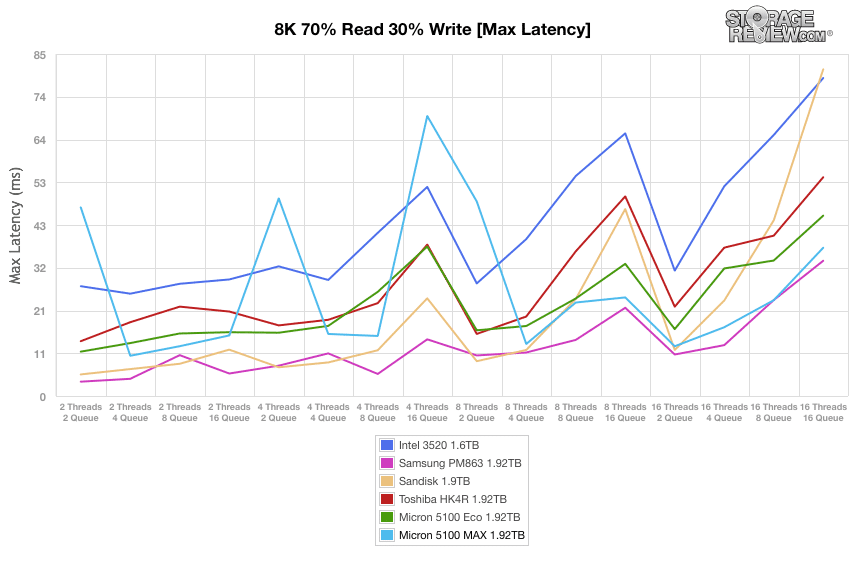
Max latency had the 5100 MAX saw a few large spikes and ended up in second.
With standard deviation, we we a repeat of average latency with the 5100 MAX being the best performer beating other drives by a hair.
Conslusion
The Micron 5100 MAX is the write-intensive, higher endurance SATA SSD in the 5100 series. The 5100 MAX has a range of capacities from 240GB to 1.92TB. and comes with FlexPro firmware giving users some ability to customize their usage. Like all of the 5100 Series, the MAX has built-in AES-256 bit encryption and TCG enterprise protection, but the MAX also comes with FIPS 140-2 validation.
The Micron 5100 MAX SSD has much more endurance than the other drives in the series but it didn’t translate into higher performance in our application workload analysis. In our benchmarks the MAX had an aggregate score of 5,006.2 TPS and 1,256ms latency in SQL Server. Performance has overall better in Sysbench with an aggregate score of 1,770.4 TPS, an aggregate latency of 72.3ms, and a worst-case scenario latency of 131.1ms.
We also looked at synthetic with the Micron 5100 MAX where the drive performed much better. Only looking at 8k 70/30, we saw the 5100 MAX be the top performer in throughput, average latency, and standard deviation. The only benchmark was the MAX didn’t take the first spot, max latency, the drive did land in second. Overall while we weren’t pleased with its application-level performance in our specific tests, the synthetic data does show the drive has potential in other areas.
Pros
- High endurance
- Secure options including FIPS 140-2
- Strong Synthetic performance
Cons
- Overall poor application workload analysis performance
The Bottom Line
The Micron 5100 MAX is a SATA SSD for data centers were endurance for write-intensive tasks are paramount; balanced with an approachable price point.


 Amazon