
 The WD Blue SN550 is the company’s newest mainstream NVMe SSD and successor to the SN500, which we reviewed earlier this year. The new WD drive is a consumer, entry-level drive all packed inside the small M.2 2280 form factor. This includes an in-house controller, firmware, and their latest 3D NAND. As such, this makes it ideal for PC users looking to improve overall system performance over traditional SATA SSDs and especially HDDs, for jobs including booting and application load speeds. It’s also perfect for those looking to move to an NVMe-based SSD at a very affordable cost.
The WD Blue SN550 is the company’s newest mainstream NVMe SSD and successor to the SN500, which we reviewed earlier this year. The new WD drive is a consumer, entry-level drive all packed inside the small M.2 2280 form factor. This includes an in-house controller, firmware, and their latest 3D NAND. As such, this makes it ideal for PC users looking to improve overall system performance over traditional SATA SSDs and especially HDDs, for jobs including booting and application load speeds. It’s also perfect for those looking to move to an NVMe-based SSD at a very affordable cost.
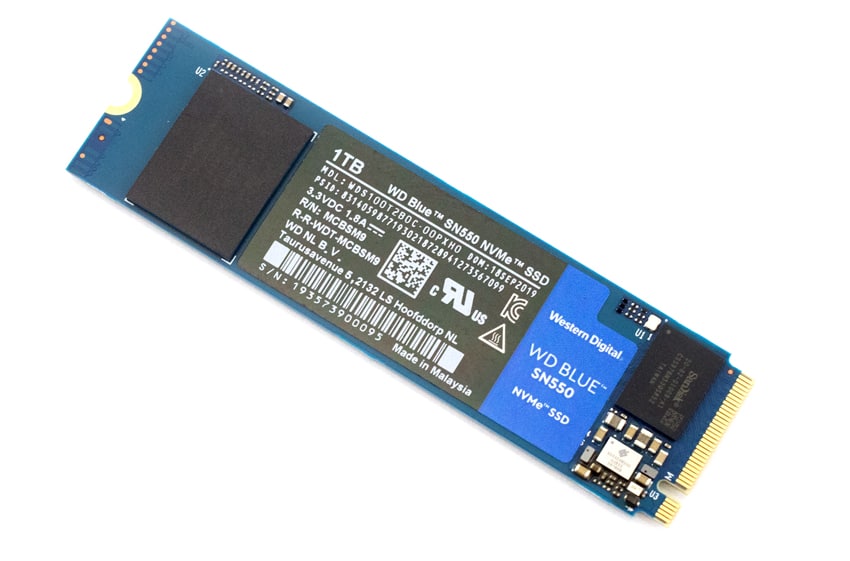
WD quotes solid performance numbers, including up to 2,400MB/s and 1,950MB/s for sequential reads and writes, and 170,000 IOPS and 135,000 IOPS for random reads and writes, respectively, for the 1TB model. Those working in resource-heavy environments, such as 4K/8K video, large document files or storage-intensive applications, would certainly benefit from these speeds.
The SN550 also supports the Western Digital SSD Dashboard, which constantly monitors the health of the SSD and maintains optimal performance. With its user-friendly graphical interface, this dashboard includes easy-to-use tools for analyzing drives including the drive model, capacity, firmware version, SMART attributes and firmware updates.
Backed by a 5-year warranty, the SN550 is available in capacities of 250GB, 500GB and 1TB.
WD Blue SN550 Specifications
| Interface |
M.2 22801 PCIe Gen3 8 Gb/s, up to 4 Lanes |
||
| Formatted |
250GB, 500GB, 1TB |
||
| Performance | |||
| 250GB | 500GB | 1TB | |
| Sequential Read (MB/s) | up to 2,400 | up to 2,400 | up to 2,400 |
| Sequential Write (MB/s) | up to 950 | up to 1,750 | up to 1,950 |
| Random Read 4KB IOPS | up to 170K | up to 300K | up to 410K |
| Random Write 4KB IOPS | up to 135K | up to 135K | up to 135K |
| Endurance (TBW) | 150 | 300 | 600 |
|
Power |
|||
| Average Active Power | 75 | 75 | 75 |
| Low Power (PS3) | 20mW | 20mW | 20mW |
| Sleep (PS4) (low power) | 5mW | 5mW | 5mW |
| Maximum Operating Power | 3.5W | 3.5W | 3.5W |
|
Environmental |
|||
| Operating Temperatures | 32°F to 158°F (0°C to 70°C) | ||
| Non-operating Temperatures | -67°F to 185°F (-55°C to 85°C) | ||
| Operating Vibration | 5.0 gRMS, 10–2000 Hz, 3 axes | ||
| Non-Operating Vibration | 4.9 gRMS, 7–800 Hz, 3 axes 4 | ||
| Shock | 1,500 G @ 0.5 msec half sine | ||
| Limited Warranty | 5 years | ||
Performance
Testbed
The test platform leveraged in these tests is a Dell PowerEdge R740xd server. We measure SATA performance through a Dell H730P RAID card inside this server, although we set the card in HBA mode only to disable the impact of RAID card cache. NVMe is tested natively through an M.2 to PCIe adapter card. The methodology used better reflects end-user workflow with the consistency, scalability and flexibility testing within virtualized server offers. A large focus is put on drive latency across the entire load range of the drive, not just at the smallest QD1 (Queue-Depth 1) levels. We do this because many of the common consumer benchmarks don't adequately capture end-user workload profiles.
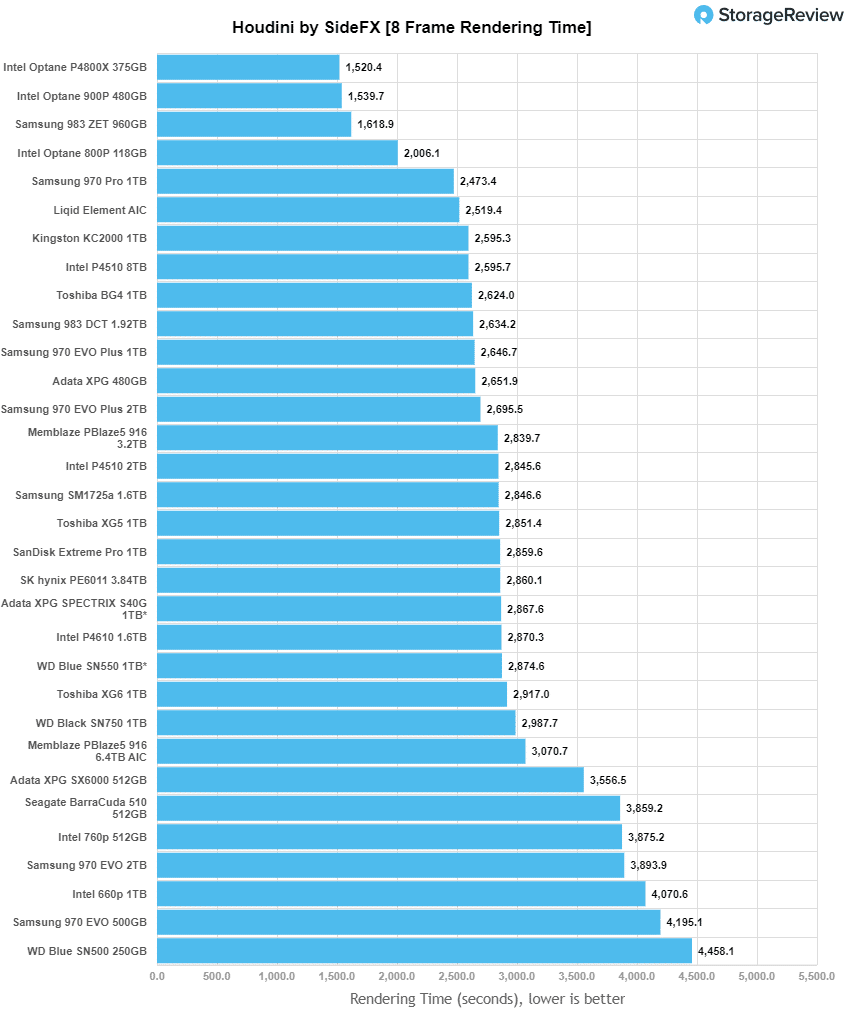
Houdini by SideFX
The Houdini test is specifically designed to evaluate storage performance as it relates to CGI rendering. The test bed for this application is a variant of the core Dell PowerEdge R740xd server type we use in the lab with dual Intel 6130 CPUs and 64GB DRAM. In this case we installed Ubuntu Desktop (ubuntu-16.04.3-desktop-amd64) running bare metal. Output of the benchmark is measured in seconds to complete, with fewer being better.
The Maelstrom demo represents a section of the rendering pipeline that highlights the performance capabilities of storage by demonstrating its ability to effectively use the swap file as a form of extended memory. The test does not write out the result data or process the points in order to isolate the wall-time effect of the latency impact to the underlying storage component. The test itself is composed of five phases, three of which we run as part of the benchmark, which are as follows:
- Loads packed points from disk. This is the time to read from disk. This is single threaded, which may limit overall throughput.
- Unpacks the points into a single flat array in order to allow them to be processed. If the points do not have dependency on other points, the working set could be adjusted to stay in-core. This step is multi-threaded.
- (Not Run) Process the points.
- Repacks them into bucketed blocks suitable for storing back to disk. This step is multi-threaded.
- (Not Run) Write the bucketed blocks back out to disk.
Looking at the performance of rendering time (where less is better), the WD550 found itself in the lower-half of the leaderboard with 2,874.6 seconds, though this was a significant improvement over the previous generation.
SQL Server Performance
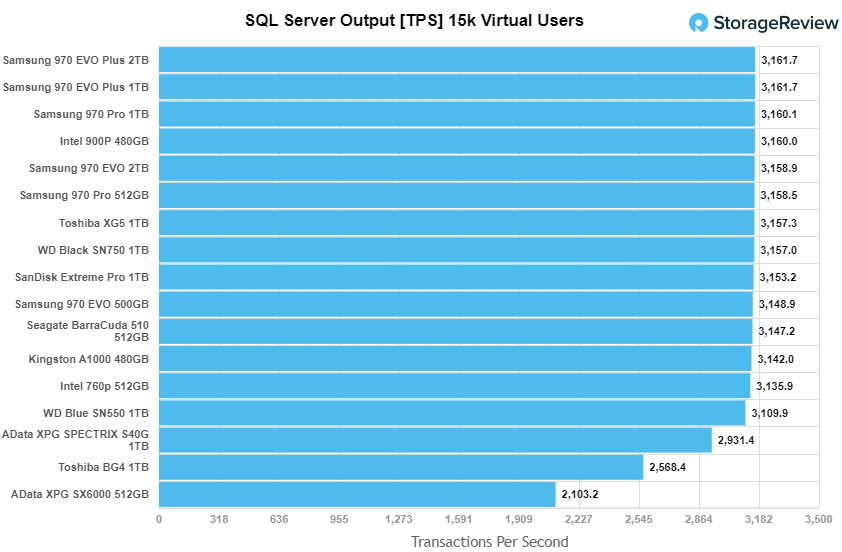
We use a lightweight virtualized SQL Server instance to appropriately represent what an application developer would use on a local workstation. The test is similar to what we run on storage arrays and enterprise drives, just scaled back to be a better approximation for behaviors employed by the end user. The workload employs the current draft of the Transaction Processing Performance Council’s Benchmark C (TPC-C), an online transaction processing benchmark that simulates the activities found in complex application environments.
The lightweight SQL Server VM is configured with three vDisks: 100GB volume for boot, a 350GB volume for the database and log files, and a 150GB volume used for the database backup we recover after each run. From a system resource perspective, we configure each VM with 16 vCPUs, 32GB of DRAM and leverage the LSI Logic SAS SCSI controller. This test uses SQL Server 2014 running on Windows Server 2012 R2 guest VMs and is stressed by Dell's Benchmark Factory for Databases.
SQL Server Testing Configuration (per VM)
- Windows Server 2012 R2
- Storage Footprint: 600GB allocated, 500GB used
- SQL Server 2014
- Database Size: 1,500 scale
- Virtual Client Load: 15,000
- RAM Buffer: 24GB
- Test Length: 3 hours
- 2.5 hours preconditioning
- 30 minutes sample period
When looking at SQL Server Output, the WD 550 recorded lower-end results with 3,109.9 TPS.
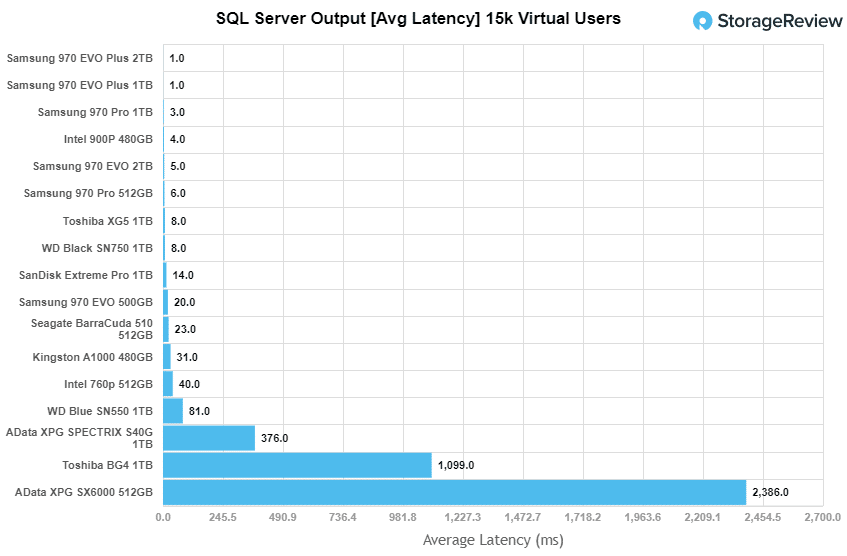
Looking at average latency in the same test, the WD 550 again placed near the bottom with 81.0ms.
VDBench Workload Analysis
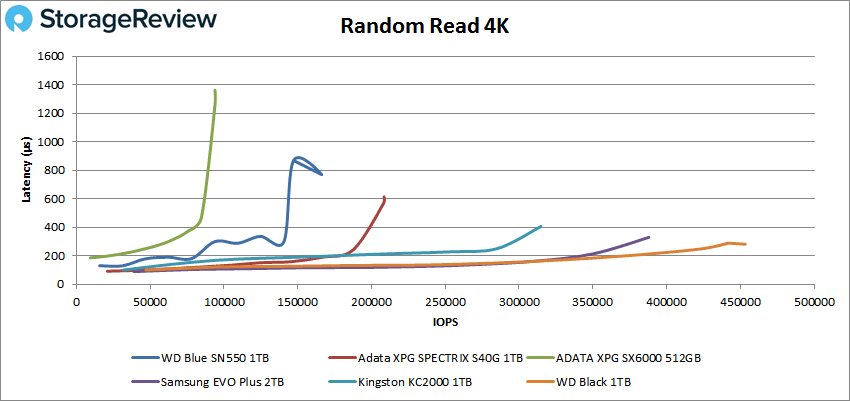
In our first VDBench Workload Analysis, we looked at random 4K read performance. Here, the SN550 started below 130ms and went on to peak at 387,943 IOPS with a latency of 769.2ms, well behind most of the tested SSDs.
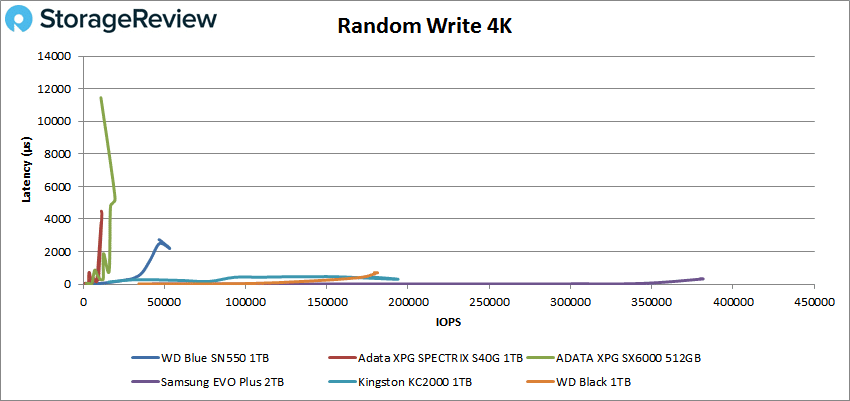
Next up is our random 4K write where we saw the SN550 expectedly behind the higher-class SSDs again, peaking at 53,296 IOPS with a latency of 2,194.4ms
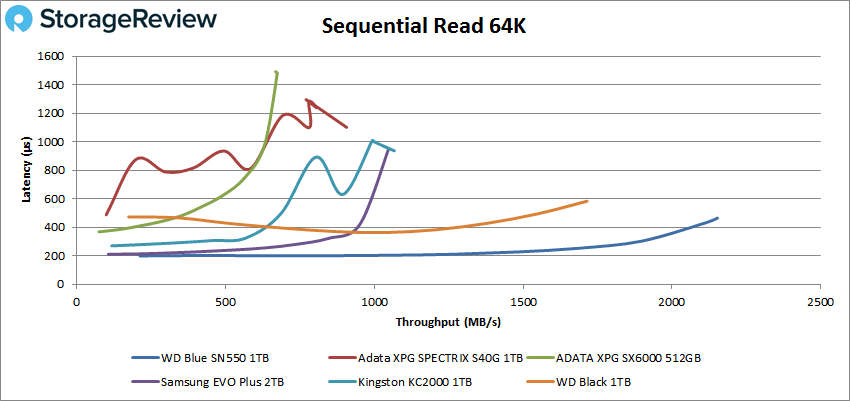
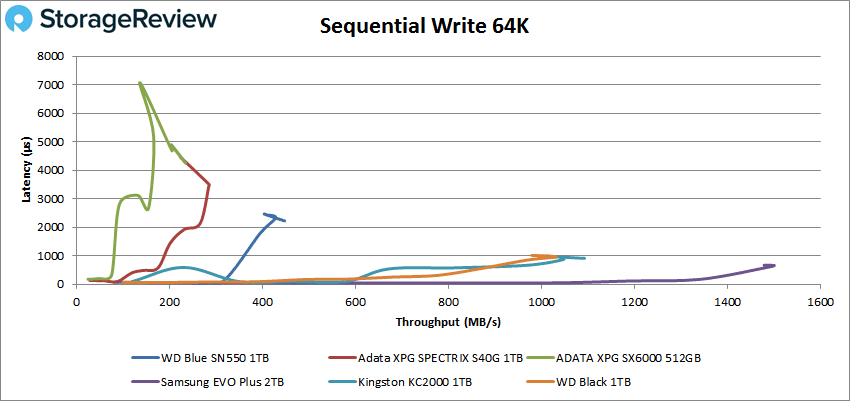
When switching over to sequential benchmarks, the SN550 showed a huge change in performance for in the 64K read test. Here, the WD drive boasted peak performance of an impressive 34,438 IOPS or 2.15GB/s at a latency of 463.9ms for top spot.
With 64K writes, the SN550 showed a peak performance of 2,222 IOPS or 448GB/s at a latency of 2,217ms.
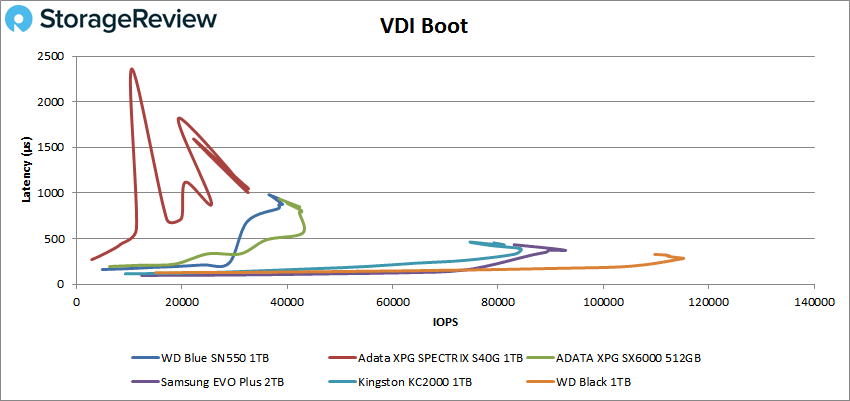
Next, we looked at our VDI benchmarks. This benchmark is designed to tax the drives even further and include Boot, Initial Login, and Monday Login tests. Looking at the Boot test, the WD SN550 was behind in the pack with performance at 39,128 IOPS at a latency of 875ms.
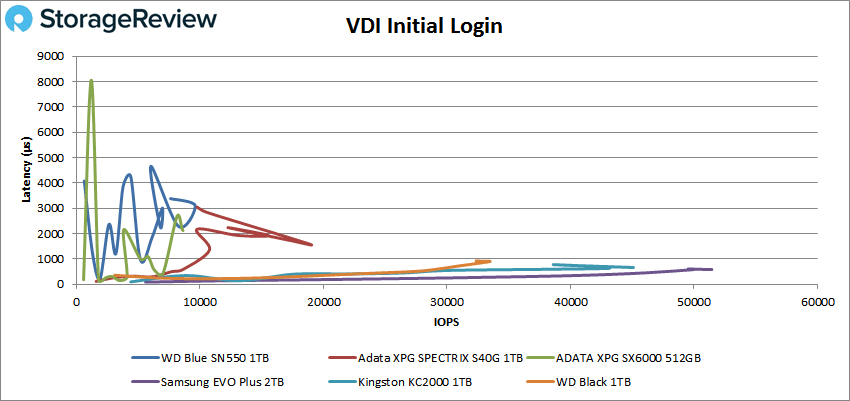
With VDI Initial Login, the SN550 placed well behind the leaders again with peak performance of 9,608 IOPS and a latency of 3,110ms.
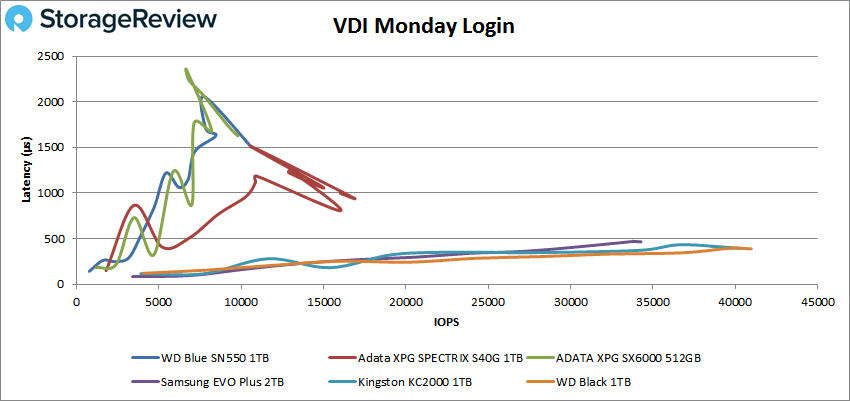
Finally, with VDI Monday Login the WD SN550 again struggled to keep up with the leaders, showing a peak performance of 10,611 IOPS and a latency of 1,500ms.
Conclusion
The WD Blue SN550 is the company’s newest entry-level NVMe SSD of the M.2 2280 form factor, featuring an in-house controller, firmware and their latest 3D NAND. Though certainly not on the same level as more premium consumer NVMe drives like the Samsung 970, the SN550 is still a good (and very affordable) option for users looking to improve overall system performance when compared to SATA SSDs and HDDs.
The SN550 offered a huge step up in performance from the SN500 replaced, although it still lagged behind some other SSDs in its market segment. Looking at Application Workload Analysis performance, the SN550 recorded lower-end results for the consumer segment with 3,109.9 and 81.0ms for TPS and average latency, respectively, during SQL Server Output. The SN550’s placement in Houdini was 2,874.6 seconds, placing it in the bottom segment of the leaderboard.
In 4K reads and writes, the WD drive showed lower-end results with 387K IOPS and 53K IOPS, respectively. Switching over to 64K reads, the SN550 showed a huge improvement with the former, posting an impressive 2.15GB/s, which easily took top spot. Writes, however, were at the lower end with 448MB/s. Our VDI benchmarks showed numbers well below the average with 39,128 IOPS for Boot, 9,608 IOPS for Initial Login, and 10,611 IOPS for Monday Login; the last two numbers were surprisingly less than the SN500 as well.
Though the SN550 showed less than stellar results (with the exception of its impressive sequential read performance), the price-per-GB is really hard to beat for an NVMe drive, going for roughly $125 at the time of this review for the 1TB model. Moreover, those using the drive for general usage, casual gaming and upgrading from SATA-based system won’t see much of a real-world performance difference compared to higher-end drives.