

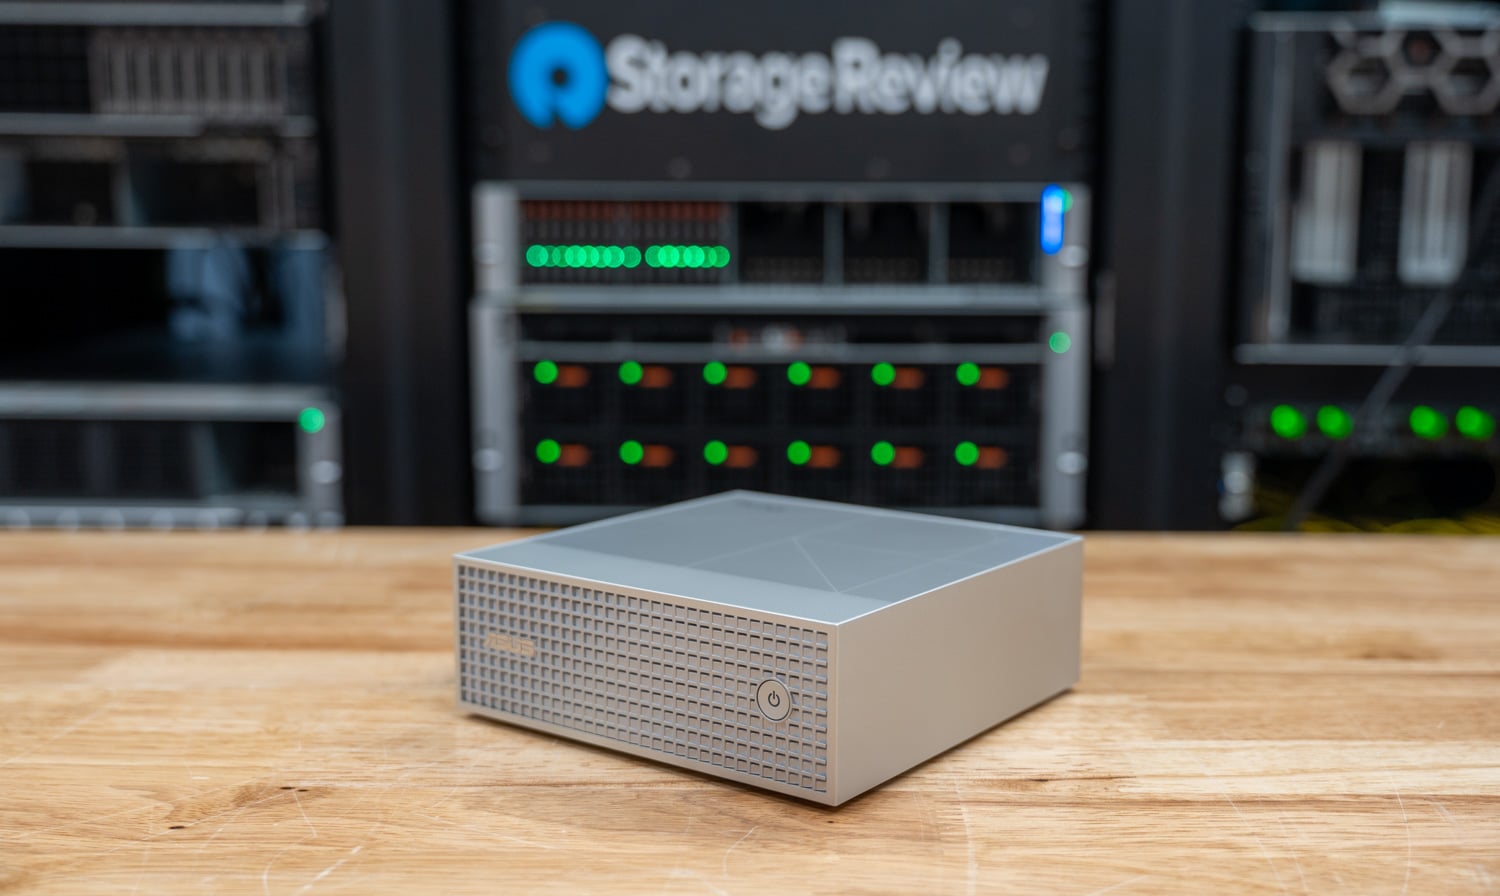
The ASUS ProArt GR1X packs NVIDIA’s RTX Spark N1X into a 150mm-square, 1.15-liter desktop with two M.2 2280 SSD slots, 10GbE, and a dual-fan cooler ASUS built to sustain 140W. Our review unit is the 64GB configuration with a 1TB PCIe Gen4 SSD and Windows 11 Pro. We tested it alongside MSI’s 128GB EdgeMesa N AI+, the other RTX Spark mini PC in our lab, and the two fastest RTX Spark laptops we have reviewed, to measure how much a desktop cooler affects the same 20-core chip.
Principais lições
- The GR1X stayed under 90C through our 30-minute Cinebench loop. It averaged 83.3C and peaked at 88.7C, while the HP OmniBook Ultra 16 and Dell XPS 16 Creator Edition both averaged 97C and sat at their 98C limit. MSI’s EdgeMesa N AI+ mini PC averaged 88.4C in the same loop and peaked at 107.3C.
- The cooler is worth 5 to 12 percent in sustained CPU work. The GR1X held 7,306 points in the loop’s steady state against 6,970 and 6,550, and its x265 encode ran at 44.1 fps against 40.6 and 38.8. The EdgeMesa was level at 7,276 points and 43.7 fps.
- Two M.2 2280 slots are the design win. ASUS lists PCIe 5.0 and 4.0 support with up to 4TB, and the second slot takes standard retail drives for models and datasets.
- The 1TB Gen4 SSD in our unit is the part to upgrade. It read at 6,511MB/s, and a cold load of a 12.8GB model took 10.94 seconds against 7.00 and 6.70 on the Gen5 drives in the EdgeMesa and the HP.
- Concurrent LLM serving showed the widest gap over the laptops. With eight requests on Qwen3.8 27B, the GR1X generated 40.0 tokens per second and the EdgeMesa 39.8, against 33.8 and 31.9 on the laptops, while single-request results stayed within 6 percent.
- The 64GB configuration covered models through the 27B class. It served Qwen3.8 27B with eight concurrent requests at the default memory allocation, while the 128GB EdgeMesa also ran Qwen-Image at Q8 and a 35B coding-agent model.
Where the GR1X Sits in ASUS’s RTX Spark Lineup
ASUS introduced its RTX Spark systems under the ProArt creator brand, and the GR1X is the desktop in a family that also includes the 16-inch ProArt P16 and 14-inch ProArt P14 laptops. The company separately sells the Ascensão GX10, a DGX Spark system that runs NVIDIA’s Linux-based DGX OS for AI development. The GR1X is the Windows counterpart, and ASUS describes it as a machine for prosumers, AI-powered creators, workflow builders, developers, and gamers who want local agents inside everyday Windows applications.
ASUS offers the GR1X with 64GB or 128GB of LPDDR5X-9400 unified memory, in black or silver, and with Windows 11 Home or Pro. The software list includes ProArt Creator Hub, the StoryCube and MuseTree creative applications, validated ComfyUI workflows, and a three-month Adobe Creative Cloud subscription. ASUS’s US product page shows the system as coming soon and does not list a price for either memory configuration.
ASUS credits the platform with up to 1 petaFLOP of FP4 AI performance, 120B-parameter LLMs with up to 1 million tokens of context, 3D scenes up to 90GB, and 1440p gaming above 100 fps. The company’s RTX Spark overview qualifies the model figures as capacity guidance that assumes suitable quantization, and it ties 70B and 120B-class models to the 128GB configuration. That qualifier matters for this review, because our unit is the 64GB configuration.
Design e Construção
The GR1X measures 150 x 150 x 51mm and weighs 1.48kg, which works out to 1.15 liters, in line with the 1.1 liters ASUS quotes. The MSI EdgeMesa N AI+ comes to 1.18 liters at 152 x 147 x 53mm and weighs 1.32kg, so the two RTX Spark mini PCs take up about the same space on a desk, with the ASUS about 160g heavier.
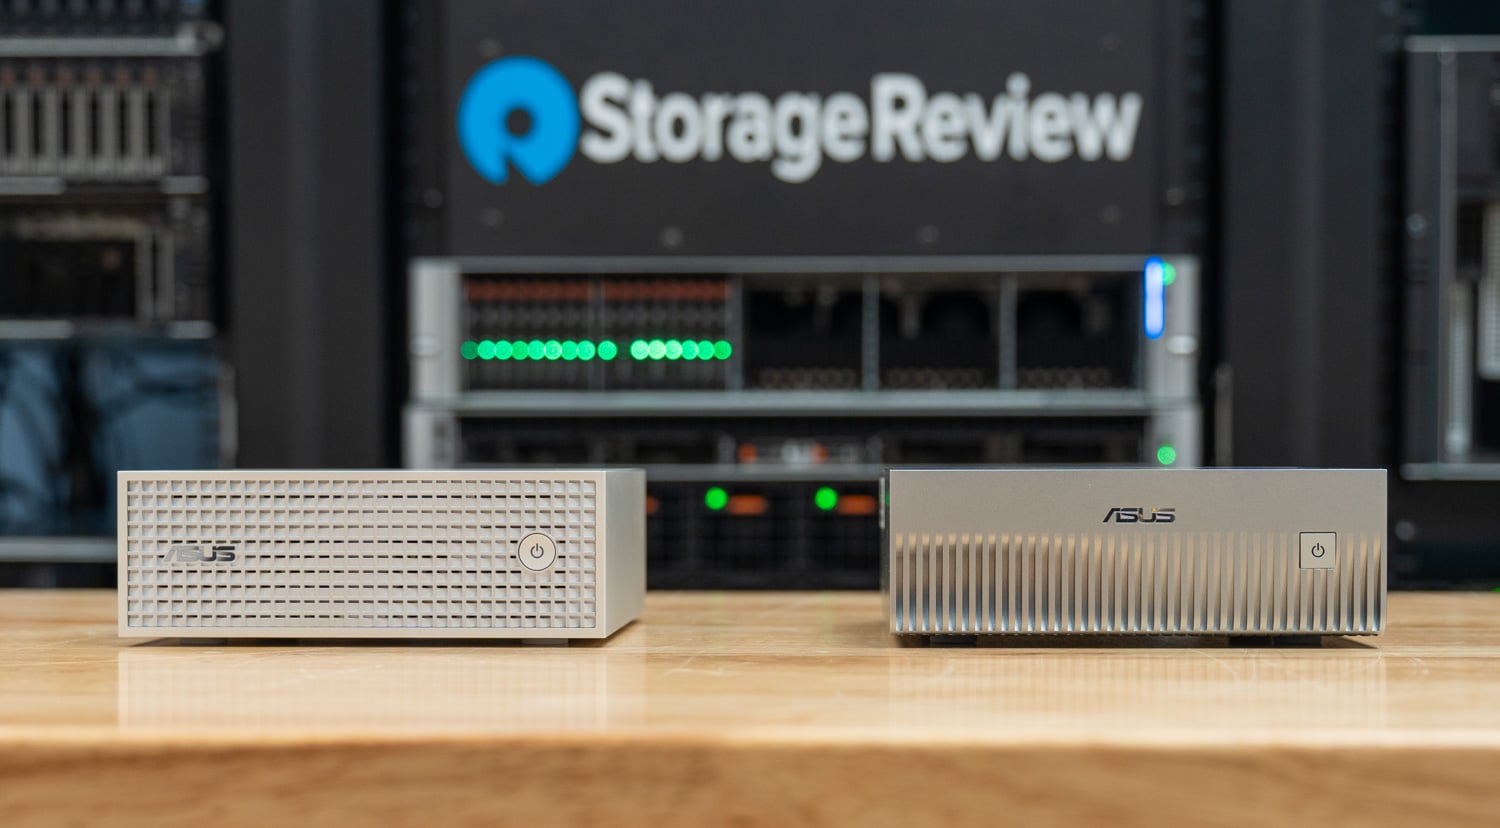
The black version has an anodized finish, and the silver version is sandblasted, both with an anti-fingerprint matte coating, and the Wi-Fi antenna sits under a textured, glass-like panel. A power button with an LED is the only control on the front. Power arrives over USB Type-C from a 240W adapter, so there is no barrel connector on the chassis.
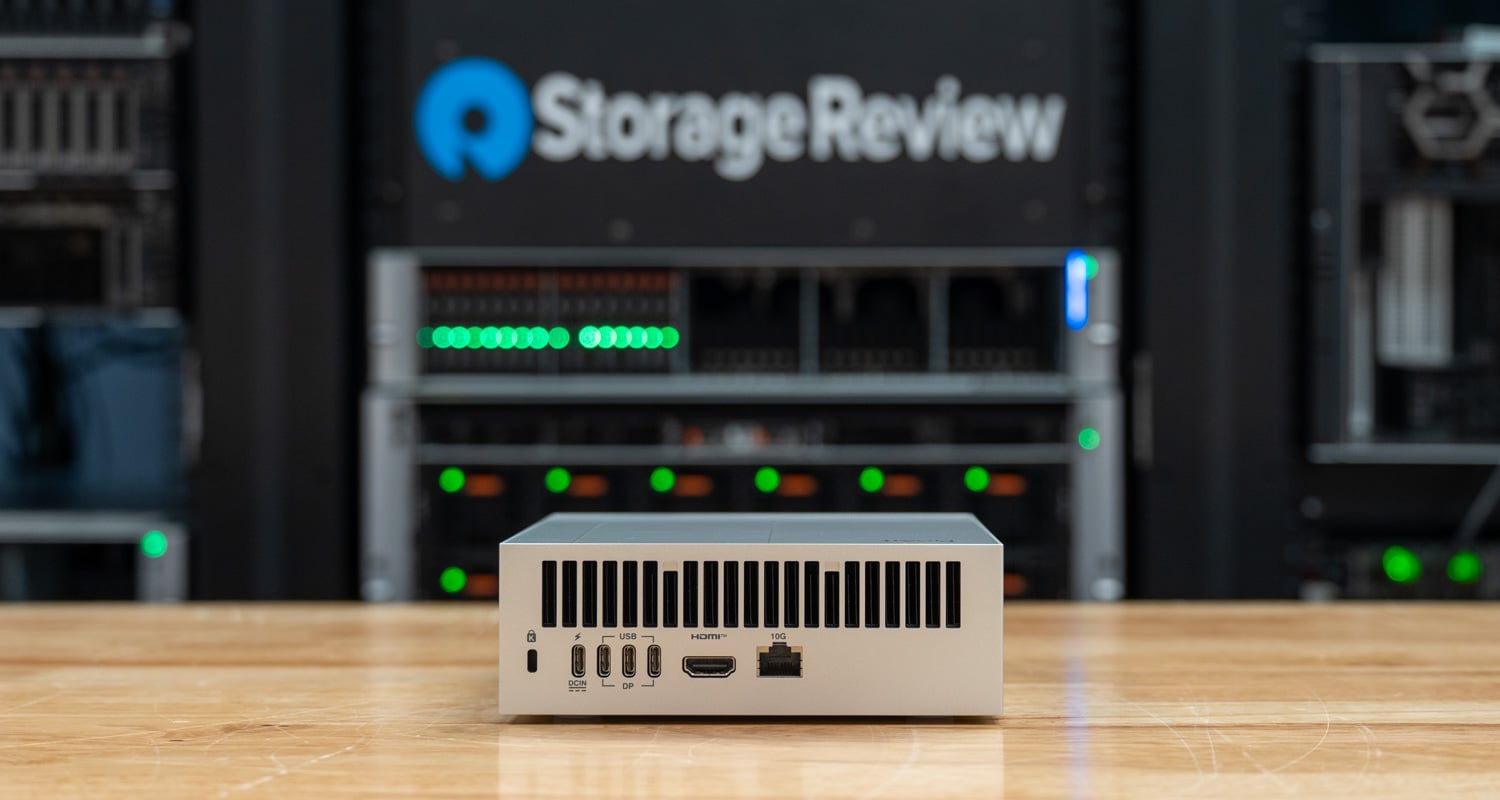
ASUS places every port on the rear panel: four USB Type-C ports at 20Gbps, HDMI 2.1, a 10GbE RJ45 port, and a Kensington lock slot. Three of the Type-C ports support DisplayPort Alt Mode, and the fourth is the power input under the USB PD 3.1 EPR specification. Wireless is Wi-Fi 7 with a 2×2 radio and Bluetooth 5.4. The system drives up to four displays through HDMI and the three DisplayPort-capable ports. ASUS lists no USB Type-A port, no audio jack, and no front-panel USB, so most desks will need a hub or dock.
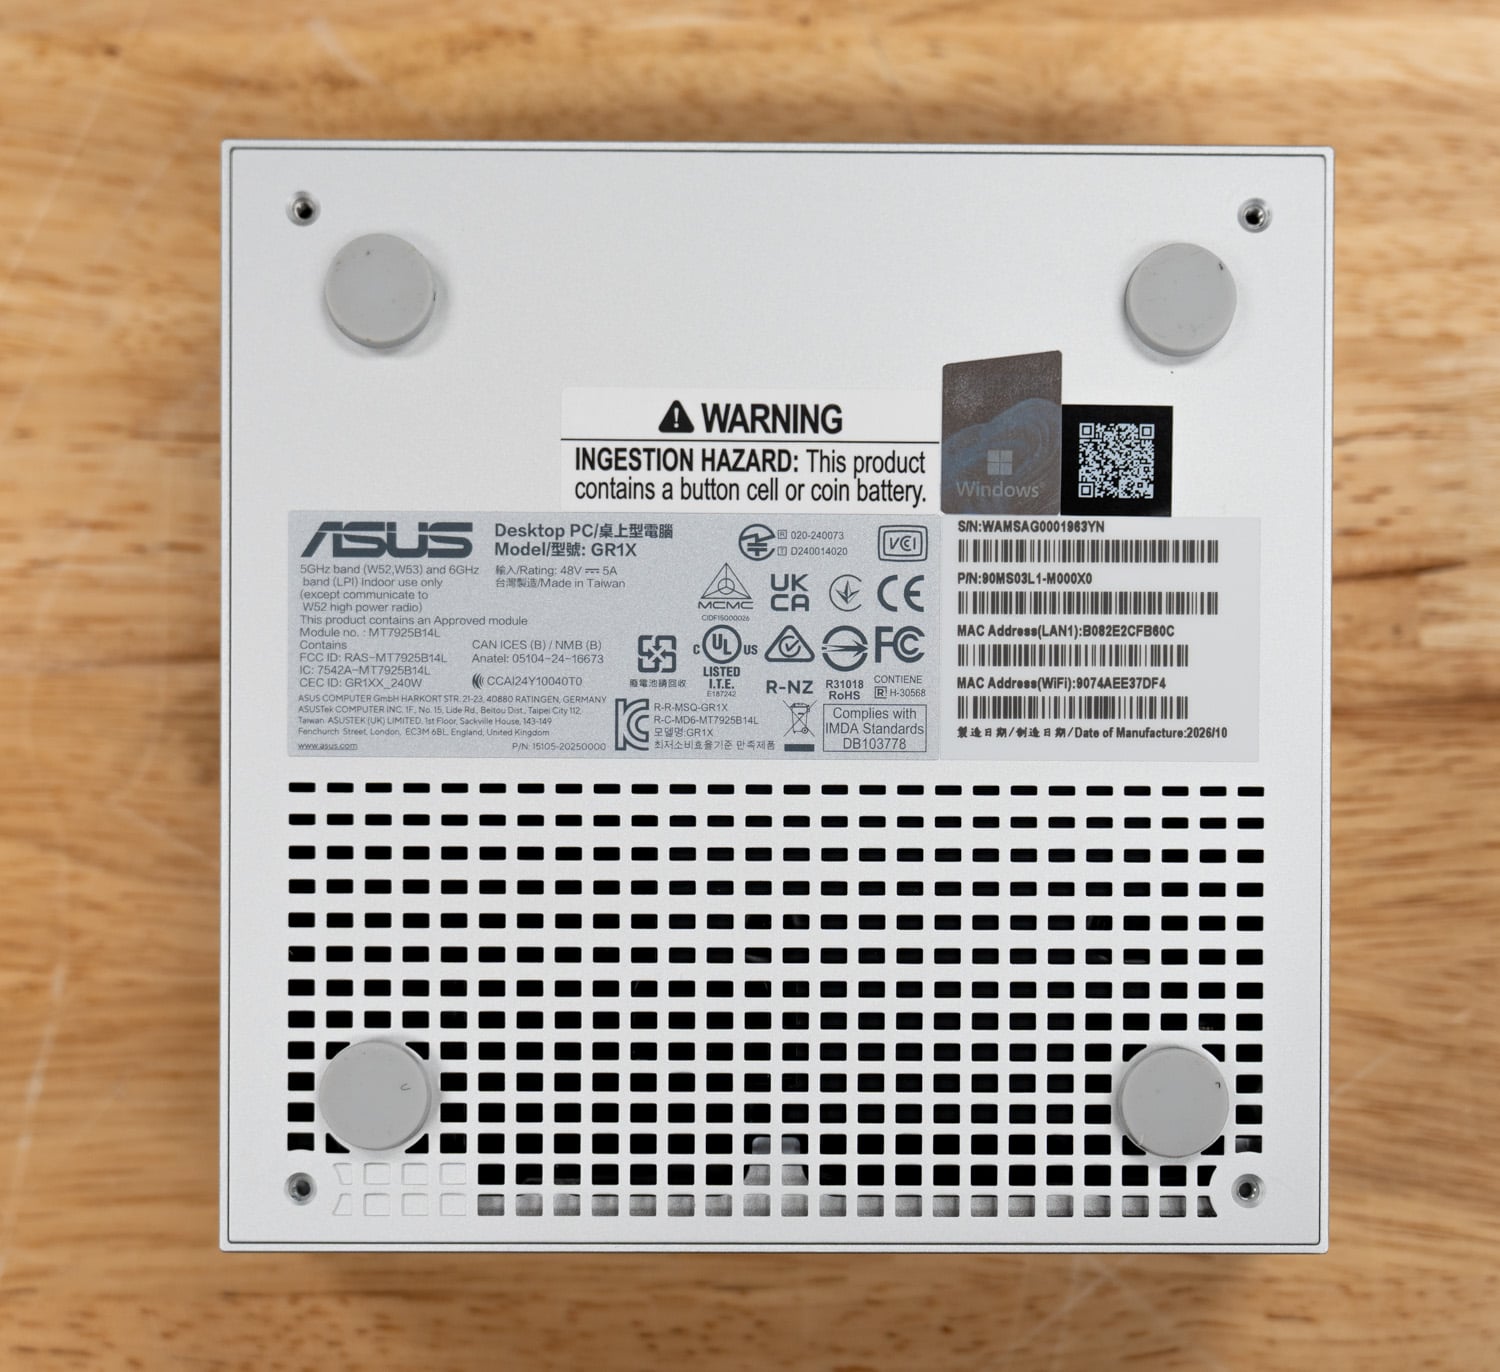
Cooling is a dual-fan design that pulls air through vents in the base and moves it across 57 fins fed by four heat pipes. ASUS specifies 109 blades per fan and says the system is built to sustain 140W, adding that owners will rarely notice thermal throttling even at 25C to 30C ambient. Our sustained-load testing below addresses that statement directly, since the two laptops in the comparison run the same chip against a 98C ceiling for most of our CPU suite.
Storage is the part of the GR1X design we would point to first, because two full-length M.2 slots are rare in a system this size. The chassis offers two M.2 2280 slots, and ASUS lists support for PCIe 5.0 and 4.0 drives with up to 4TB. The 2280 length is the most common retail size for Gen4 and Gen5 SSDs, so a buyer can add a second drive for models and datasets or replace the boot drive with an off-the-shelf part.
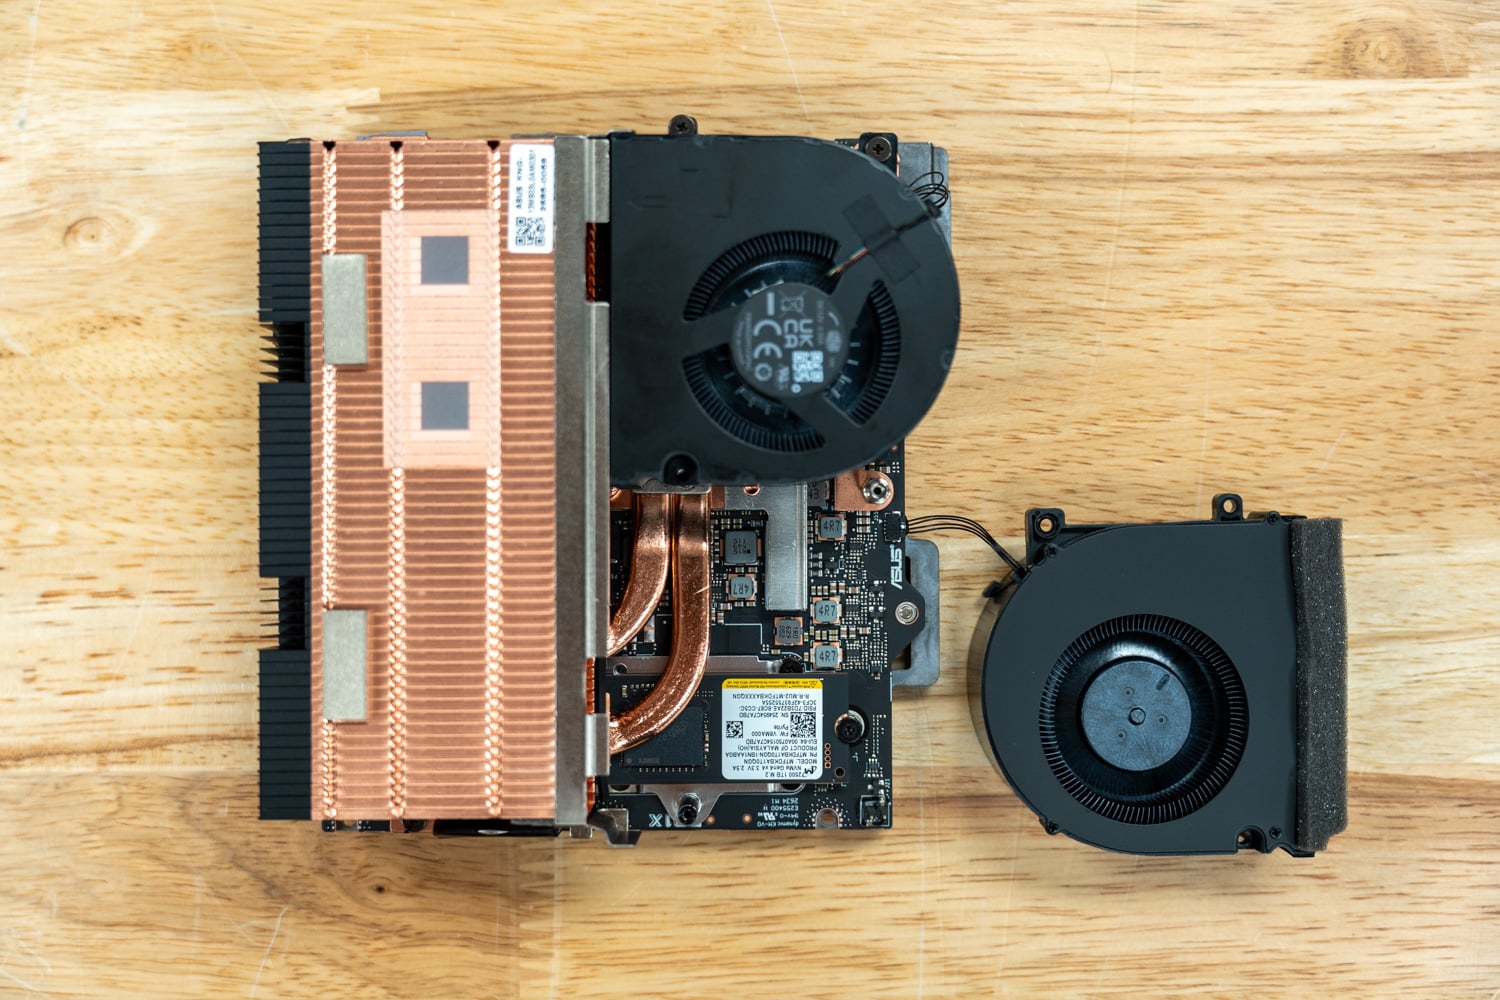
ASUS’s listed factory options are a 4TB Gen5 drive and 1TB or 2TB Gen4 drives, and our unit shipped with a 1TB Micron drive, the module visible beside the heat pipes in the photo above. That primary slot sits on the motherboard under the CPU fan structure. The second M.2 2280 slot is on the underside of the board, empty in our unit, and simple to reach once the chassis bottom plate is off. Limited storage has been the biggest shortcoming of the GB10 systems we have tested, which ship with a single short M.2 drive, so the open slot lets GR1X buyers add capacity.
ASUS ProArt GR1X Specifications
| Especificação | ASUS ProArt GR1X |
|---|---|
| Plataforma | |
| Modelo | ProArt GR1X |
| Subcontratante | NVIDIA RTX Spark N1X 20-core Arm CPU (two classes of 10 cores) |
| Gráficos | 6,144-core NVIDIA Blackwell RTX GPU, integrated Up to 1 petaFLOP FP4 (ASUS) |
| Memória | 64GB or 128GB LPDDR5X-9400 unified memory 64GB as tested |
| GPU Memory as Tested | 30.5GB dedicated, 16.2GB shared (default allocation) |
| Armazenamento | 2x M.2 2280 NVMe slots, PCIe 5.0/4.0, up to 4TB 1TB Micron MTFDKBA1T0QGN on a PCIe Gen4 x4 link as tested |
| Sistema Operacional | Windows 11 Home ou Pro Windows 11 Pro 26H1 as tested |
| Conectividade | |
| Portas traseiras | 3x USB Type-C 20Gbps with DisplayPort Alt Mode 1x USB Type-C 20Gbps with PD input (PD 3.1 EPR) 1x HDMI 2.1 1 x 10GbE RJ45 |
| Frente | Power button with LED |
| Mostrar saídas | Up to four displays over HDMI and 3x USB Type-C |
| Networking | 10GbE Wi-Fi 7 (2×2), Bluetooth 5.4 |
| Total | Ranhura para fecho Kensington |
| Cooling, Power, and Chassis | |
| Resfriamento | Dual fans, 109 blades each 57 fins, 4 heat pipes Built to sustain 140W (ASUS) |
| Energia | 240W USB Type-C adapter |
| Dimensões | 150 x 150 x 51mm (5.91 x 5.91 x 2.01 in), 1.15L |
| Peso | 1.48 kg (3.26 lb) |
| Cor | Preto, prata |
Configuração e metodologia de teste
We tested the GR1X as it arrived, with the RTX Spark N1X, 64GB of LPDDR5X-9400, a 1TB Micron SSD on a PCIe Gen4 x4 link, and Windows 11 Pro 26H1 on Arm. The power mode was set to Best performance, and a 4K external monitor was attached for the run. Windows assigned 30.5GB of the unified memory to the GPU as dedicated memory and another 16.2GB as shared.
That memory is one physical pool, and Windows treats the GPU allocation as dedicated GPU memory and the remainder as system memory, which the GPU can spill into when it needs more. A slider in the NVIDIA app sets the allocation; the default sits close to an even split on 64GB and 128GB RTX Spark systems, and the app warns that minimum and maximum settings may cause issues. NVIDIA advises keeping the default unless a workload needs more, because a larger GPU share leaves less memory for Windows and other applications, and it recommends leaving at least 16GB for the CPU.
NVIDIA says agents and LLMs see little performance loss when they spill into system memory, and it suggests raising the allocation for image and video generation models that need more than the default provides. We test every system at its default, and our suite sizes its model tiers to the dedicated amount, so a model it skips on a 64GB system may still run there with spillover or a larger allocation.
All results come from sr-client 1.13, the Windows client suite we use for local AI, content creation, CPU, graphics, and storage. LLM serving and MLPerf Client run through llama.cpp on CUDA, while model loading, the coding agent, and RAG run through Ollama on CUDA, and image generation uses stable-diffusion.cpp on Vulkan. We report the median of repeated passes and the newest valid result where a test ran more than once. An asterisk marks a result the suite flagged for a failed pass or high run-to-run variance. The two laptops were tested earlier on sr-client 1.11.
The comparison set starts with the other RTX Spark mini PC in our lab, the MSI EdgeMesa N AI+, a 1.18-liter desktop with 128GB of memory and a 4TB Samsung Gen5 SSD that ran the same sr-client 1.13 release. Beside it are the fastest RTX Spark laptops we have tested at each memory size: the 128GB HP OmniBook Ultra 16 with a 2TB Sandisk Gen5 SSD and the 64GB Dell XPS 16 Creator Edition with a 1TB SK hynix drive.
The XPS 16 is the direct match for our GR1X on memory, and the EdgeMesa and the HP show what the larger configuration adds. All four use the same 20-core N1X, which the two desktops run at a higher power limit under larger coolers, leaving power, cooling, memory, and storage as the variables. An x64 build of Cinebench crashed under emulation on all four, so no emulation result appears here.
| Configuração | CPU | Memória | Memória GPU | Drive de inicialização | Sistema Operacional |
|---|---|---|---|---|---|
| ASUS ProArt GR1X | NVIDIA RTX Spark N1X, 20 cores | 64 GB LPDDR5X-9400 | 30.5GB dedicated | 1TB Micron MTFDKBA1T0QGN, PCIe Gen4 | Windows 11 Pro 26H1 |
| MSI EdgeMesa N AI+ | NVIDIA RTX Spark N1X, 20 cores | 128 GB LPDDR5X-9400 | 62.5GB dedicated | 4TB Samsung MZALC4T0HBL1, PCIe Gen5 | Windows 11 Pro 26H1 |
| HP OmniBook Ultra 16 | NVIDIA RTX Spark N1X, 20 cores | 128 GB LPDDR5X-9400 | 62.5GB dedicated | SSD Sandisk SN8050S de 2 TB, PCIe Gen5 | Windows 11 Pro 26H1 |
| Dell XPS 16 Creator Edition | NVIDIA RTX Spark N1X, 20 cores | 64 GB LPDDR5X-9400 | 30.5GB dedicated | 1TB SK hynix PVC10 | Windows 11 Pro 26H1 |
Sustained Performance and Thermals
Cinebench 2026 and the 30-Minute Loop
| Cinebench 2026 (points, higher is better unless noted) | ASUS ProArt GR1X (N1X, 64GB) | MSI EdgeMesa N AI+ (N1X, 128GB) | HP OmniBook Ultra 16 (N1X, 128 GB) | Dell XPS 16 Creator Edition (N1X, 64 GB) |
|---|---|---|---|---|
| Único nucleo | 553 | 548 | 561 | 565 |
| Multi-core | 7,304 | 7,284 | 7,001 | 6,631 |
| Percurso circular de 30 minutos, primeira passagem | 7,256 | 7,219 | 7,014 | 6,539 |
| Loop de 30 minutos, estado estacionário | 7,306 | 7,276 | 6,970 | 6,550 |
| Estado estacionário / primeira passagem | 1.007 | 1.008 | 0.994 | 1.002 |
| Loop CPU temperature, mean (C) | 83.3 | 88.4 | 97.4 | 97.3 |
| Loop CPU temperature, max (C) | 88.7 | 107.3 | 98.2 | 98.3 |
| Steady-state CPU clock, mean (MHz) | 3,385 | 3,372 | 3,239 | 3,083 |
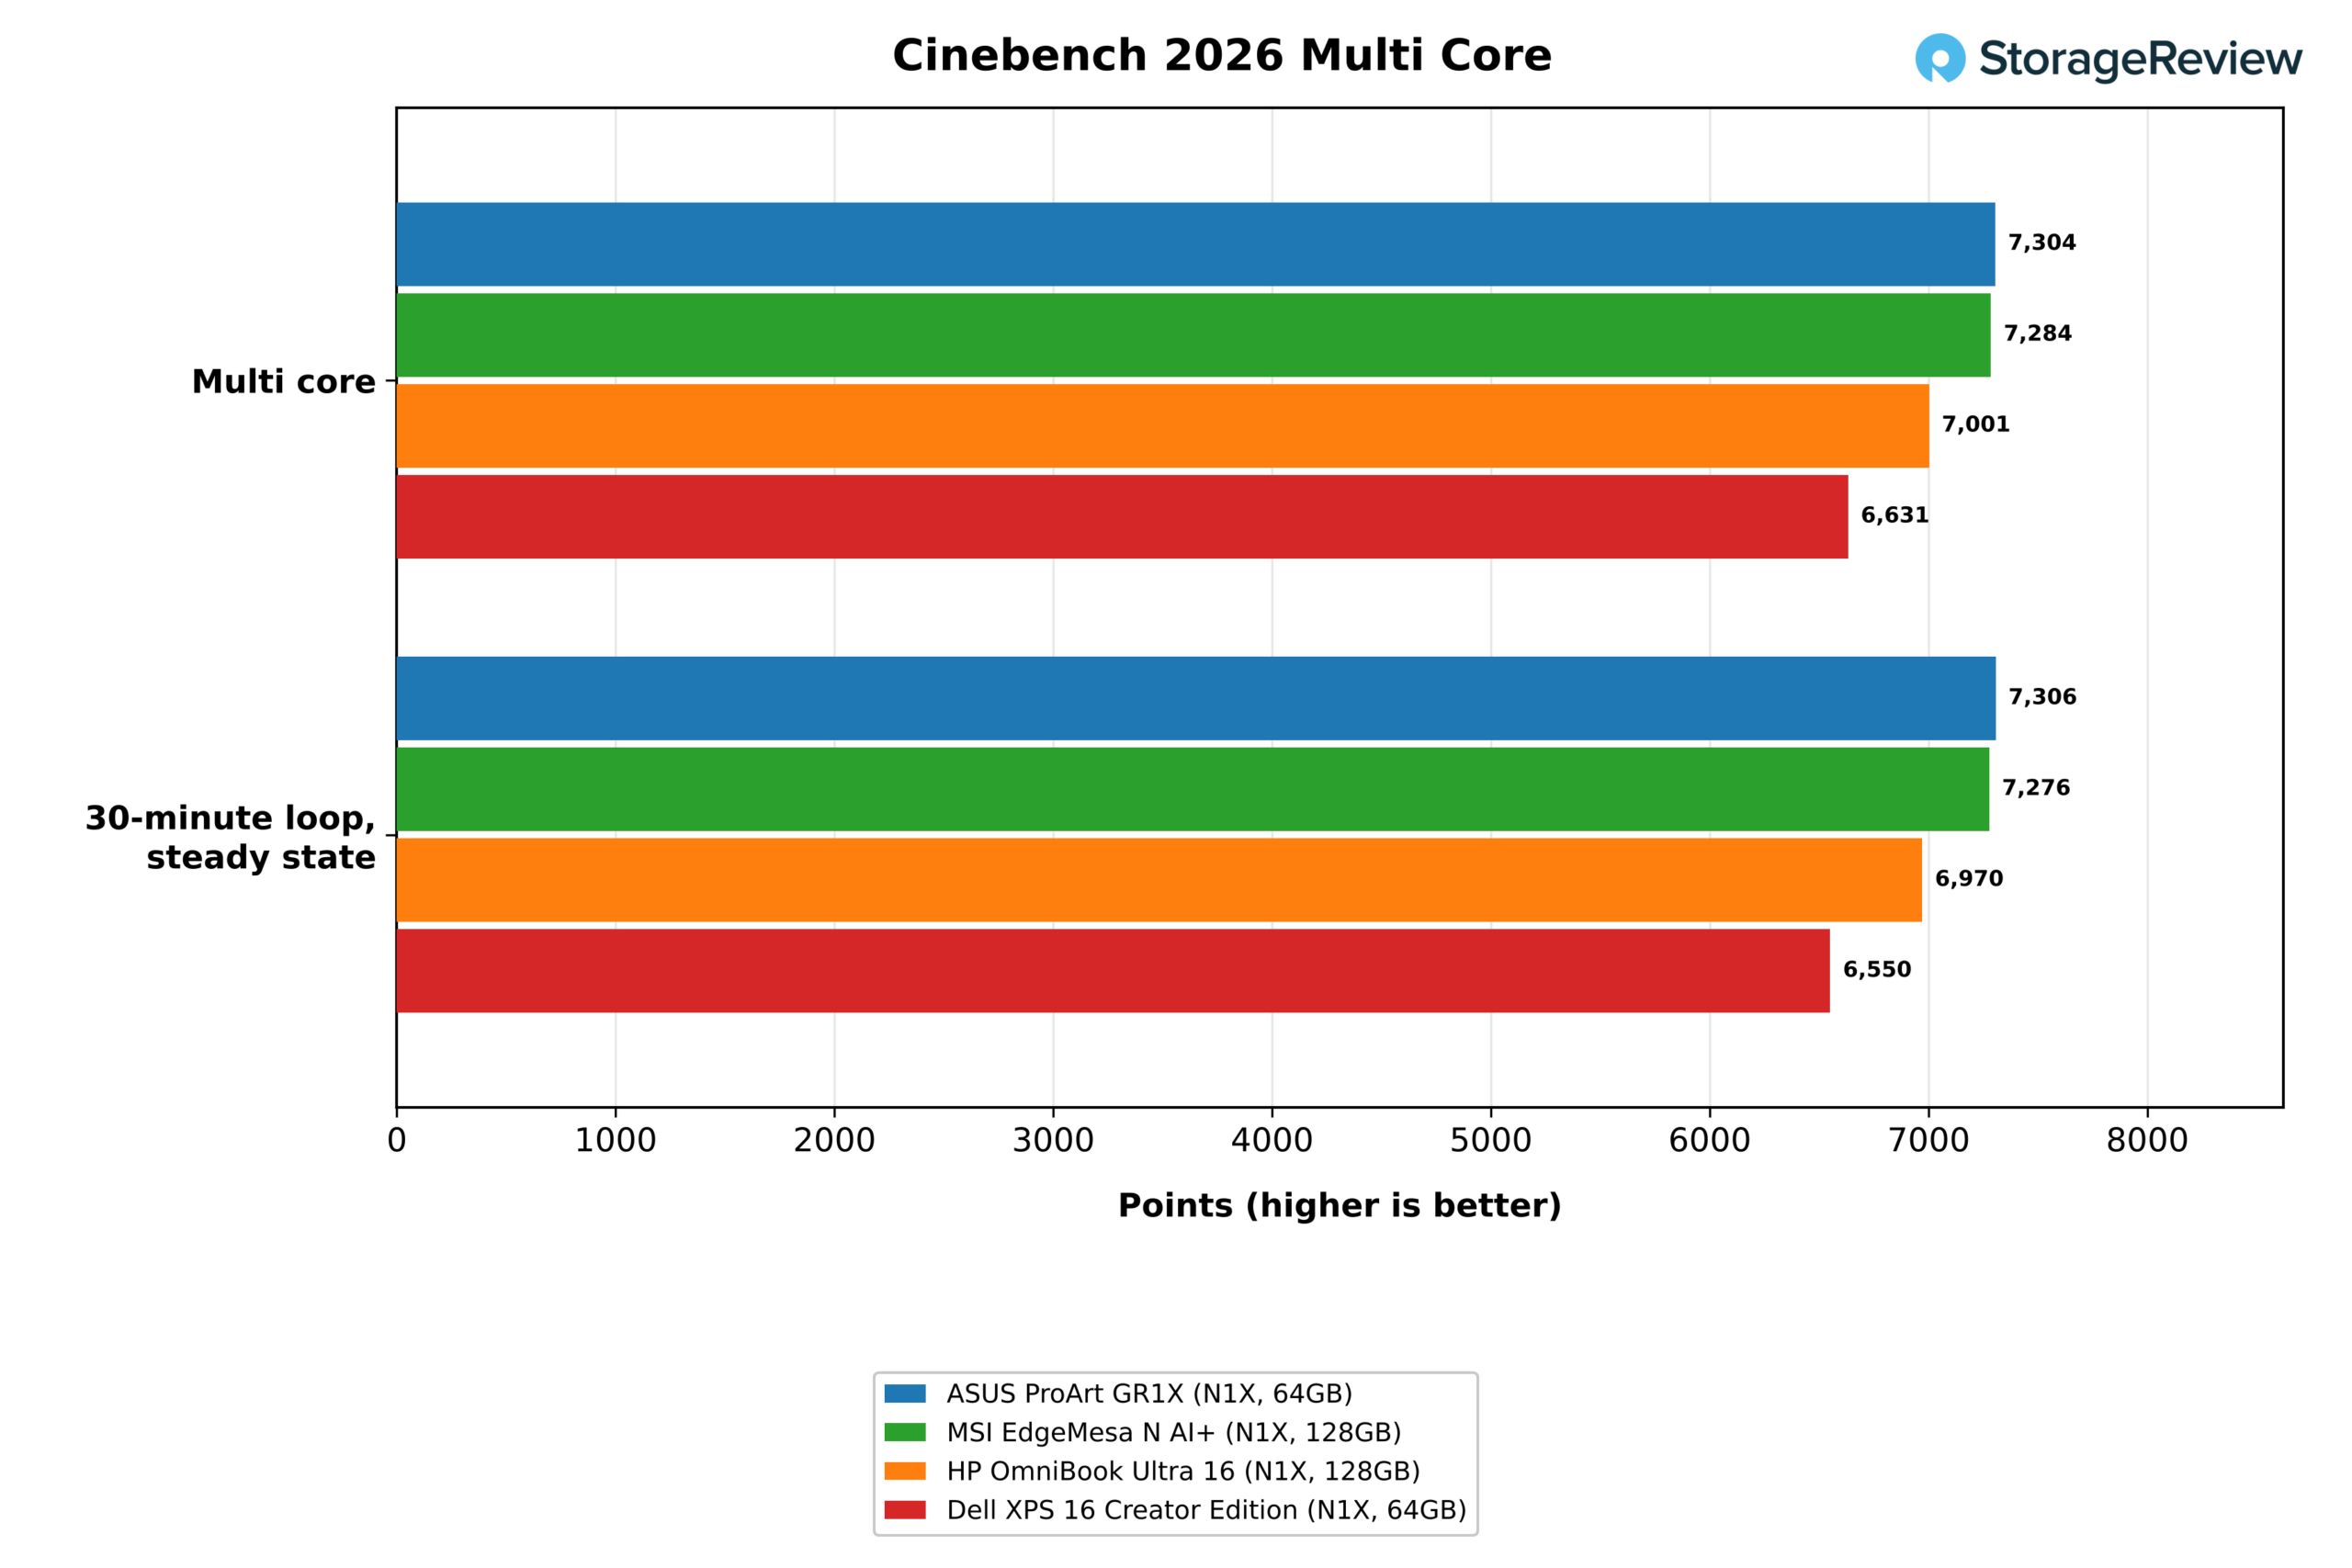
We start with the sustained test because it is the one a mini PC has to win. The loop renders the Cinebench 2026 multi-core scene continuously for 30 minutes, and the GR1X finished it at 7,306 points in the steady state, 1.007 times its first pass, so it did not throttle. The HP held 6,970, and the XPS 16 held 6,550, which puts the ASUS 5 and 12 percent ahead. Mean clock speed in steady state was 3,385MHz on the GR1X, compared with 3,239MHz and 3,083MHz on the laptops. The EdgeMesa held 7,276 points at 3,372MHz, level with the ASUS.
Temperature separates the systems more than the scores do, because both laptops averaged 97C for the full loop and sat at their 98C limit. The GR1X averaged 83.3C and peaked at 88.7C, nearly 10C under that limit while running a higher clock. The EdgeMesa delivered the same score at an 88.4C average, 5C warmer than the ASUS, and its peak reached 107.3C.
A single multi-core run shows the same order against the laptops: 7,304 points against 7,001 and 6,631, leads of 4 and 10 percent, with the EdgeMesa at 7,284. Single-core scores were 553 on the GR1X, 548 on the EdgeMesa, and 561 and 565 on the laptops, a 3 percent spread that slightly favors the laptops and fits a test that never loads the cooler.
Temperatures Across the Suite
| CPU temperature, mean / max (C, lower is better) | ASUS ProArt GR1X (N1X, 64GB) | MSI EdgeMesa N AI+ (N1X, 128GB) | HP OmniBook Ultra 16 (N1X, 128 GB) | Dell XPS 16 Creator Edition (N1X, 64 GB) |
|---|---|---|---|---|
| Cinebench 2026 | 65.3 / 103.8 | 69.0 / 93.4 | 83.3 / 98.2 | 90.5 / 98.3 |
| Cinebench 30-minute loop | 83.3 / 88.7 | 88.4 / 107.3 | 97.4 / 98.2 | 97.3 / 98.3 |
| 7-Zip | 55.4 / 74.4 | 62.2 / 81.2 | 78.2 / 97.7 | 81.2 / 98.0 |
| Blender 4.5 | 70.0 / 81.9 | 76.0 / 87.7 | 96.7 / 98.3 | 94.2 / 98.3 |
| compilação LLVM | 67.2 / 79.2 | 70.5 / 85.9 | 91.6 / 98.1 | 92.9 / 98.2 |
| HandBrake | 66.5 / 87.9 | 74.1 / 90.9 | 87.5 / 97.9 | 90.3 / 98.4 |
| Bacalhau | 80.8 / 88.6 | 84.5 / 105.3 | 97.4 / 98.4 | 97.6 / 98.3 |
| LLM em serviço | 73.4 / 88.4 | 85.0 / 95.0 | 81.0 / 92.9 | 94.0 / 97.8 |
| Geração de imagem | 63.9 / 72.7 | 82.3 / 89.3 | 81.9 / 94.3 | 91.8 / 97.1 |
| RAG | 65.3 / 72.5 | 76.2 / 89.7 | 88.9 / 93.4 | 93.2 / 96.8 |
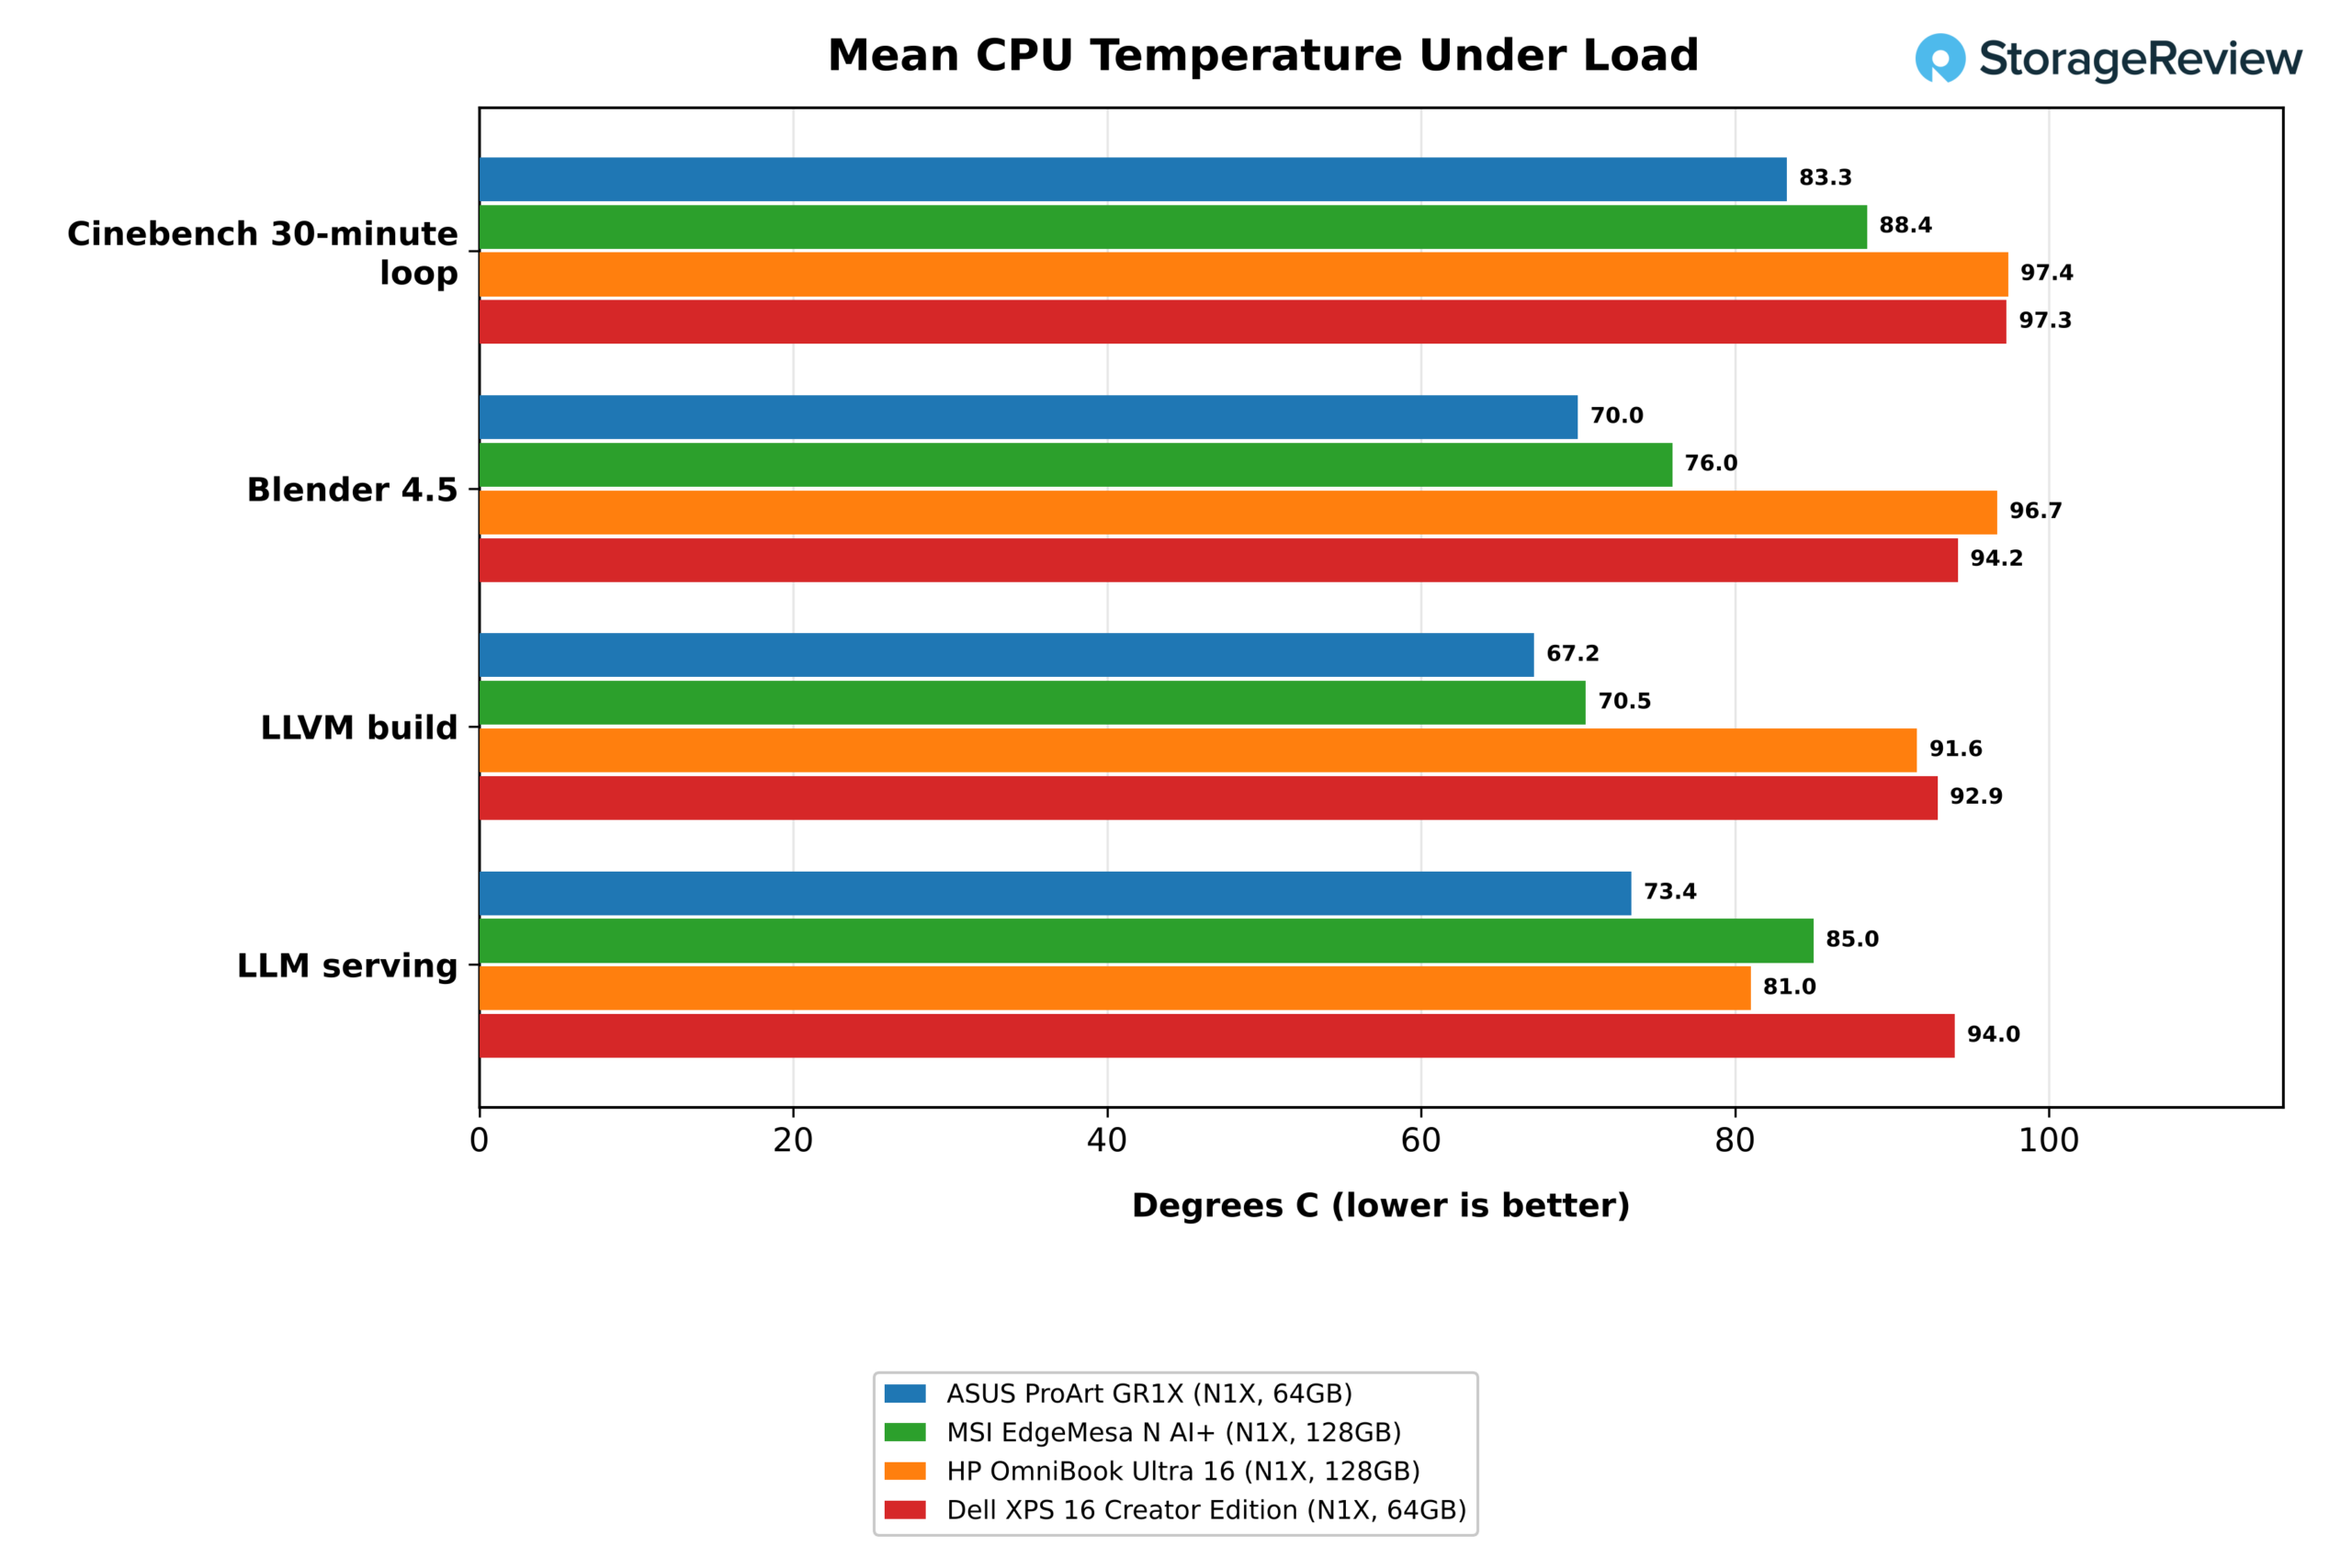
The pattern from the loop holds in every CPU test we logged. The GR1X averaged 70.0C in Blender, 67.2C in the LLVM build, 66.5C in HandBrake, and 55.4C in 7-Zip, where the laptops averaged between 78C and 97C. That is a gap of 21C to 27C against the HP in those four tests, on a system that matched or beat the HP’s throughput in three of them. Stockfish ran at an 80.8C mean on the ASUS and 97C on both laptops.
The EdgeMesa gives the closer comparison, since it is the same class of chassis. The GR1X ran 3C to 8C cooler than the MSI on average across the seven CPU tests in the table, at 70.0C vs. 76.0C in Blender and 66.5C vs. 74.1C in HandBrake. The gap widened to 11C to 18C in LLM serving, RAG, and image generation, where the GR1X averaged 73.4C, 65.3C, and 63.9C. The two desktops produced the same throughput in those tests.
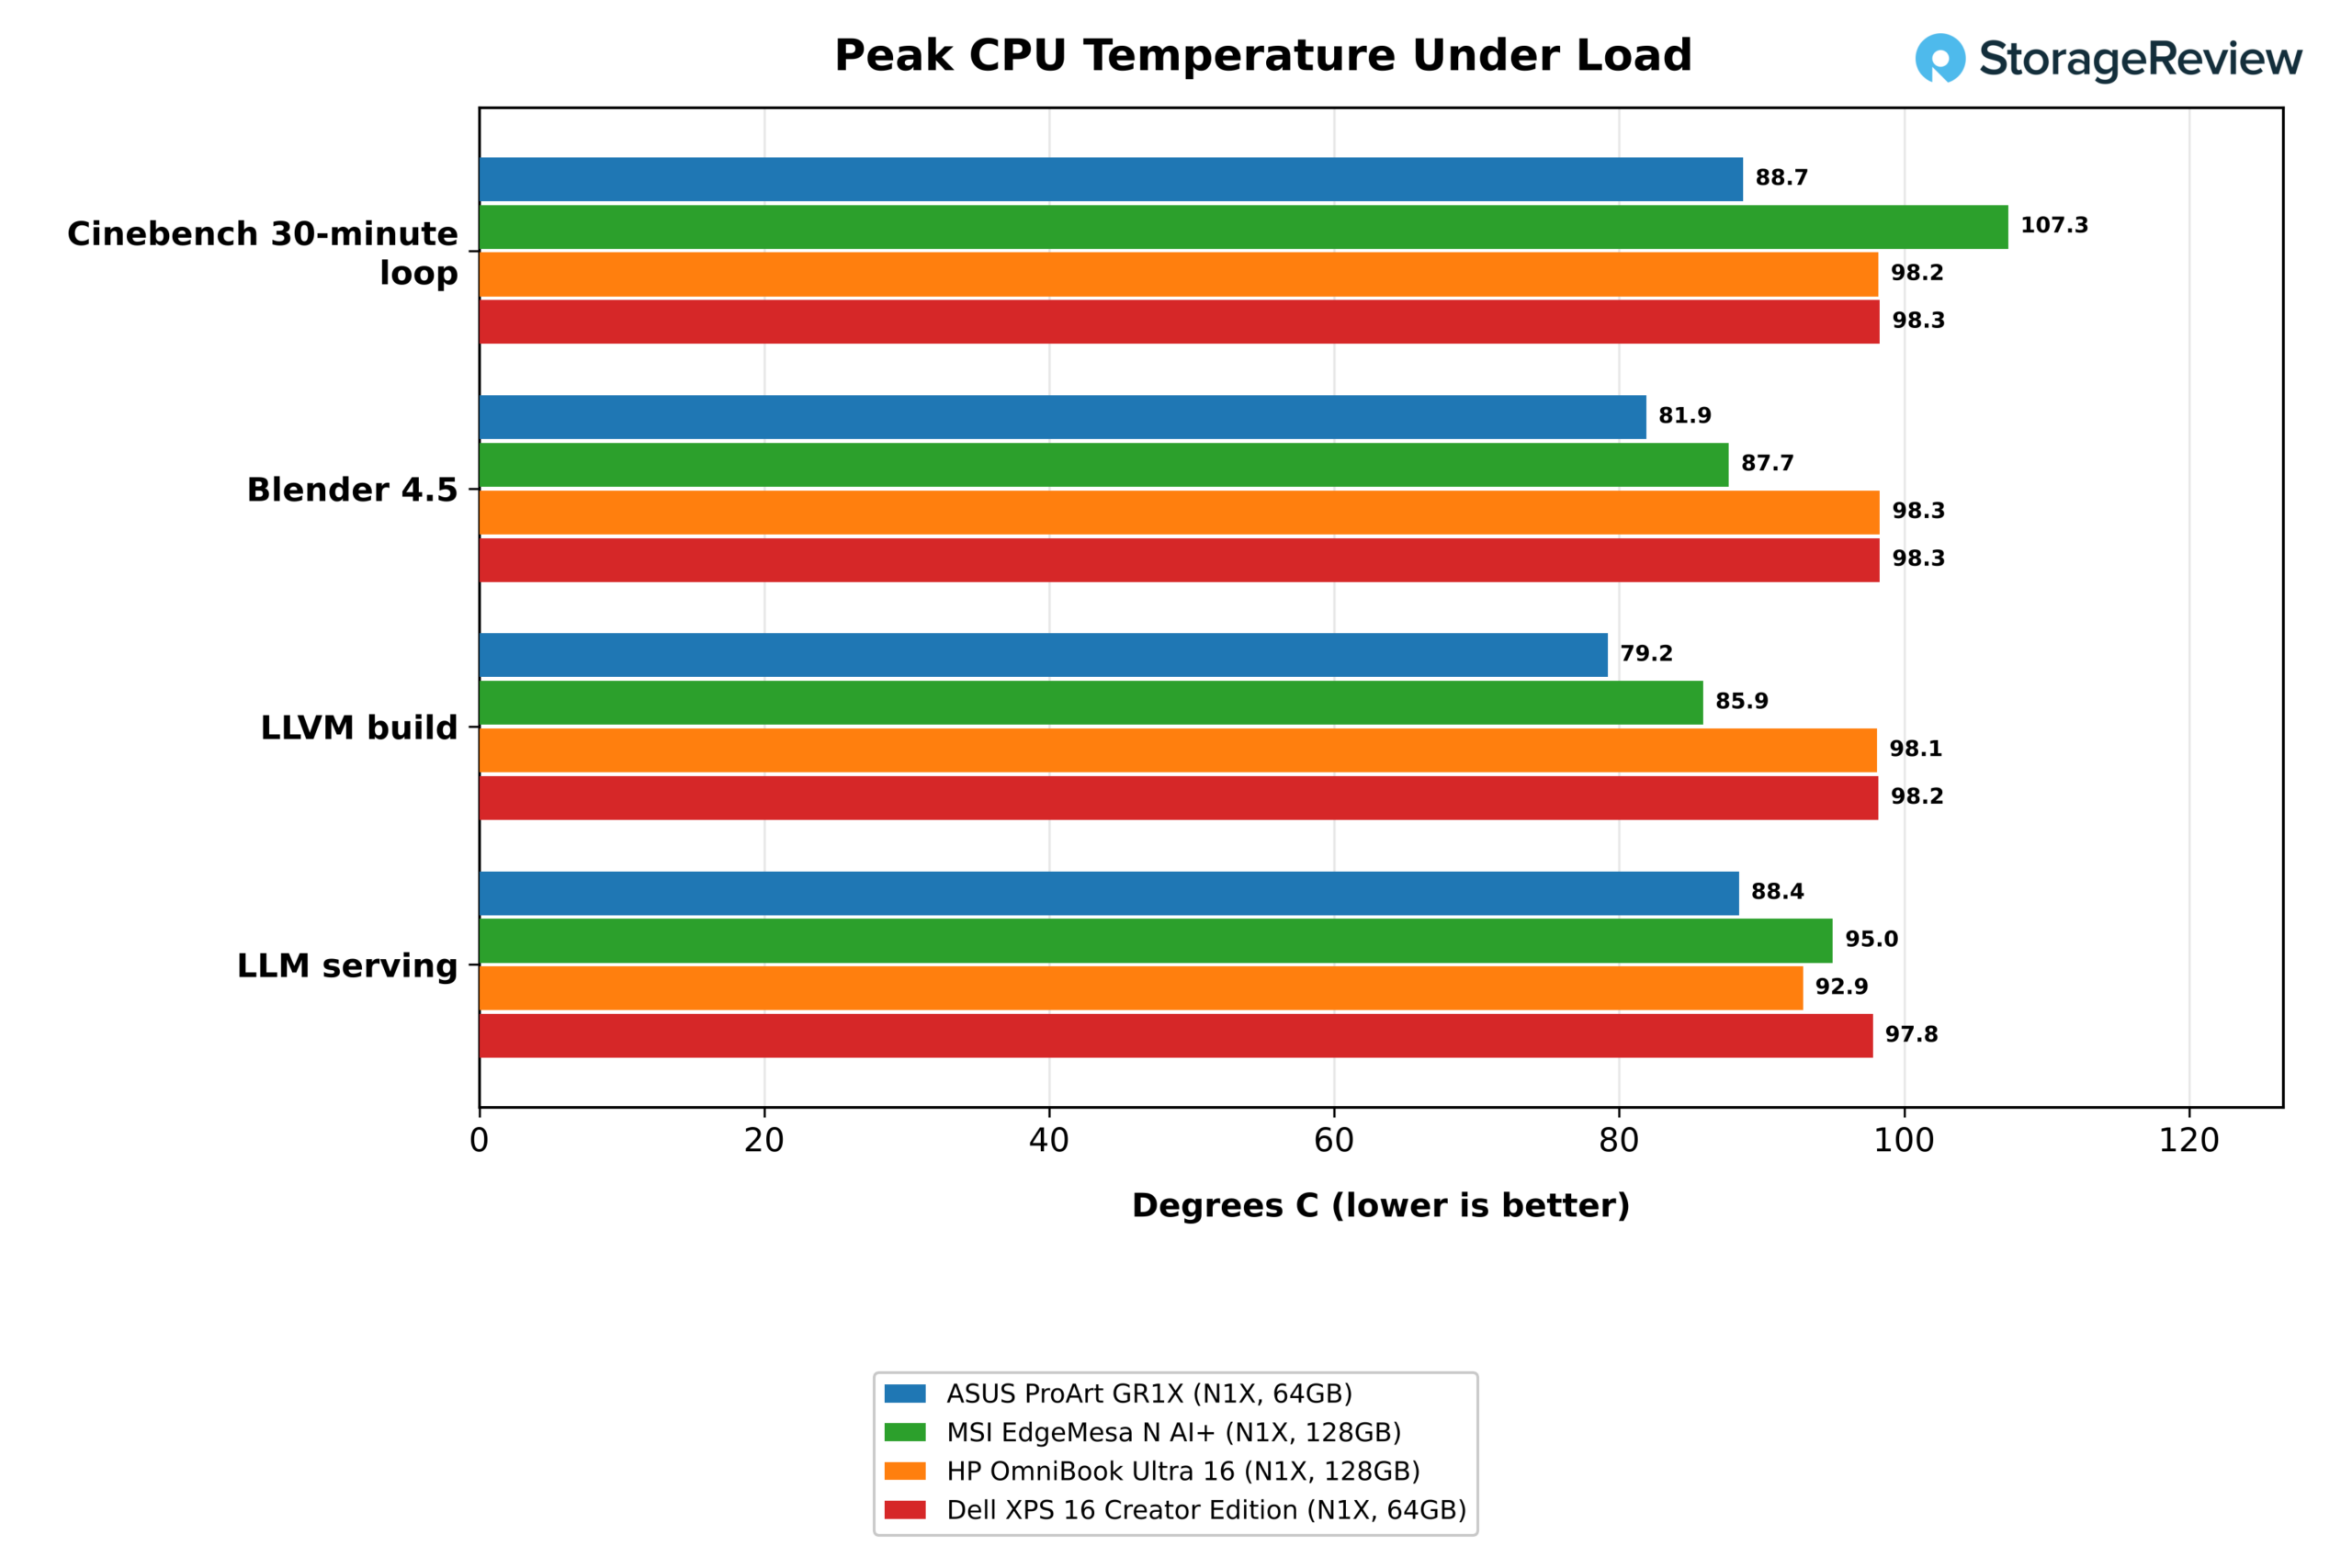
Peak readings stayed below 90C in nine of the ten tests in the table, including 88.7C in the loop, 88.6C in Stockfish, and 88.4C in LLM serving. The exception was the standalone Cinebench run, which logged a 103.8C maximum against a 65.3C mean, a short excursion that did not repeat in the 30-minute loop. The EdgeMesa logged peaks above 100C in three tests. GPU-heavy work ran cooler still, with image generation averaging 63.9C and RAG averaging 65.3C. The SSD reached 53C during the storage test.
7-Zip, Blender, HandBrake e LLVM
| Content creation and build (higher is better unless noted) | ASUS ProArt GR1X (N1X, 64GB) | MSI EdgeMesa N AI+ (N1X, 128GB) | HP OmniBook Ultra 16 (N1X, 128 GB) | Dell XPS 16 Creator Edition (N1X, 64 GB) |
|---|---|---|---|---|
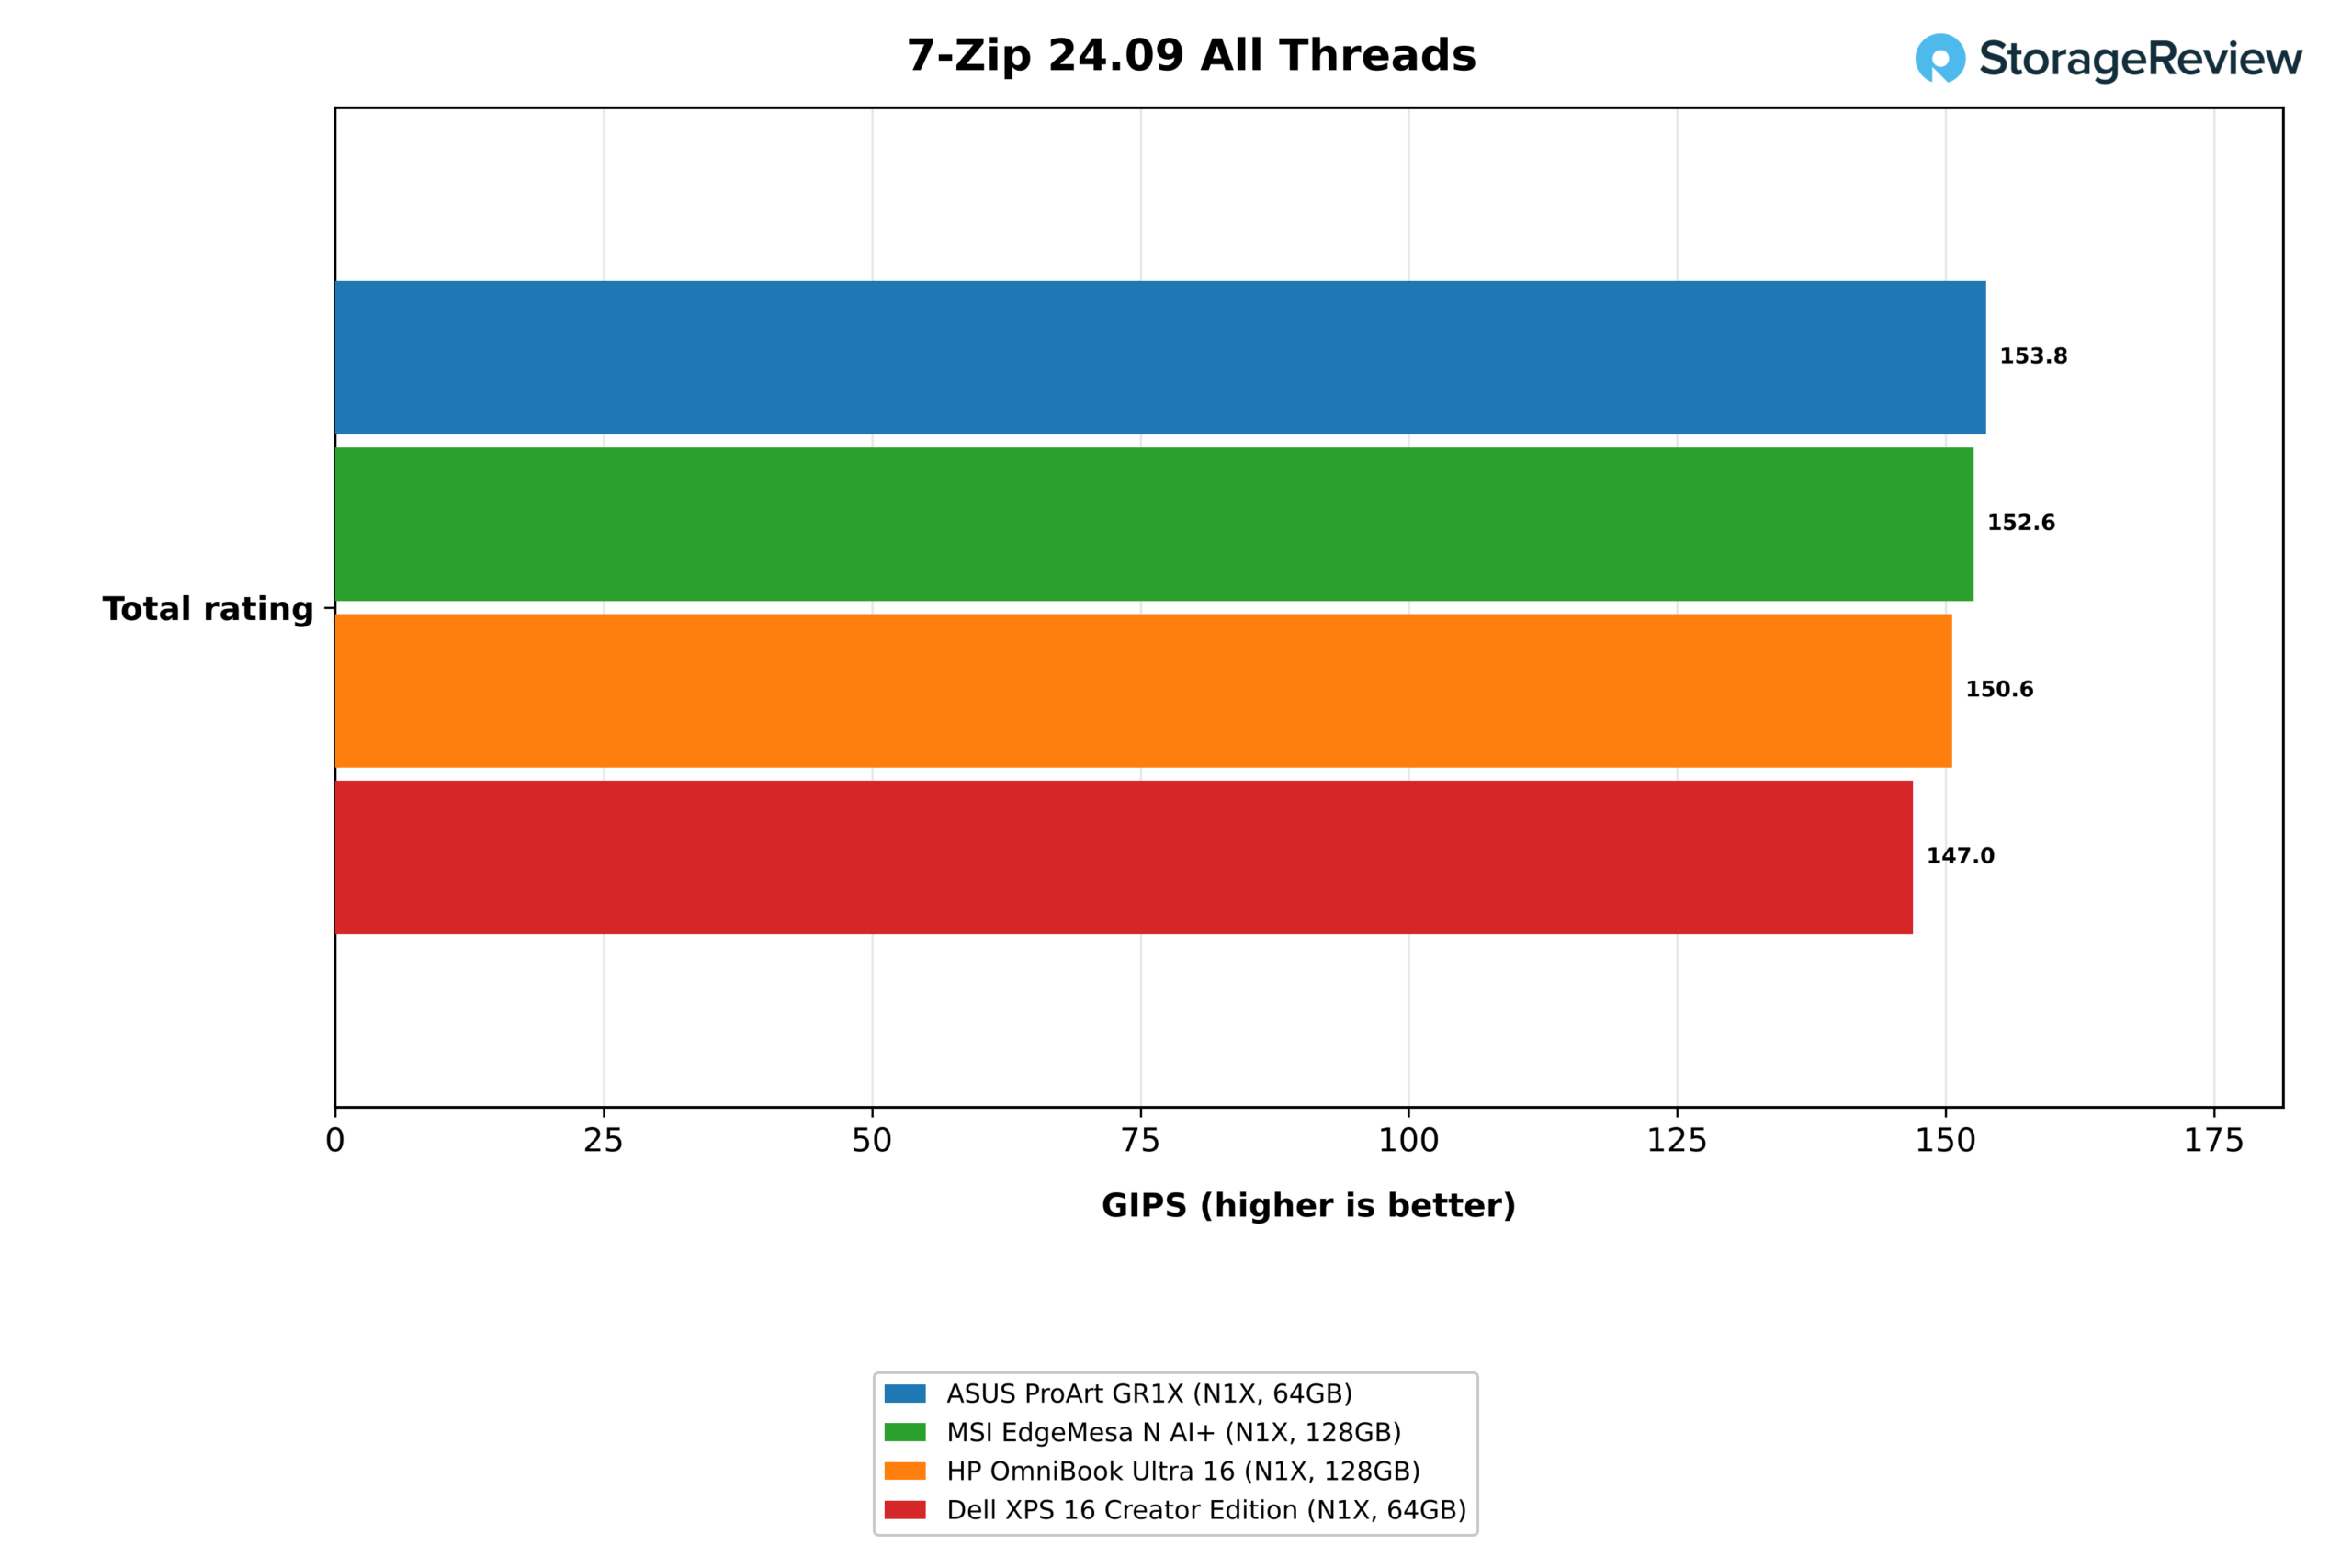
| 7-Zip, todos os threads, total (GIPS) | 153.8 | 152.6 | 150.6 | 147.0 |
| 7-Zip, um fio, total (GIPS) | 8.92 | 8.92 | 9.10 | 9.13 |
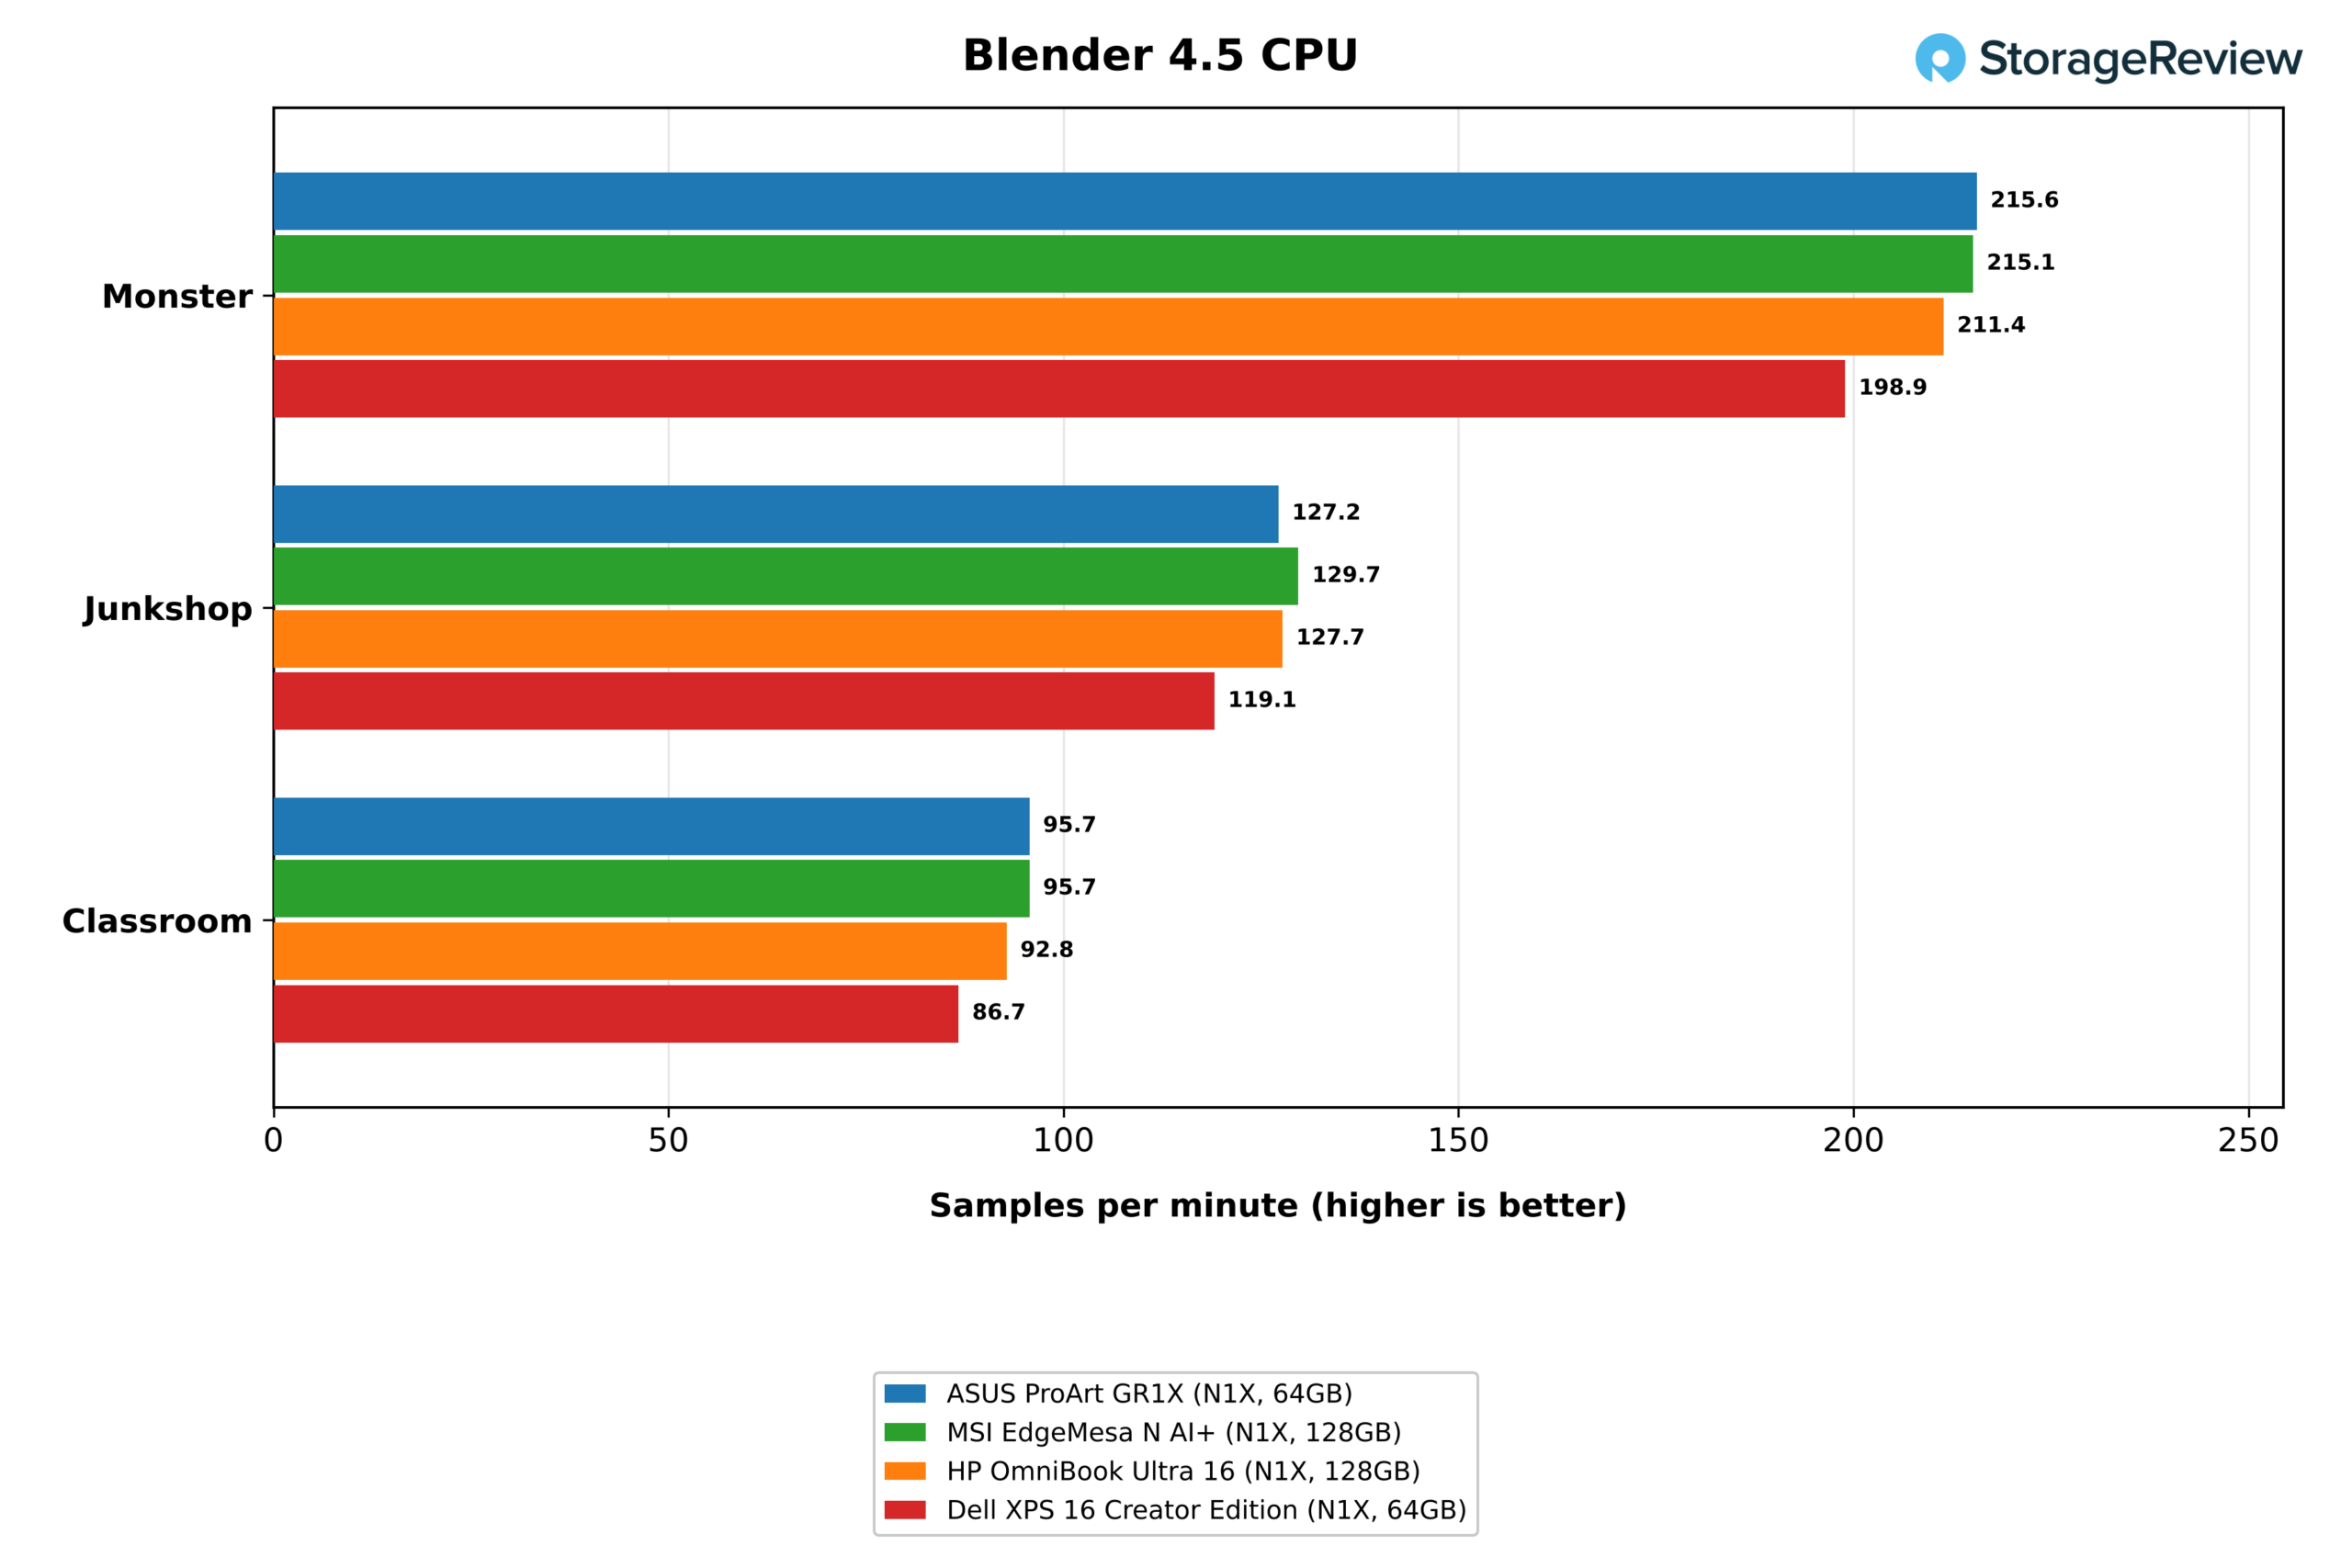
| Blender 4.5 Monster (amostras/min) | 215.6 | 215.1 | 211.4 | 198.9 |
| Blender 4.5 Junkshop (amostras/min) | 127.2 | 129.7 | 127.7 | 119.1 |
| Blender 4.5 Sala de Aula (amostras/min) | 95.7 | 95.7 | 92.8 | 86.7 |
| HandBrake x265 (fps) | 44.1 | 43.7 | 40.6 | 38.8 |
| Freio de mão SVT-AV1 (fps) | 16.4 | 16.3 | 15.4 | 14.0 |
| Versão do LLVM (s, quanto menor, melhor) | 225 | 217 | 218 | 232 |
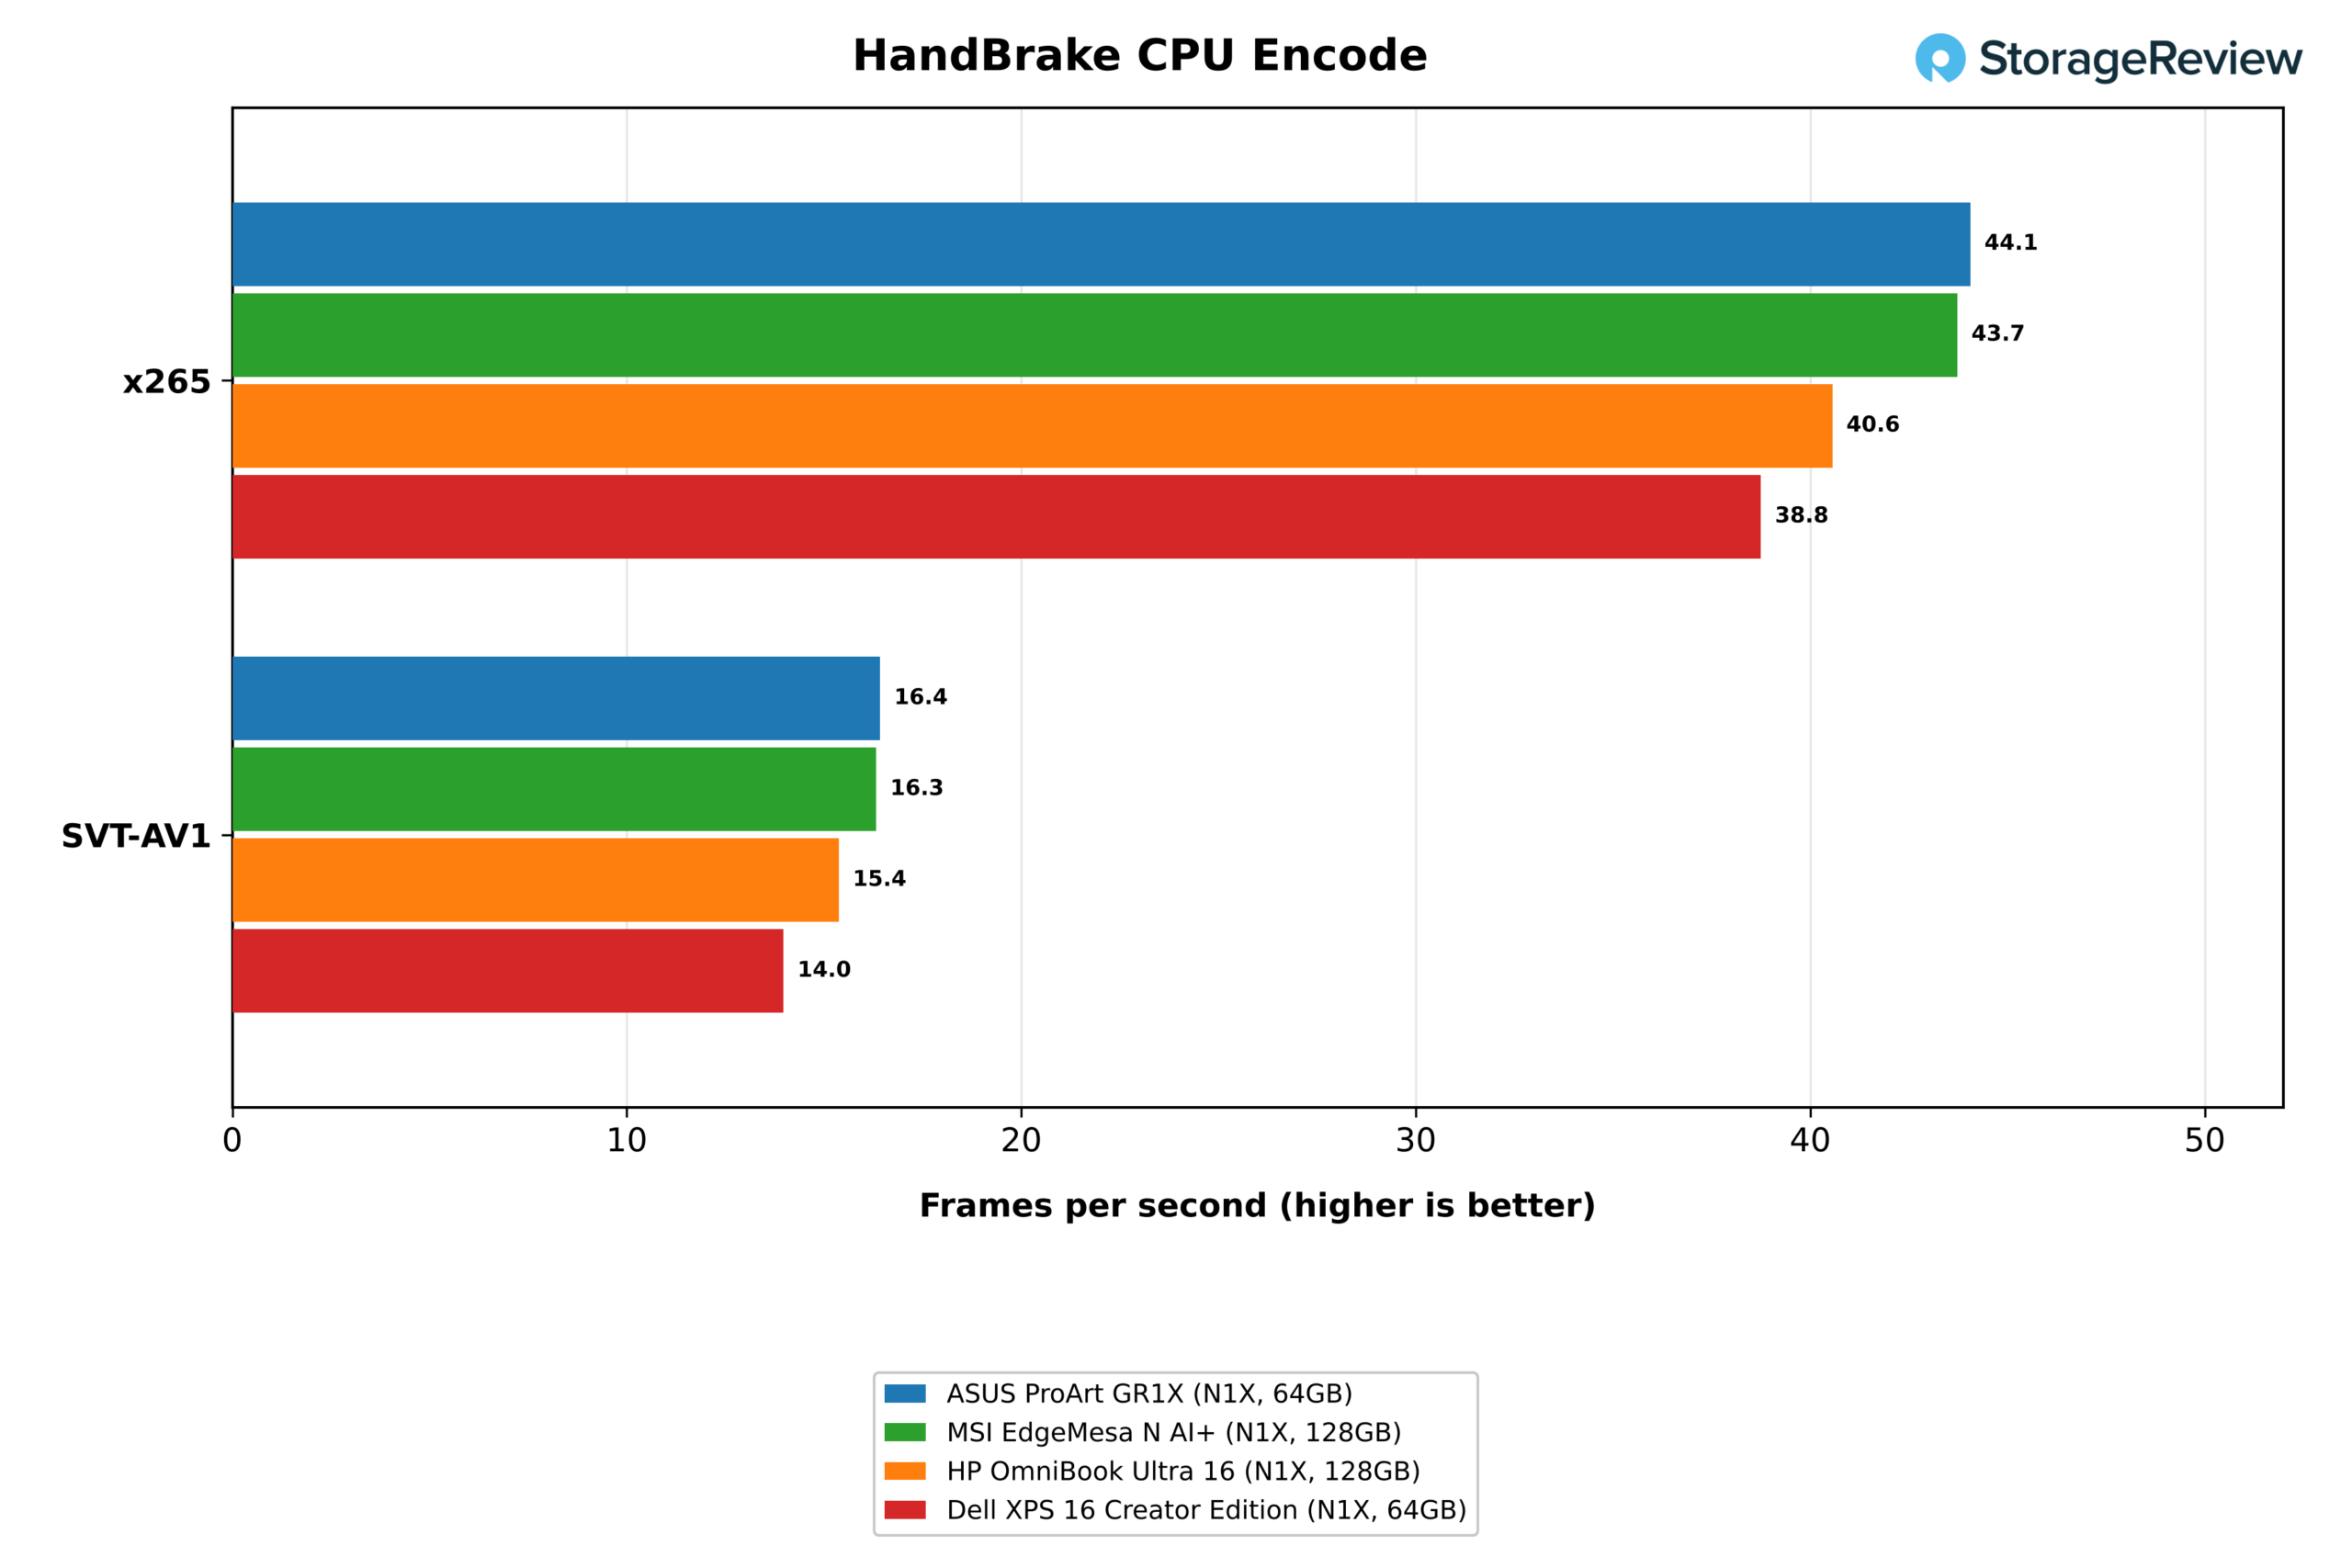
Video encoding produced the largest application lead for the GR1X. HandBrake’s x265 encode ran at 44.1 fps against 40.6 on the HP and 38.8 on the XPS 16, a 9 and 14 percent lead, and SVT-AV1 ran at 16.4 fps against 15.4 and 14.0. The EdgeMesa was level at 43.7 and 16.3 fps. Blender’s Classroom scene rendered at 95.7 samples per minute, 3 and 10 percent ahead, and the Monster scene at 215.6 was 2 and 8 percent ahead. The Junkshop scene was a tie with the HP at 127.2 against 127.7, with the EdgeMesa at 129.7.
7-Zip with all threads measured 153.8 GIPS on the GR1X, 152.6 on the EdgeMesa, and 150.6 and 147.0 on the laptops, a smaller spread that fits a test bound as much by memory as by clock speed. The LLVM build joined Blender’s Junkshop scene as an all-core test the ASUS did not lead, finishing in 225 seconds, behind the EdgeMesa at 217 and the HP at 218 and ahead of the XPS 16 at 232. A full compile mixes single-thread phases and file I/O with its parallel work, and the one-thread 7-Zip result of 8.92 GIPS on both desktops sat just under the laptops at 9.10 and 9.13.
Stockfish, PrimeSieve, Python e o navegador
| Compute and web (higher is better unless noted) | ASUS ProArt GR1X (N1X, 64GB) | MSI EdgeMesa N AI+ (N1X, 128GB) | HP OmniBook Ultra 16 (N1X, 128 GB) | Dell XPS 16 Creator Edition (N1X, 64 GB) |
|---|---|---|---|---|
| Bacalhau seco, um fio (Mnps) | 1.70 | 1.70 | 1.73 | 1.74 |
| Bacalhau seco, todos os fios (Mnps) | 15.13 | 14.42 | 15.19 | 13.87 |
| peneira prima até 10^12, todos os fios (s, quanto menor, melhor) | 9.39 | 9.40 | 9.53 | 10.39 |
| peneira prima até 10^11, um fio (s, quanto menor, melhor) | 12.35 | 12.33 | 12.02 | 12.03 |
| PyPerformance go (ms, quanto menor, melhor) | 113.8 | 113.8 | 111.2 | 111.6 |
| PyPerformance nbody (ms, quanto menor, melhor) | 82.5 | 82.5 | 80.4 | 80.8 |
| Velocímetro 3.1 (pontuação) | 34.3 | 34.7 | 34.8 | 36.5 |
Shorter and lightly threaded tests land close together across the group. Stockfish with all threads ran at 15.13 Mnps on the GR1X, level with the HP at 15.19 and 9 percent ahead of the XPS 16 at 13.87, and primesieve to 10^12 finished in 9.39 seconds against 9.53 and 10.39. The EdgeMesa ran Stockfish at 14.42 Mnps and primesieve in 9.40 seconds. The single-thread Python tests and Speedometer 3.1 were within 3 percent of the HP on both desktops, with the XPS 16 ahead in the browser at 36.5 against 34.3. Desktop responsiveness in ordinary use is equal across the four.
GROMACS, OpenBLAS e Memória
| HPC kernels and memory (higher is better unless noted) | ASUS ProArt GR1X (N1X, 64GB) | MSI EdgeMesa N AI+ (N1X, 128GB) | HP OmniBook Ultra 16 (N1X, 128 GB) | Dell XPS 16 Creator Edition (N1X, 64 GB) |
|---|---|---|---|---|
| GROMACS benchMEM (ns/dia) | 17.48 | 17.43 | 17.48 | 17.41 |
| OpenBLAS DGEMM, todos os núcleos (GFLOPS) | 356.8 | 361.0 | 374.0 | 354.6 |
| OpenBLAS LU resolve N=20000, todos os núcleos (GFLOPS) | 320.6 | 318.5 | 321.9 | 314.9 |
| STREAM Triad (MB/s) | 124,529 | 122,423 | 120,783 | 122,872 |
| Latência de memória, páginas de 4 KiB (ns, quanto menor, melhor) | 141.0 | 143.0 | 143.6 | 140.5 |
Memory-bound work is a wash, as expected with identical LPDDR5X-9400 on all four machines. STREAM Triad measured 124,529MB/s on the GR1X, 122,423 on the EdgeMesa, and 120,783 and 122,872 on the laptops, and latency on 4KiB pages ranged from 140.5ns to 143.6ns. GROMACS benchMEM produced 17.41 to 17.48 ns/day across the group. OpenBLAS DGEMM at 356.8 GFLOPS trailed the HP at 374.0 by 5 percent and matched the XPS 16, and the LU solve was within about 2 percent across the group.
Desempenho de IA local
LLM Servindo
| LLM serving, llama.cpp CUDA, Q4_K_M (higher is better unless noted) | ASUS ProArt GR1X (N1X, 64GB) | MSI EdgeMesa N AI+ (N1X, 128GB) | HP OmniBook Ultra 16 (N1X, 128 GB) | Dell XPS 16 Creator Edition (N1X, 64 GB) |
|---|---|---|---|---|
| Ministral 3 3B, 1 requisição, saída (tokens/s) | 58.4 | 58.1 | 57.5 | 57.8 |
| Ministral 3 3B, 4 requisições, saída (tokens/s) | 154.9 | 152.0 | 148.8 | 146.4 |
| Ministral 3 3B, 1 requisição, tempo para o primeiro token (ms, quanto menor, melhor) | 557 | 566 | 607 | 669 |
| Ministral 3 8B, 1 requisição, saída (tokens/s) | 42.7 | 42.5 | 41.5 | 40.6 |
| Ministral 3 8B, 4 requisições, saída (tokens/s) | 109.3 | 107.5 | 104.1 | 96.3 |
| Ministral 3 8B, 1 requisição, tempo para o primeiro token (ms, quanto menor, melhor) | 1,331 | 1,343 | 1,554 | 1,794 |
| Qwen3.8 27B, 1 request, output (tokens/s) | 13.1 | 13.0 | 12.6 | 12.4 |
| Qwen3.8 27B, 4 requests, output (tokens/s) | 31.4 | 31.1 | 28.1 | 27.5 |
| Qwen3.8 27B, 8 requests, output (tokens/s) | 40.0 | 39.8 | 33.8 | 31.9 |
| Qwen3.8 27B, 1 requisição, tempo para o primeiro token (ms, quanto menor, melhor) | 8,604 | 8,721 | 10,818 | 10,935 |
The serving test sends one, four, and eight simultaneous requests to each model through llama.cpp, the load a few people sharing one system would create. A single request produced 58.4 tokens per second on Ministral 3 3B, 42.7 on the 8B model, and 13.1 on Qwen3.8 27B, all within 6 percent of both laptops and within 1 percent of the EdgeMesa. The first token from the 27B model arrived in 8.6 seconds on the GR1X and 8.7 on the EdgeMesa, and took 10.8 and 10.9 seconds on the HP and the XPS 16.

The systems separate once requests stack up on the larger model. At four requests on Qwen3.8 27B, the GR1X produced 31.4 tokens per second against 28.1 and 27.5, and at eight requests it produced 40.0 against 33.8 and 31.9, which is 18 percent ahead of the HP and 25 percent ahead of the XPS 16. Ministral 3 8B at four requests ran at 109.3 tokens per second, compared with 104.1 and 96.3. The desktop adds a higher power limit and a cooler that keeps the chip well under its ceiling, and the gap grows with the load.
The EdgeMesa followed the GR1X within 2 percent across the serving table, at 31.1 tokens per second with four requests on Qwen3.8 27B, 39.8 with eight, and 107.5 on Ministral 3 8B with four. Its 128GB of memory made no difference here, because every model in the table fits on our 64GB unit. The two desktops serve models of this size at the same rate.

Our 64GB unit loaded the 27B model with room for eight requests, and the suite did not run the 35B coding-agent model or Qwen-Image at Q8 on it. ASUS ties 120B-class models to the 128GB configuration, and we did not test that size on any RTX Spark system. Our Windows client suite does not include it, and we test gpt-oss 120B and models of that size in our Linux suite on larger unified-memory desktops and GPU workstations. Buyers who plan to go well past the 27B class should order the 128GB GR1X.
Cliente MLPerf v2.0
| MLPerf Client v2.0, llama.cpp CUDA (higher is better unless noted) | ASUS ProArt GR1X (N1X, 64GB) | MSI EdgeMesa N AI+ (N1X, 128GB) | HP OmniBook Ultra 16 (N1X, 128 GB) | Dell XPS 16 Creator Edition (N1X, 64 GB) |
|---|---|---|---|---|
| Llama 3.1 8B, tempo até o primeiro token (s, quanto menor, melhor) | 0.24 | 0.25 | 0.28 | 0.31 |
| Llama 3.1 8B, taxa de tokens (tokens/s) | 56.8 | 56.3 | 56.5 | 55.7 |
| Phi-4-mini, tempo até o primeiro token (s, quanto menor, melhor) | 0.11 | 0.11 | 0.13 | 0.14 |
| Phi-4-mini, taxa de tokens (tokens/s) | 96.3 | 96.8 | 97.0 | 96.2 |
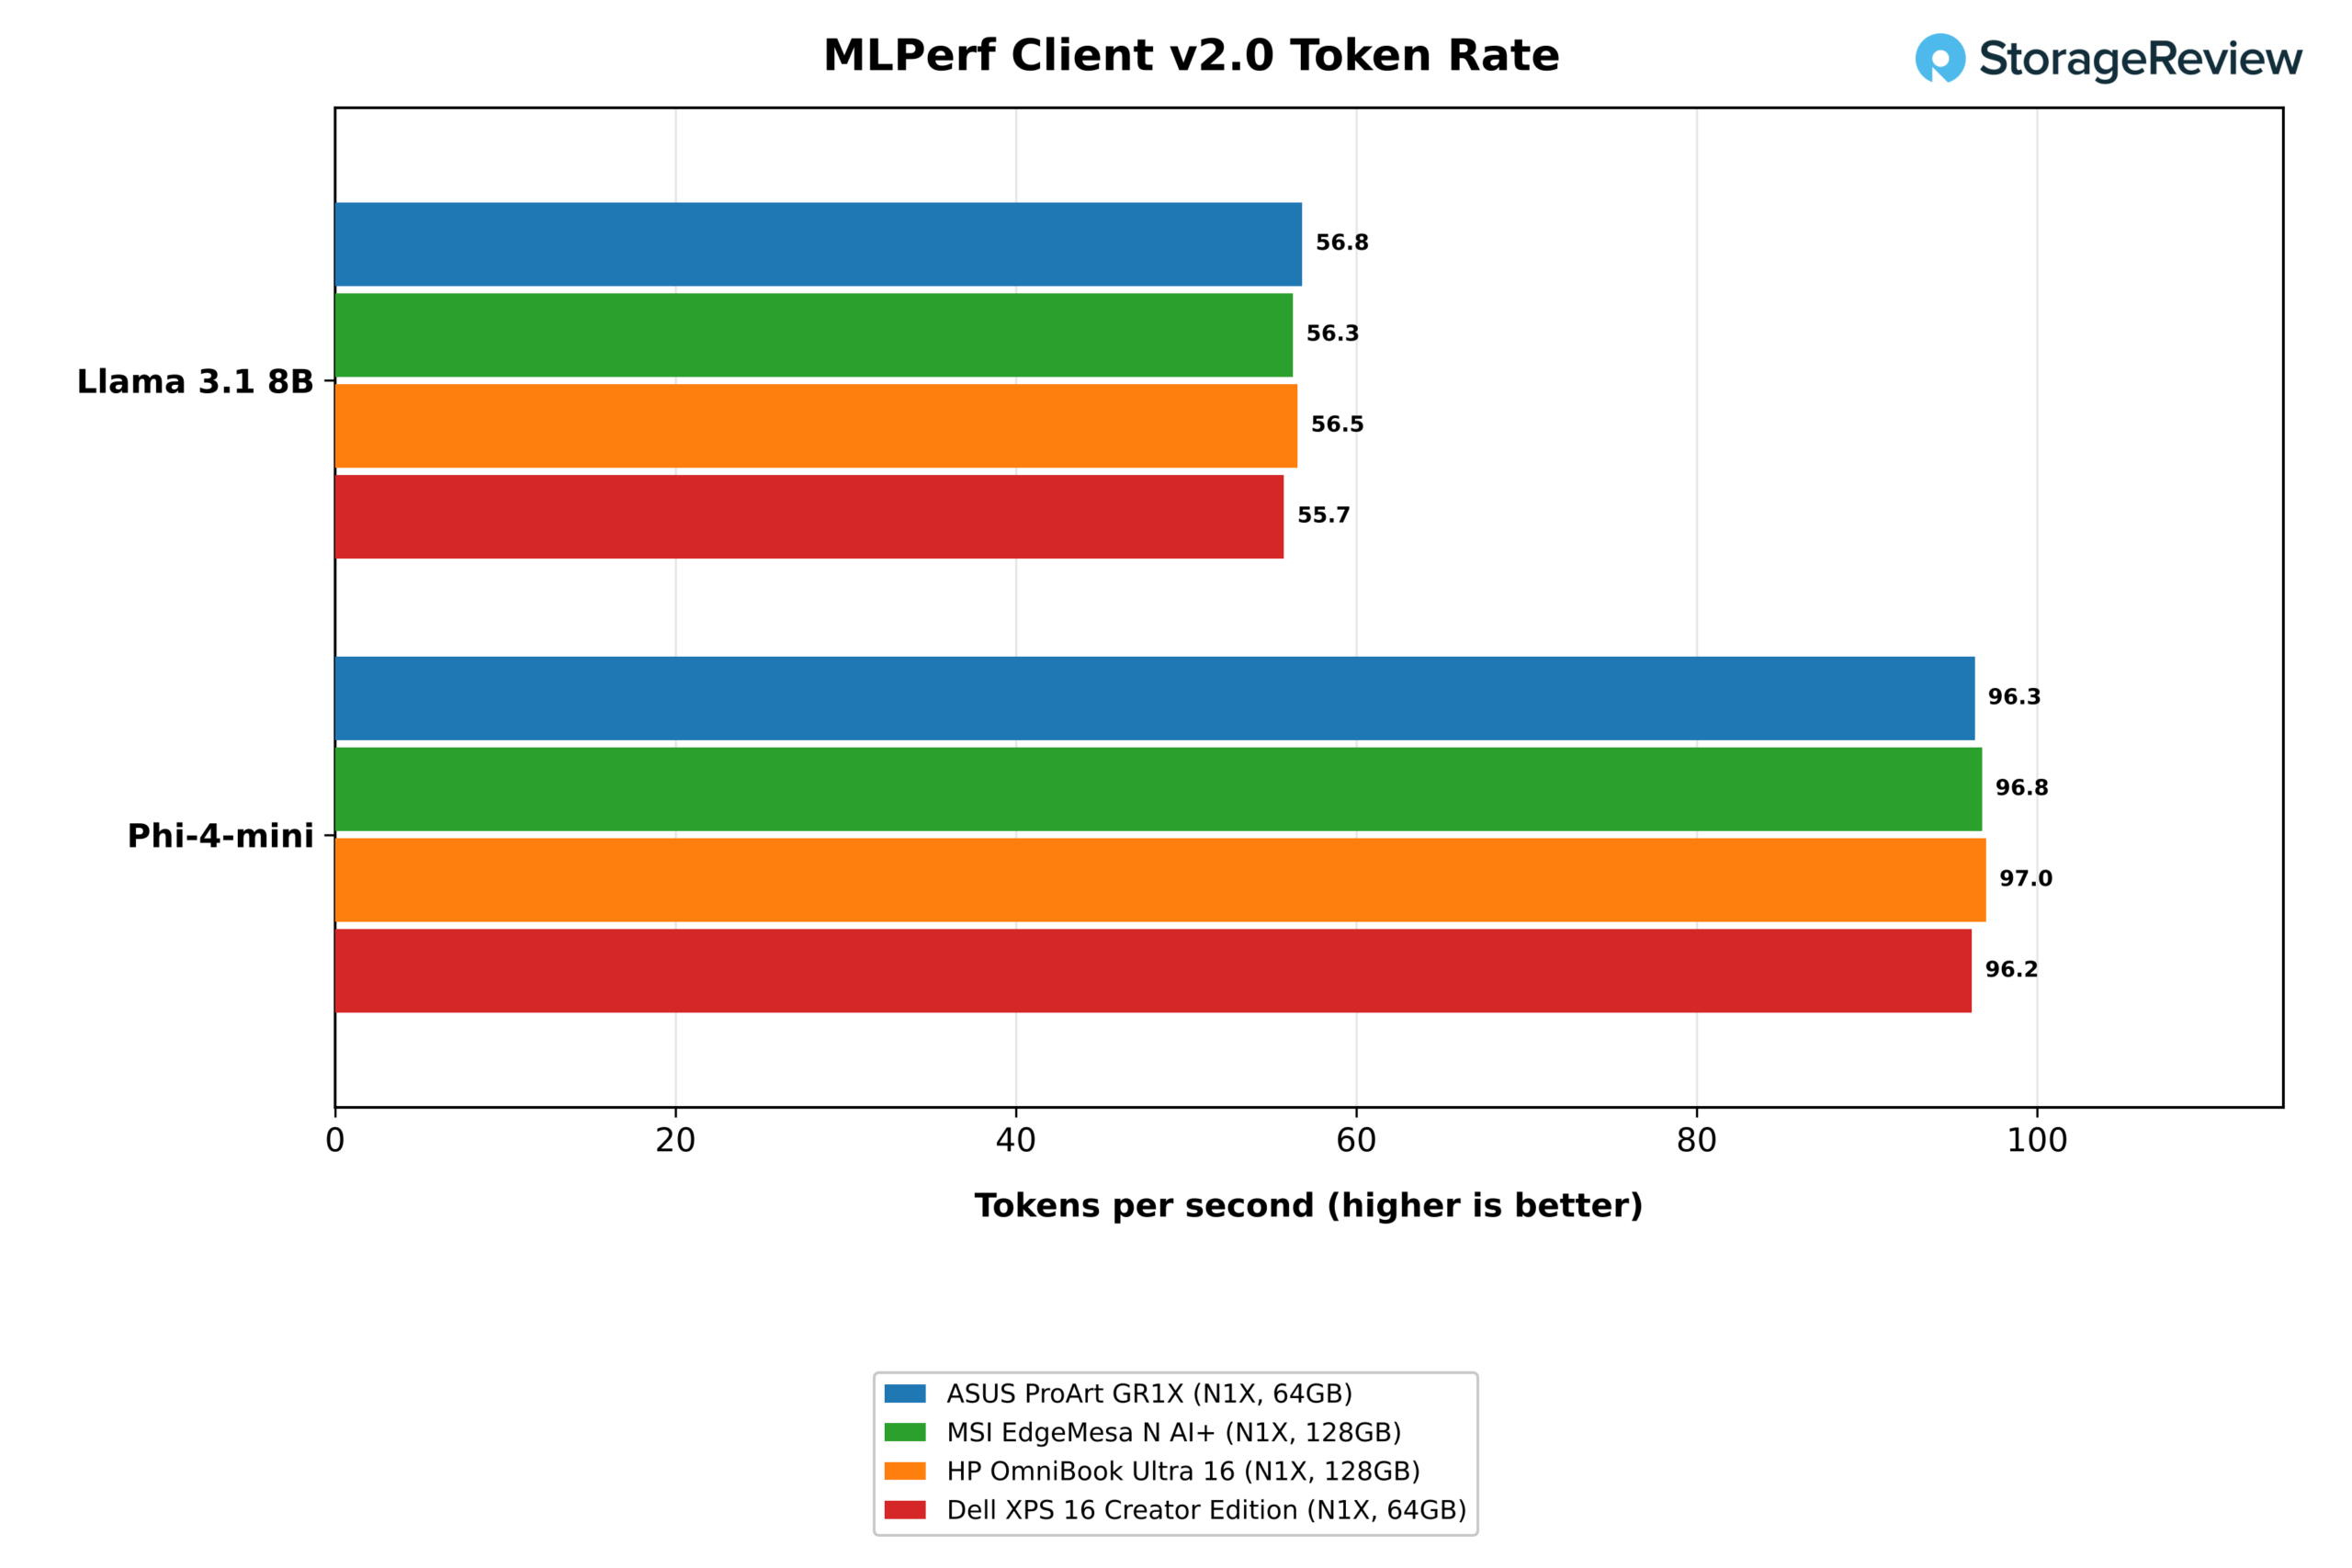
MLPerf Client issues one prompt at a time, and the results are a four-way tie. The GR1X generated 56.8 tokens per second on Llama 3.1 8B and 96.3 on Phi-4-mini; the EdgeMesa at 56.3 and 96.8; the HP at 56.5 and 97.0; and the XPS 16 at 55.7 and 96.2. Time to first token on Llama 3.1 8B was shortest on the ASUS at 0.24 seconds, and Phi-4-mini tied the EdgeMesa at 0.11 seconds. One person working with a small model will see no speed difference between this desktop, the EdgeMesa, and either laptop.
Carregamento de Modelos e o Agente de Codificação
| Model loading and coding agent, Ollama CUDA | ASUS ProArt GR1X (N1X, 64GB) | MSI EdgeMesa N AI+ (N1X, 128GB) | HP OmniBook Ultra 16 (N1X, 128 GB) | Dell XPS 16 Creator Edition (N1X, 64 GB) |
|---|---|---|---|---|
| gpt-oss:20b carregamento a frio para o primeiro token (s, quanto menor, melhor) | 10.94 | 7.00 | 6.70 | 7.73 |
| gpt-oss:20b carregamento a quente para o primeiro token (s, quanto menor, melhor) | 3.68 | 3.96 | 3.68 | 3.69 |
| gpt-oss:20b read throughput during cold load (MB/s) | 1,788 | 3,446 | 3,211 | 2,372 |
| Agent, gpt-oss:20b 64K context, successful runs (of 3) | 1* | 2* | 2* | 3 |
| Agent, gpt-oss:20b 64K context, wall time (s, lower is better) | 154 * | 294 * | 216 * | 360 |
| Agent, gpt-oss:20b 64K context, generation rate (tokens/s) | 58.2 | 57.8 | 57.1 | 58.5 |
| Redução da velocidade indicada pelo velocímetro ao lado do agente (x, quanto menor, melhor) | 1.79 | 1.78 | 2.35 | 2.79 |
*Flagged by the suite: at least one of the three agent runs did not pass all tests.
Cold model loads are the one AI result where our GR1X finished last, and the cause is the drive. It took 10.94 seconds to load the 12.8GB gpt-oss:20b model from disk to its first token, compared with 6.70 seconds on the HP, 7.00 on the EdgeMesa, and 7.73 on the XPS 16. Read throughput during that load averaged 1,788MB/s on the ASUS, 3,446MB/s and 3,211MB/s on the Gen5 drives in the EdgeMesa and the HP, and 2,372MB/s on the XPS 16. Warm loads were 3.68 to 3.69 seconds on the GR1X and the laptops, and 3.96 on the EdgeMesa, confirming the gap is in storage.
The coding agent asks a model to write and test code across several rounds, three times per configuration. With gpt-oss:20b at a 64K context, the GR1X passed one of three attempts, the EdgeMesa and the HP two, and the XPS 16 all three. Generation rates were level between 57.1 and 58.5 tokens per second, so the pass counts reflect variation in the model’s output from run to run. The 128GB EdgeMesa also ran the 35B agent tier, which the suite does not run on the 64GB systems. Running Speedometer alongside the agent slowed the browser by 1.79x on the ASUS and 1.78x on the MSI, compared with 2.35x and 2.79x on the laptops.
RAG
| RAG pipeline (higher is better unless noted) | ASUS ProArt GR1X (N1X, 64GB) | MSI EdgeMesa N AI+ (N1X, 128GB) | HP OmniBook Ultra 16 (N1X, 128 GB) | Dell XPS 16 Creator Edition (N1X, 64 GB) |
|---|---|---|---|---|
| Ingestão, passagens por segundo | 115.6 | 114.7 | 111.5 | 104.4 |
| Ingestão, taxa de incorporação (tokens/s) | 18,720 | 18,566 | 18,049 | 16,901 |
| Resposta: taxa de geração (tokens/s) | 104.2 | 103.4 | 103.4 | 95.0 |
| Resposta: tempo até o primeiro token p50 (s, quanto menor, melhor) | 0.15 | 0.15 | 0.15 | 0.17 |
| Pergunta-resposta p50 (s, quanto menor, melhor) | 0.22 | 0.23 | 0.23 | 0.25 |
Our RAG test embeds a set of passages, retrieves against them, and answers questions with phi4-mini. The GR1X ingested 115.6 passages per second, 4 percent ahead of the HP at 111.5 and 11 percent ahead of the XPS 16 at 104.4. It generated answers at 104.2 tokens per second against 103.4 and 95.0, and the median question was answered in 0.22 seconds. The EdgeMesa was level at 114.7 passages per second and 103.4 tokens per second. A document assistant at this scale fits easily inside the 64GB configuration.
Geração de Imagem
| Image generation at 1024×1024, stable-diffusion.cpp Vulkan (higher is better unless noted) | ASUS ProArt GR1X (N1X, 64GB) | MSI EdgeMesa N AI+ (N1X, 128GB) | HP OmniBook Ultra 16 (N1X, 128 GB) | Dell XPS 16 Creator Edition (N1X, 64 GB) |
|---|---|---|---|---|
| FLUX.2 klein 4B Q4_0, imagens por minuto | 10.07 | 9.95 | 11.01 | 11.17 |
| FLUX.2 klein 4B Q4_0, tempo por imagem (s, quanto menor, melhor) | 5.96 | 6.03 | 5.45 | 5.37 |
| Z-Image Turbo 6B BF16, images per minute | 4.17 | 4.03 | 4.19 | 3.89 |
| Qwen-Image 20B Q4_0, images per minute | 0.53 | 0.53 | 0.50 | 0.49 |
| Qwen-Image 20B Q8_0, images per minute | Não funciona | 0.51 | 0.47 | Não funciona |
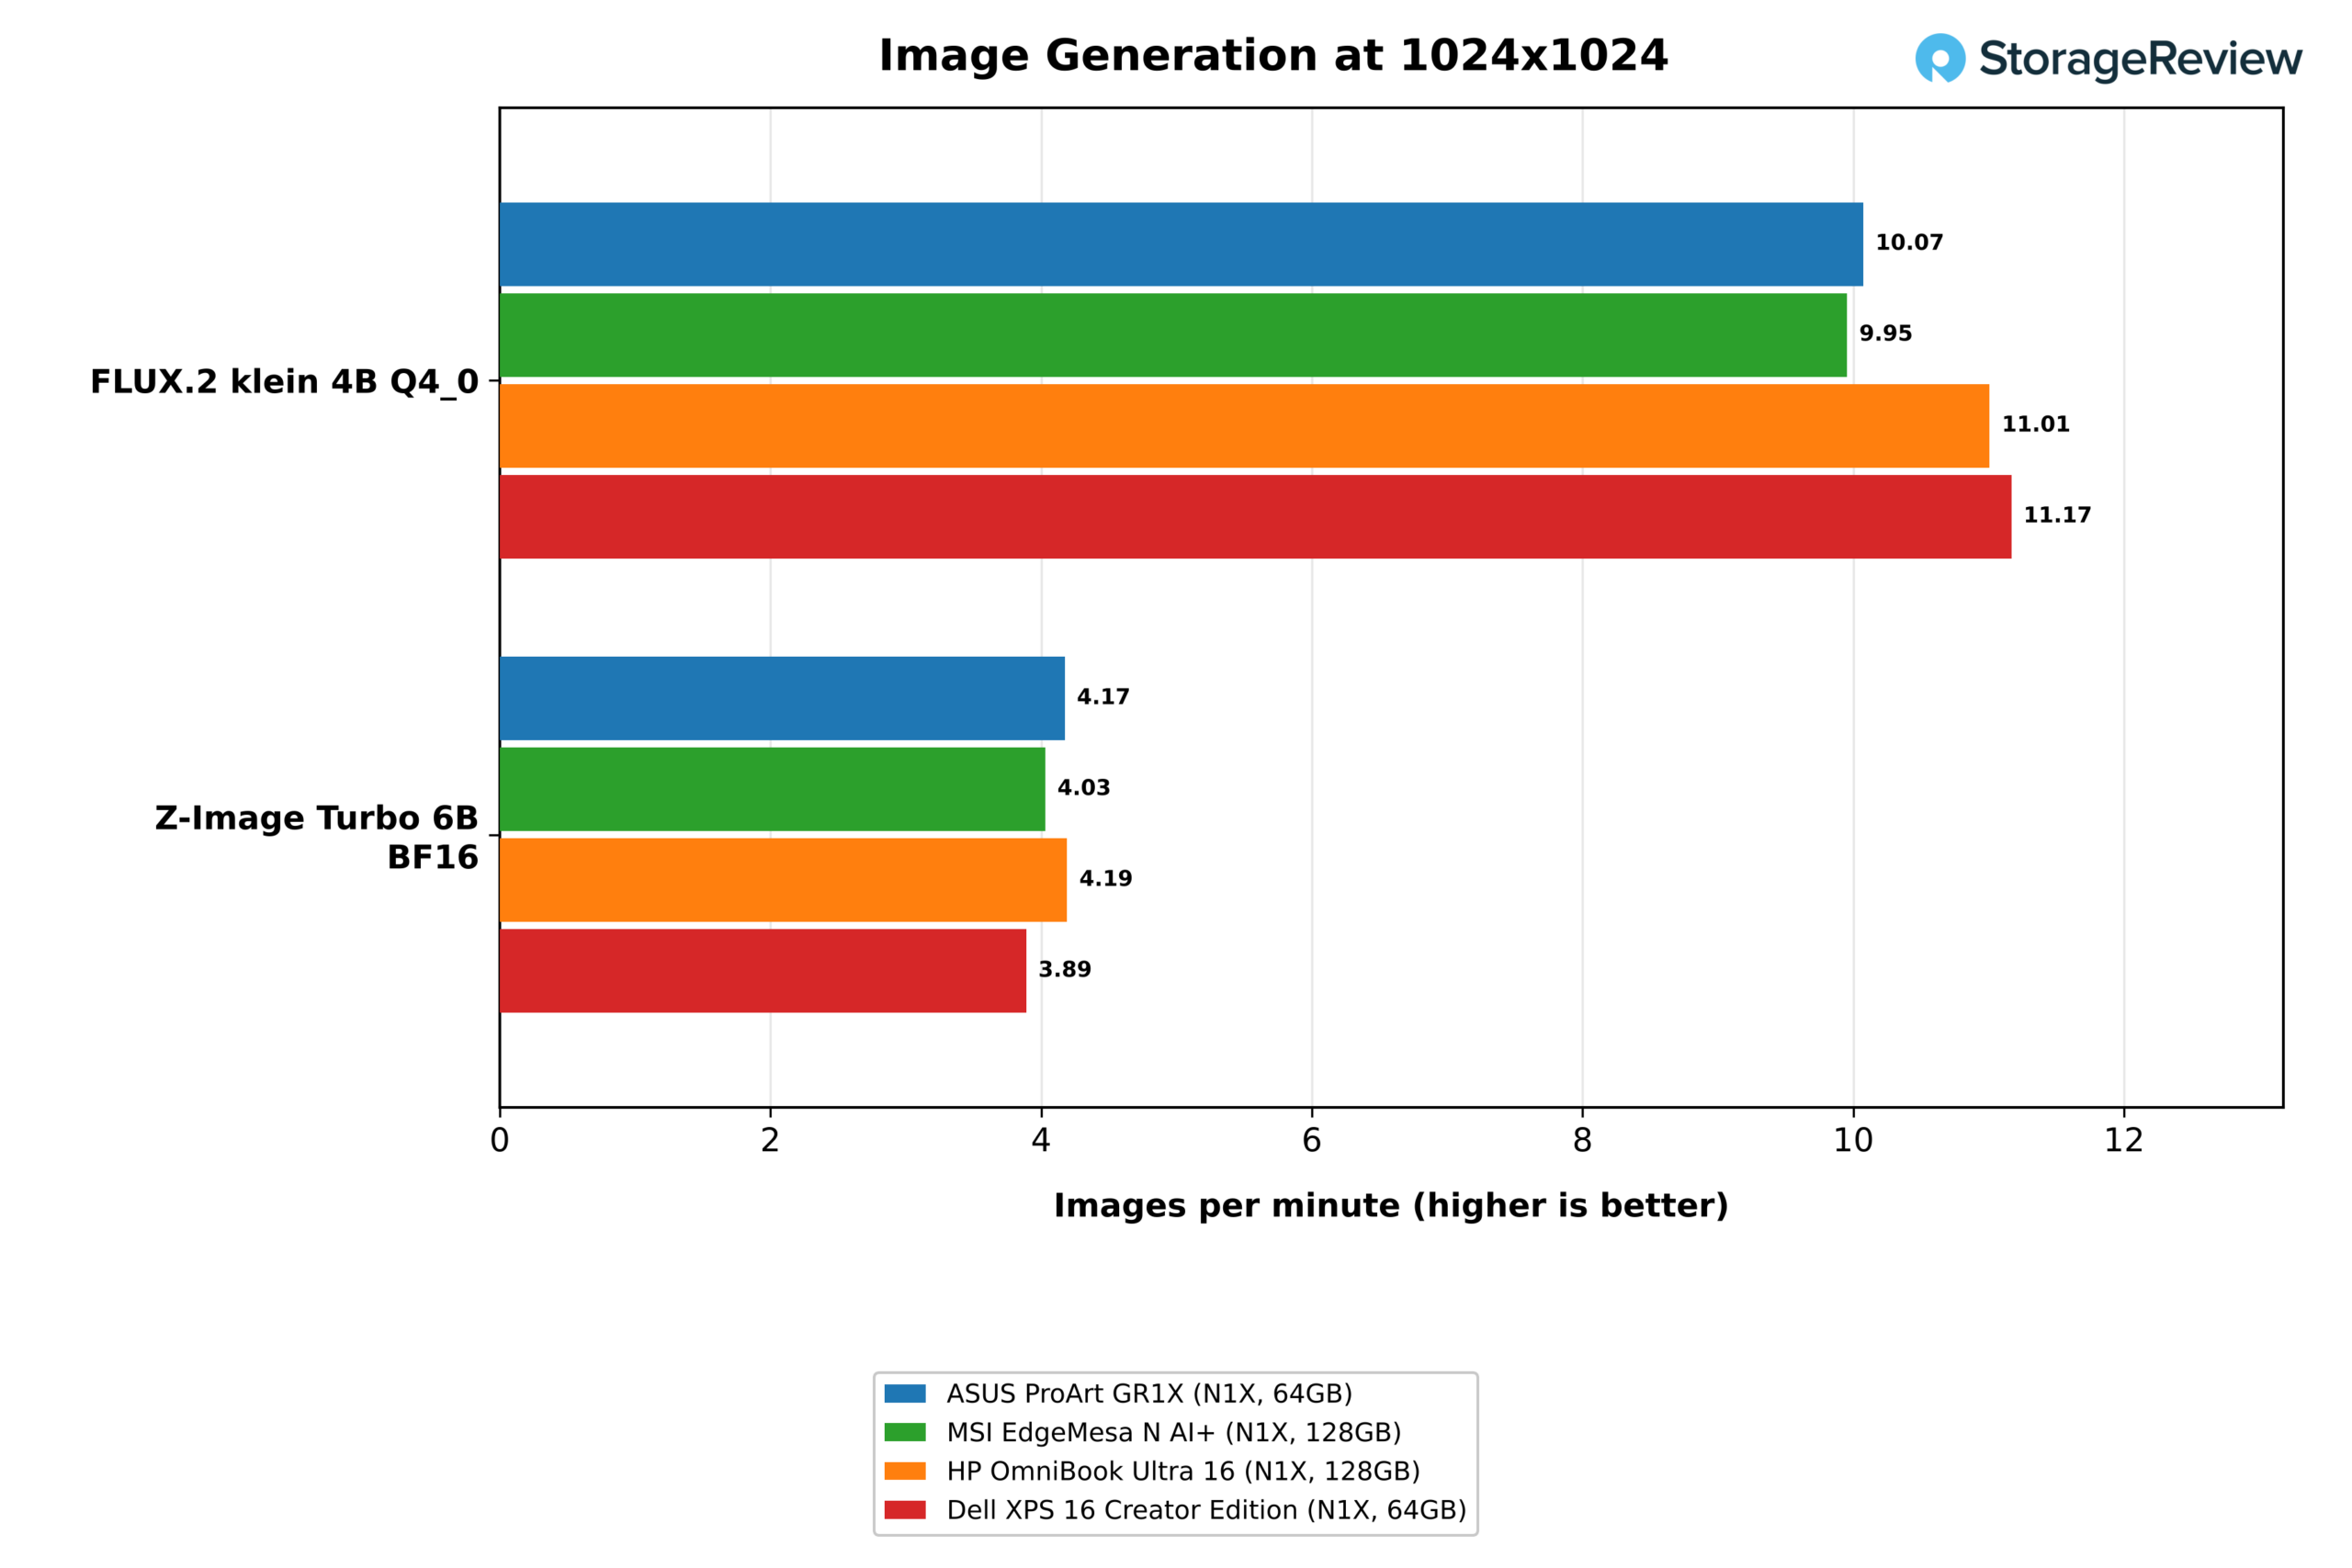
Image generation runs through Vulkan, and its results were mixed. FLUX.2 klein 4B at Q4 produced 10.07 images per minute, compared with 11.01 on the HP and 11.17 on the XPS 16, while Z-Image Turbo 6B at BF16 matched the HP at 4.17 vs 4.19, and Qwen-Image 20B at Q4 edged both laptops at 0.53. The laptops ran an earlier suite release, while the EdgeMesa ran the current one and produced 9.95 on FLUX.2, level with the GR1X, which suggests the suite release is the source of the gap.
The larger Q8 and BF16 versions of Qwen-Image 20B did not run on our 64GB unit, and the 128GB EdgeMesa and HP completed the Q8 version at 0.51 and 0.47 images per minute. FLUX.2 klein at Q8 was flagged for a stalled image, and the BF16 version failed on both attempts when the Vulkan device was lost, so we left those rows out of the table.
Gráficos e codificação de GPU
| Graphics and GPU encode (higher is better) | ASUS ProArt GR1X (N1X, 64GB) | MSI EdgeMesa N AI+ (N1X, 128GB) | HP OmniBook Ultra 16 (N1X, 128 GB) | Dell XPS 16 Creator Edition (N1X, 64 GB) |
|---|---|---|---|---|
| SuperTuxKart em 1080p, FPS médio | 274.0 | 269.8 | 269.7 | 248.6 |
| SuperTuxKart em 1080p, FPS típico | 275 | 270 | 271 | 250 |
| SuperTuxKart em 1080p, com FPS geralmente estável. | 238 | 232 | 236 | 214 |
| SuperTuxKart 1080p, FPS estável | 136 | 134 | 141 | 131 |
| SuperTuxKart 4K, FPS médio | 114.1 | 111.8 | Não funciona | Não funciona |
| FFmpeg HEVC Media Foundation (fps) | 65 | 54 | 53 | 61 |
SuperTuxKart at the ultra preset averaged 274.0 fps at 1080p on the GR1X, ahead of the HP at 269.7 and the XPS 16 at 248.6, and it averaged 114.1 fps at 4K on our external monitor, a resolution the laptops did not run. The EdgeMesa averaged 269.8 fps at 1080p and 111.8 fps at 4K. FFmpeg’s hardware HEVC encode through Media Foundation reached 65 fps on the GR1X, against 54 on the EdgeMesa, 53 on the HP, and 61 on the XPS 16. The hevc_nvenc encoder is not present in the Arm build of FFmpeg that the suite uses.
Desempenho de Armazenamento
| fio, 25 GiB de espaço ocupado (quanto maior, melhor) | ASUS ProArt GR1X (N1X, 64GB) | MSI EdgeMesa N AI+ (N1X, 128GB) | HP OmniBook Ultra 16 (N1X, 128 GB) | Dell XPS 16 Creator Edition (N1X, 64 GB) |
|---|---|---|---|---|
| Leitura sequencial 128K (MB/s) | 6,511 | 13,315 | 13,598 | 6,502 |
| Gravação sequencial 128K (MB/s) | 5,235 | 12,910 | 11,899 | 5,670 |
| Leitura aleatória de 4K, QD32 x 4 tarefas (IOPS) | 552,652 | 331,187 | 449,043 | 300,063 |
| Escrita aleatória de 4K, QD32 x 4 tarefas (IOPS) | 143,165 | 386,814 | 234,888 | 256,856 |

Our unit’s 1TB Micron drive links at PCIe Gen4 x4 and performs like a Gen4 drive, at 6,511MB/s sequential read and 5,235MB/s sequential write on the 25GiB footprint. That is level with the 1TB drive in the XPS 16 at 6,502 and 5,670MB/s, and about half the rate of the Gen5 drives in the EdgeMesa (13,315 and 12,910MB/s) and the HP (13,598 and 11,899MB/s). ASUS offers a 4TB Gen5 option for the GR1X, and the cold-load results earlier in this review show what the faster interface is worth for model files.
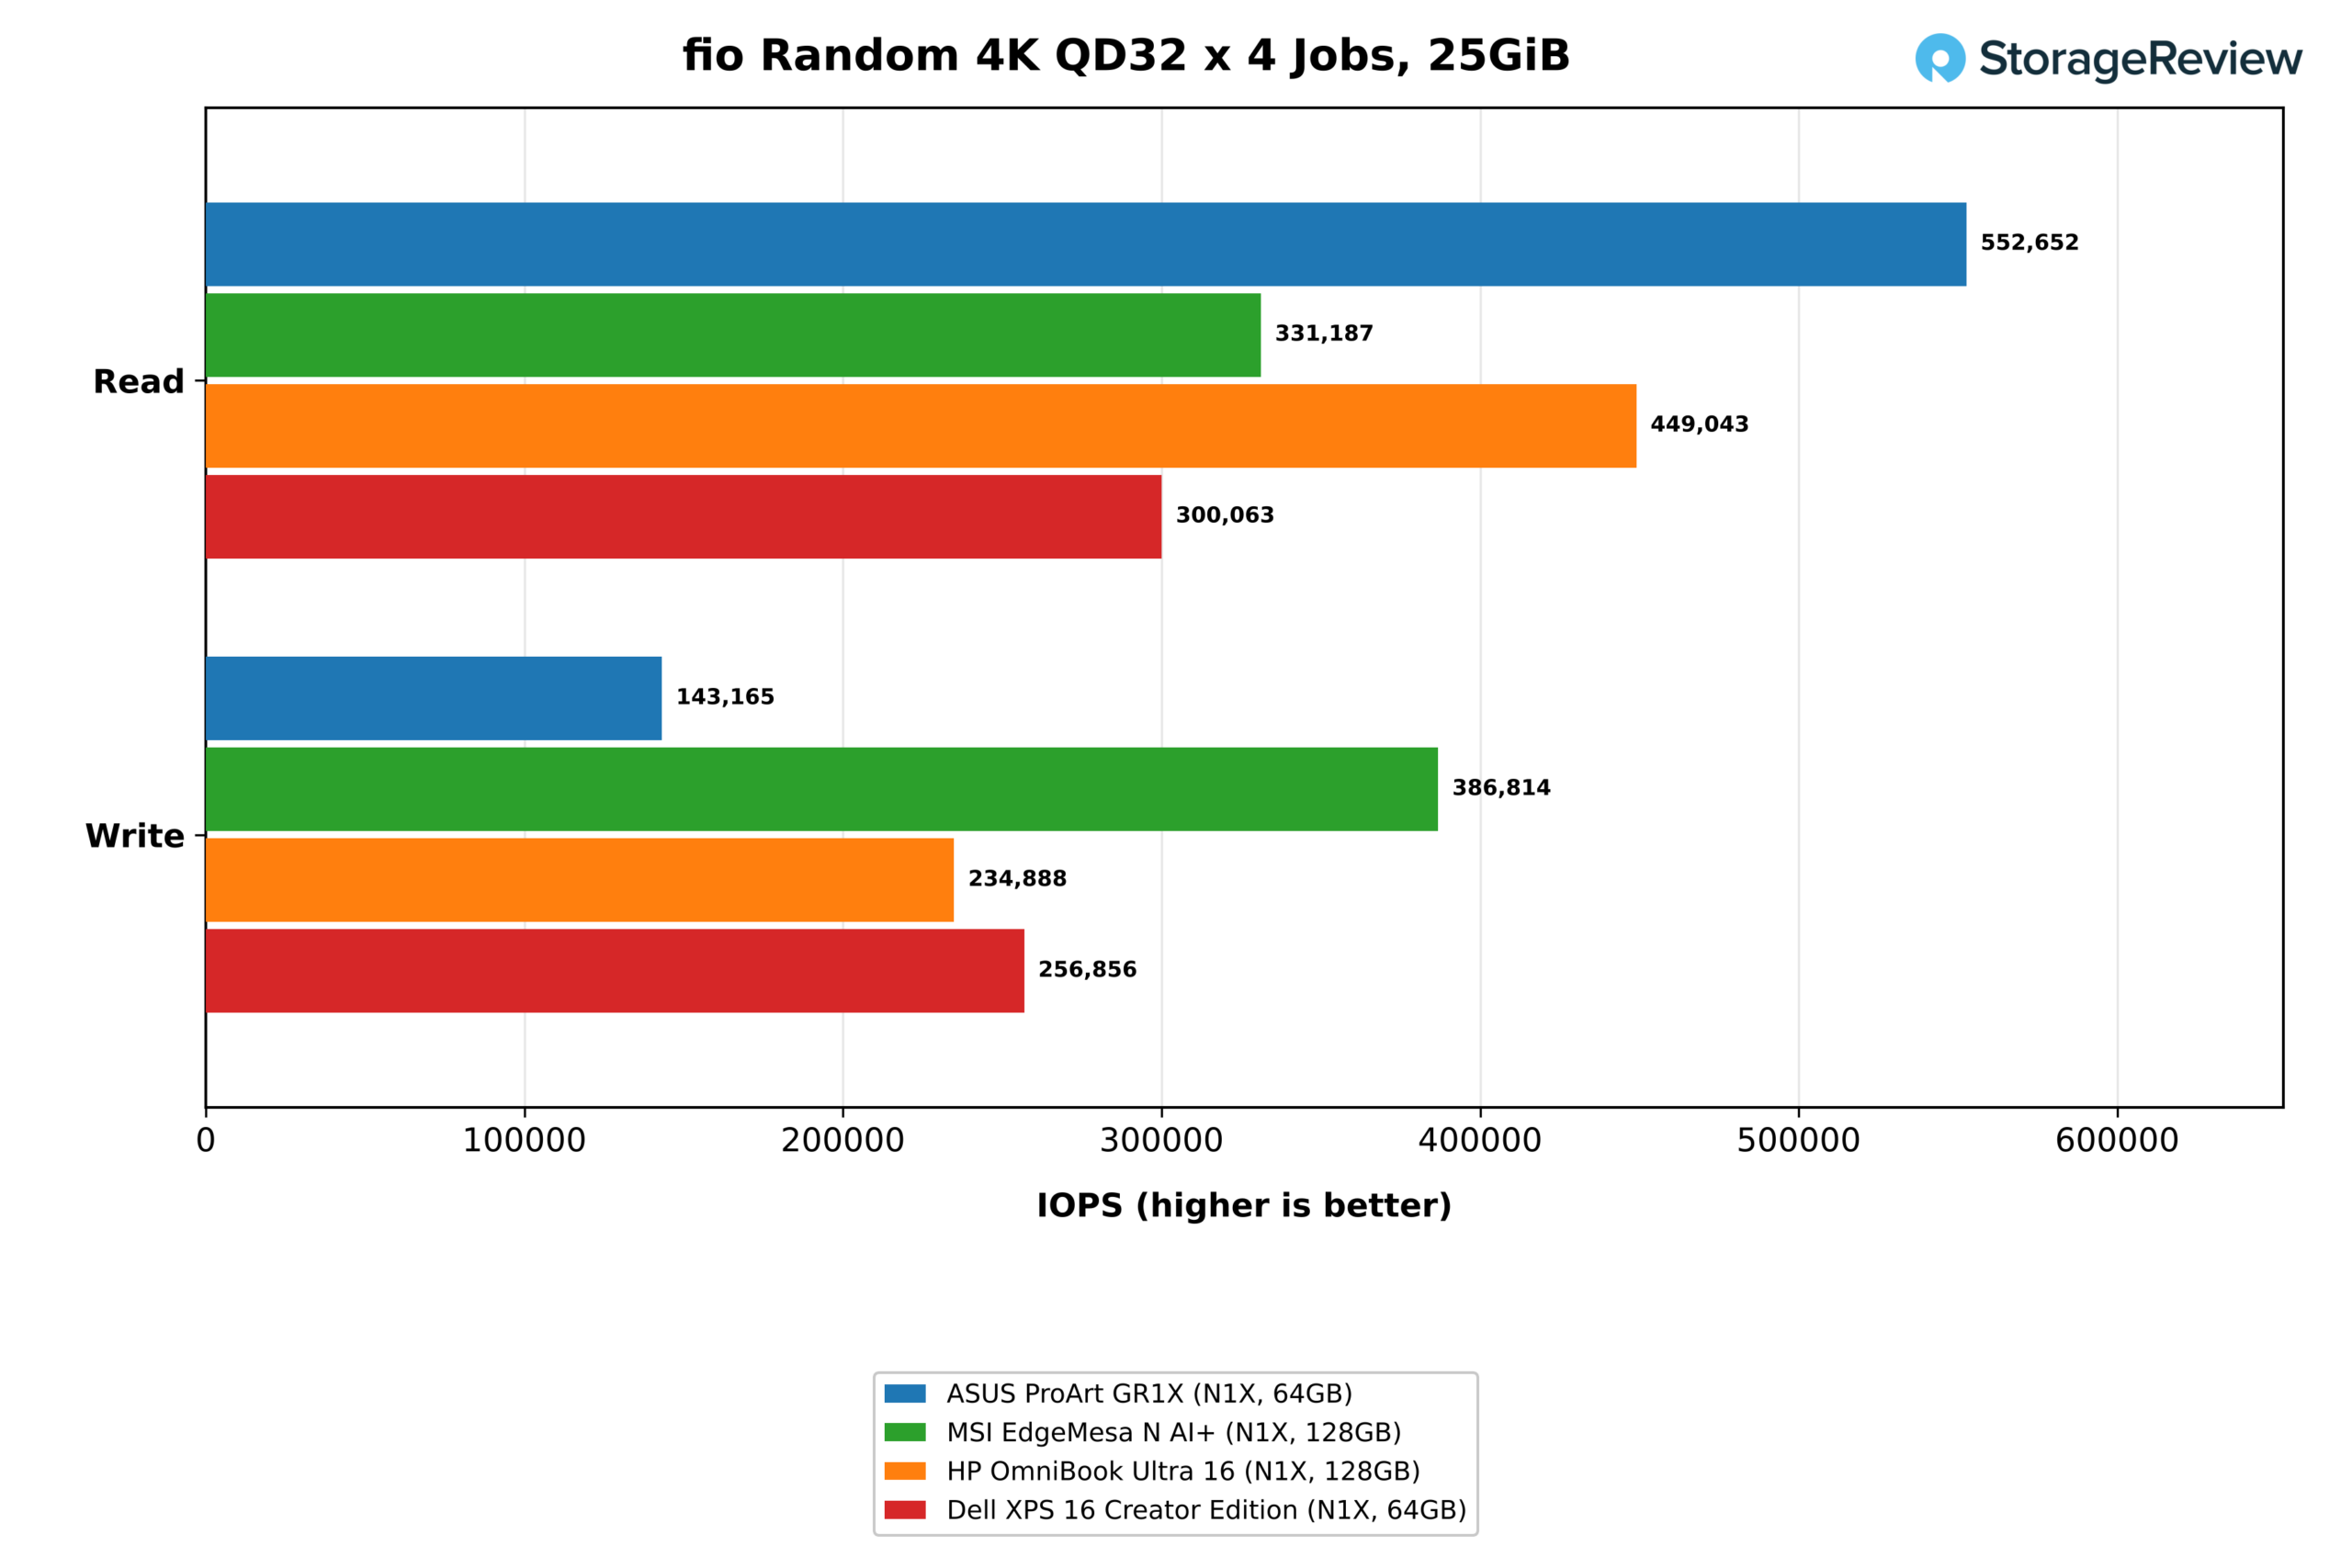
Random reads were the strongest part of the Micron drive’s results. At queue depth 32 across four jobs, it delivered 552,652 IOPS, ahead of the HP at 449,043 and the XPS 16 at 300,063, and the suite’s peak pass across job counts reached 976,418 IOPS. Random writes were its weak point at 143,165 IOPS, against 386,814 on the EdgeMesa and 234,888 and 256,856 on the laptops. With two 2280 slots, a buyer of the 64GB model can keep this drive for Windows and add a second drive for models, which is the first upgrade we would make.
Conclusão
The ASUS ProArt GR1X makes the case for RTX Spark on the desk through its cooling. It ran our 30-minute loop 5 to 12 percent faster than the fastest N1X laptops while averaging 14C lower, and it stayed under 90C in nine of ten logged tests. That margin became 9 to 14 percent more x265 throughput and 18 to 25 percent more output with eight requests on a 27B model. ASUS’s statement that owners will rarely see thermal throttling matched what we measured.
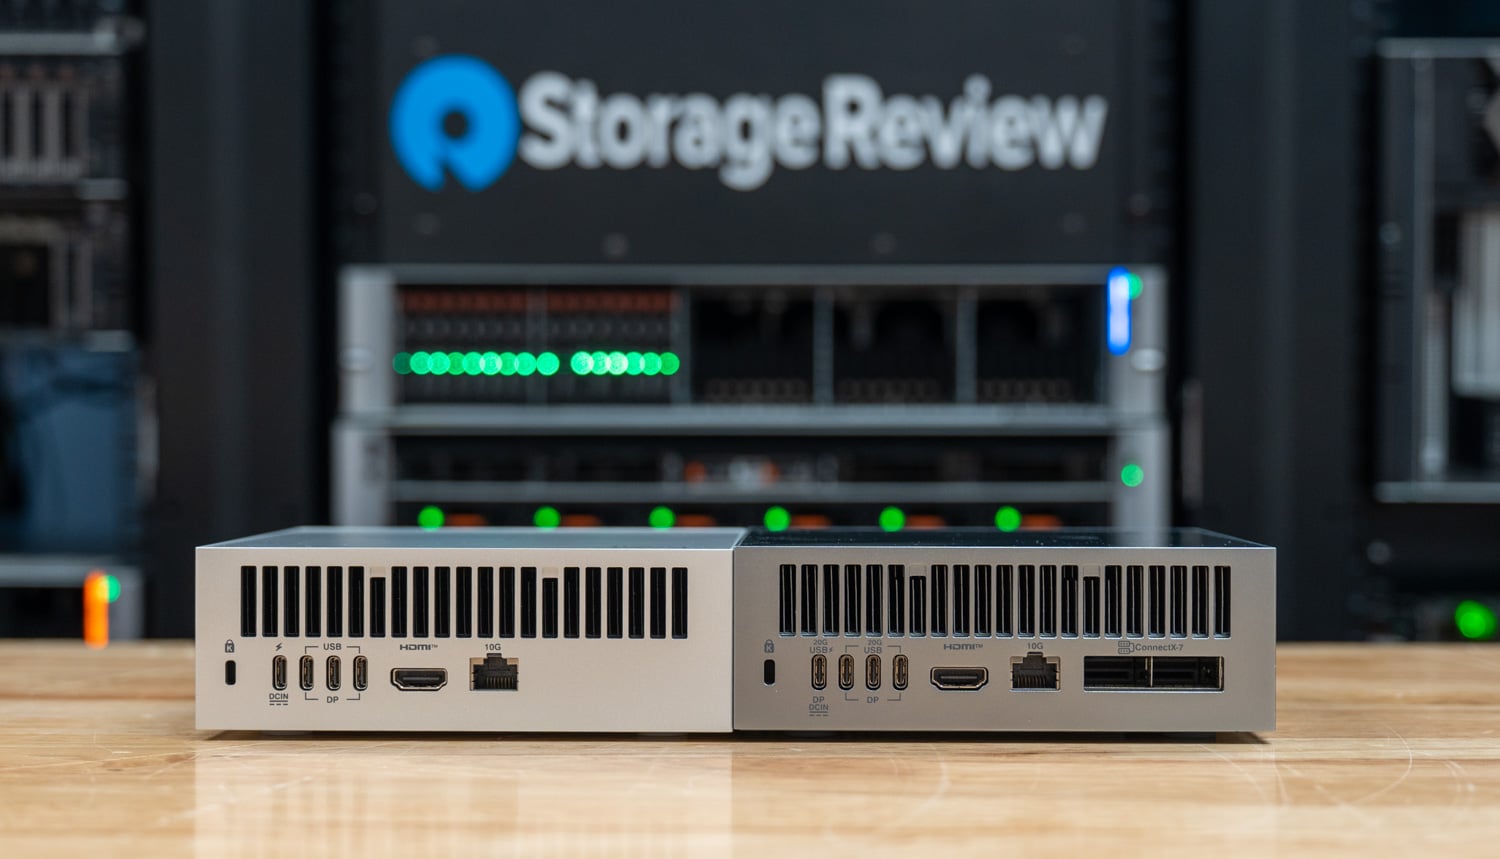
The storage layout is the other reason to pick this chassis. Two M.2 2280 slots mean the 1TB Gen4 drive in our unit, which was the slowest part of the system in cold model loads and random writes, is a starting point an owner can build on with standard retail drives. It read at 6,511MB/s in our test, and a cold load of a 12.8GB model took 10.94 seconds, compared with 7.00 seconds on the EdgeMesa’s Gen5 drive.
Memory is the choice a buyer has to get right at purchase, because unified memory can’t be added later. The 64GB configuration we tested handled models up to the 27B class with eight concurrent requests, RAG, and the smaller image models, and it stopped short of Qwen-Image at Q8 and the 35B coding-agent model. For work that fits that envelope, the 64GB GR1X matched or led the 128GB systems in LLM serving and most CPU tests, with its widest deficits about 4 percent in the LLVM build and 5 percent in OpenBLAS DGEMM, and larger models call for the 128GB GR1X.
Against the MSI EdgeMesa N AI+, the other RTX Spark mini PC we tested, performance is a tie, with the two within 2 percent of each other in the Cinebench loop, Blender, x265 encoding, and LLM serving. The GR1X ran 3C to 8C cooler on average in CPU tests, and it has two M.2 2280 slots where MSI offers a single SSD. The EdgeMesa we tested carried 128GB and a 4TB Gen5 SSD, so it loaded models faster and ran the larger ones that our 64GB unit didn’t.
Within ASUS’s lineup, the GR1X is the stationary Windows option beside the ProArt P16 and P14 laptops, and the Ascent GX10 remains the pick for Linux and DGX OS development. Against the laptops we tested, it trades the display, keyboard, and battery for lower temperatures, higher sustained output, and a second SSD slot.


 Amazon