

We review so many NAS systems that we rarely have time to explore all of the features available within these systems. From a QNAP perspective, they’ve been working to continue to enhance the ways flash can be taken advantage of within their systems. This is both in terms of aggressive hardware designs that allow for a ton of flash via 2.5″ and/or M.2 slots, and within the NAS operating system itself (QNAP QTS). On the software side, QNAP offers two ways to accelerate NAS performance with SSDs. The first is their auto tiering mechanism dubbed Qtier, the second is via SSD cache. In this review we take a look at both options to illustrate the performance benefits of each technology.
First off, a quick primer on Qtier and SSD caching. Qtier is the company’s automated tiering technology. Qtier optimizes the performance and efficiency of storage by moving hot data to the higher performance SSDs and lower performing or cooler data to either SAS or SATA HDDs. This gives users the performance of SSDs while taking advantage of the cost-effective larger capacities of HDDs. QNAP states that the data will be migrated without interfering with normal IO. Alternatively SSD cache does writes the data that needs to the highest performance to all SSDs and can be read back from the cache, thus improving performance. The data can exist on both the SSDs and HDDs at the same time in help protect data integrity.
Qtier Management
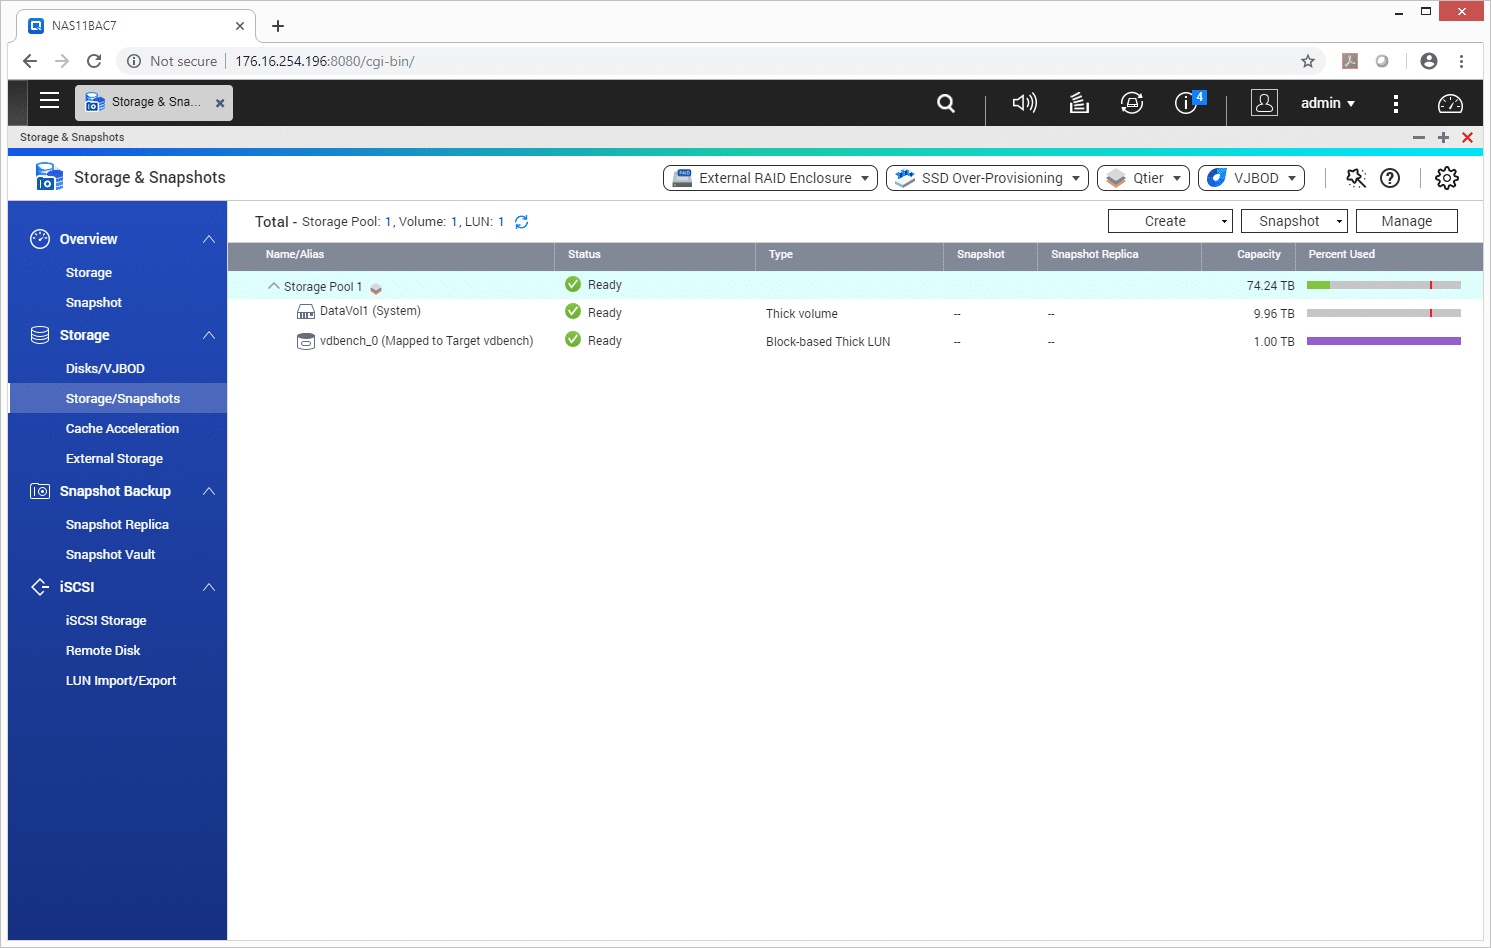
The Qtier feature is fairly easy to setup. In the QTS operating system one simple needs to pull up the Storage & Snapshots screen. Here they can see the Storage Pools and their status. Qtier is one of the options near the top right.
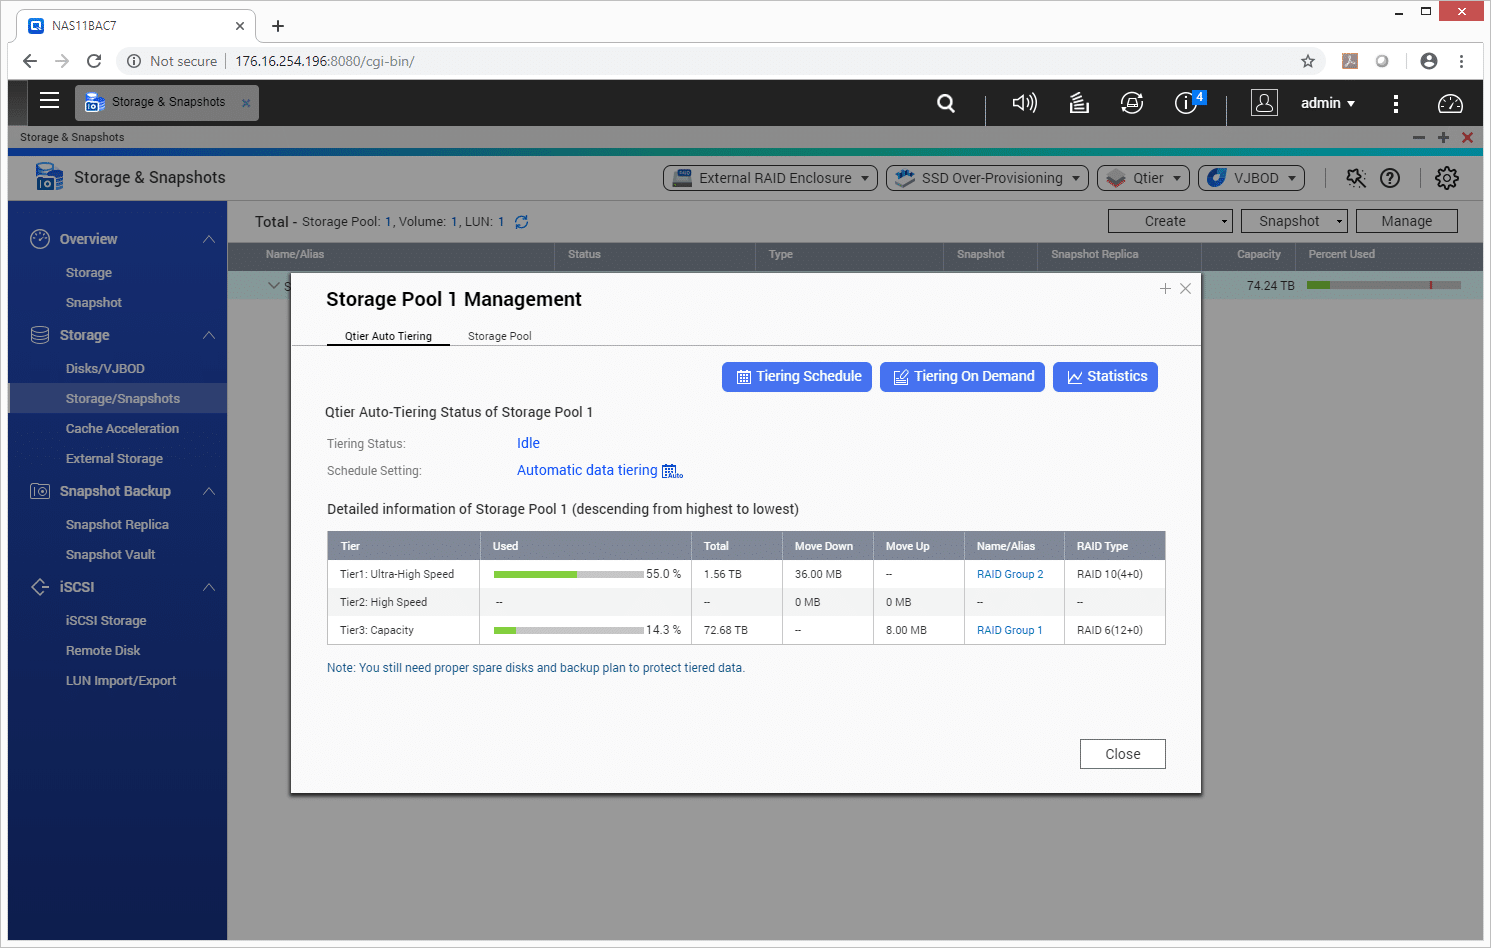
Opening the Qtier option, users see Qtier Auto Tiering and Storage Pool as the main screens. From the Qtier Auto Tiering there is information about the storage pools setup including the various tiers. From this screen there is three options: Tiering Schedule, Tiering On Demand, and Statistics.
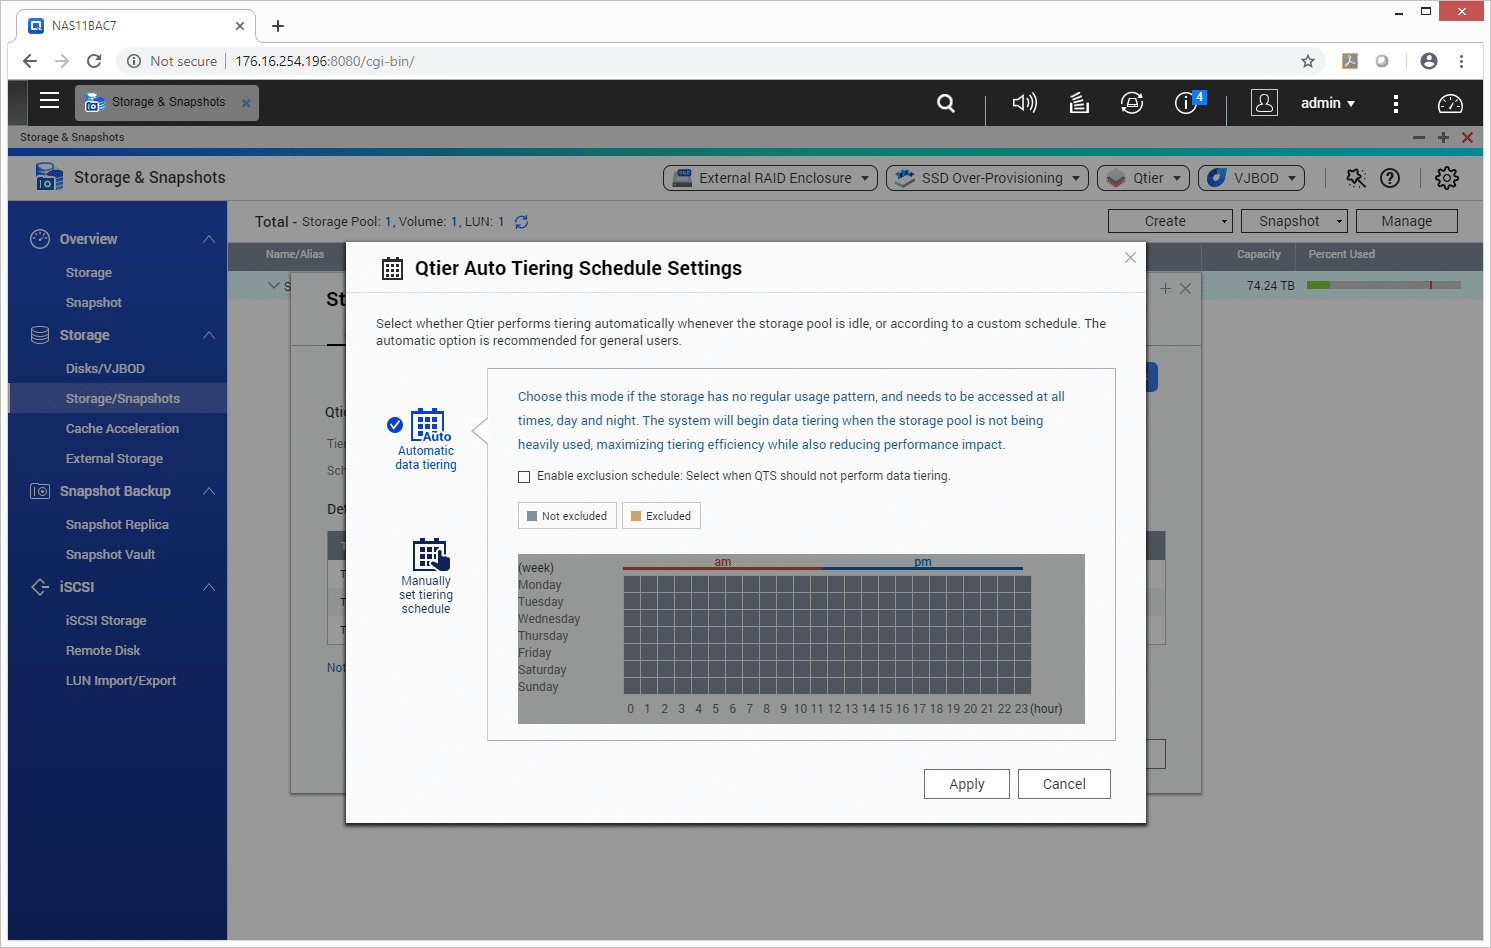
Tiering Schedule is like it sounds. Users can either setup automatic tiering or manually schedule tiering. Depending on the workload, either option may make sense.
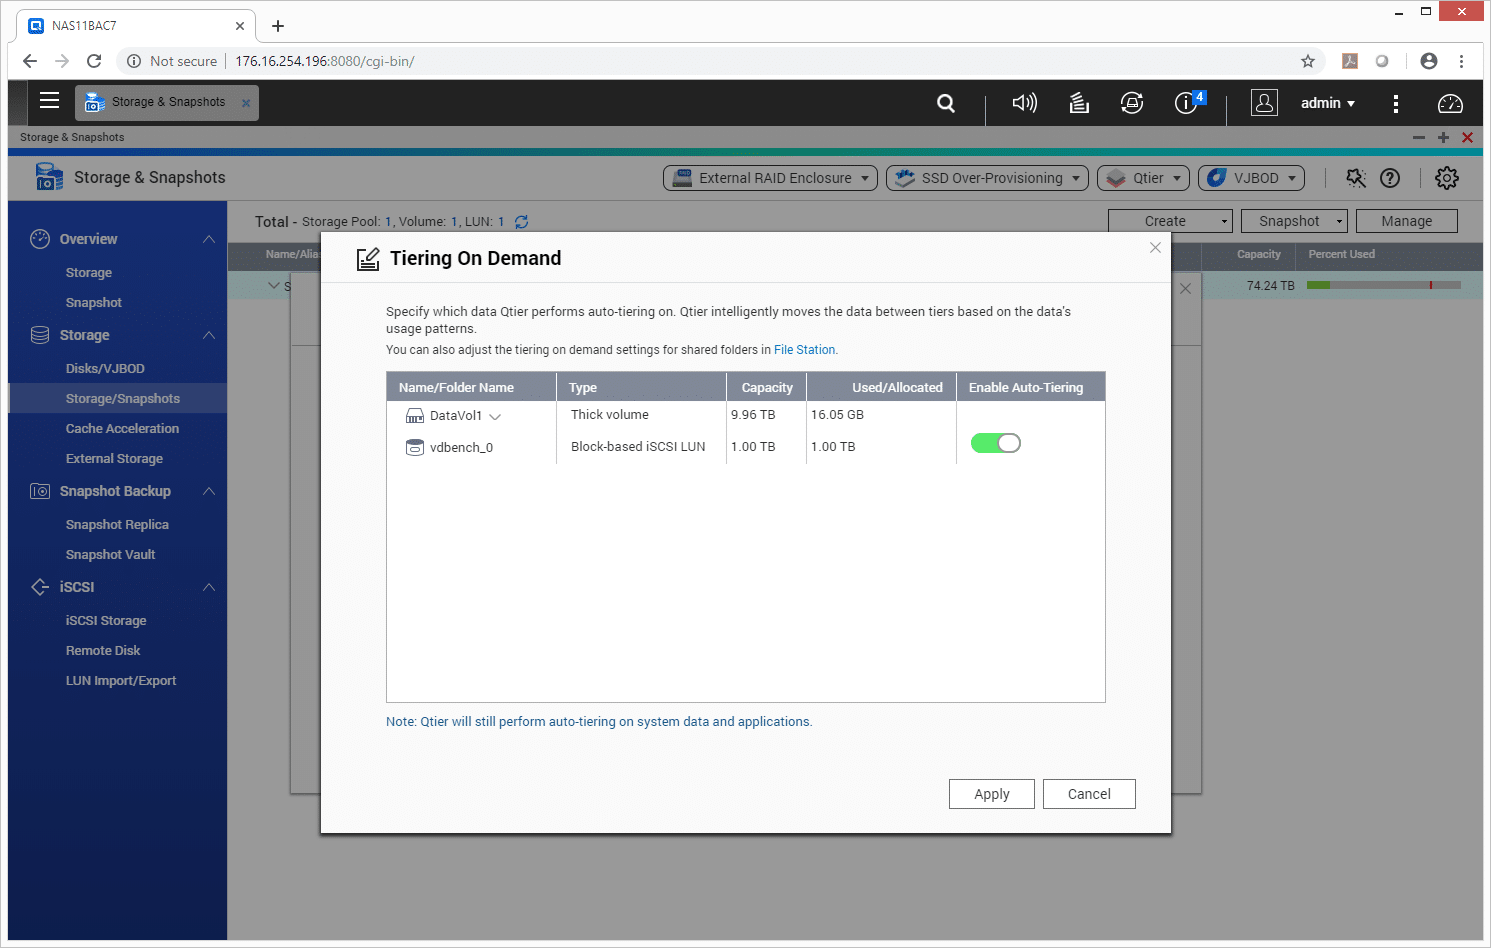
If users only need Qtier to automatically tier certain data they can set this up with the Tiering On Demand feature.
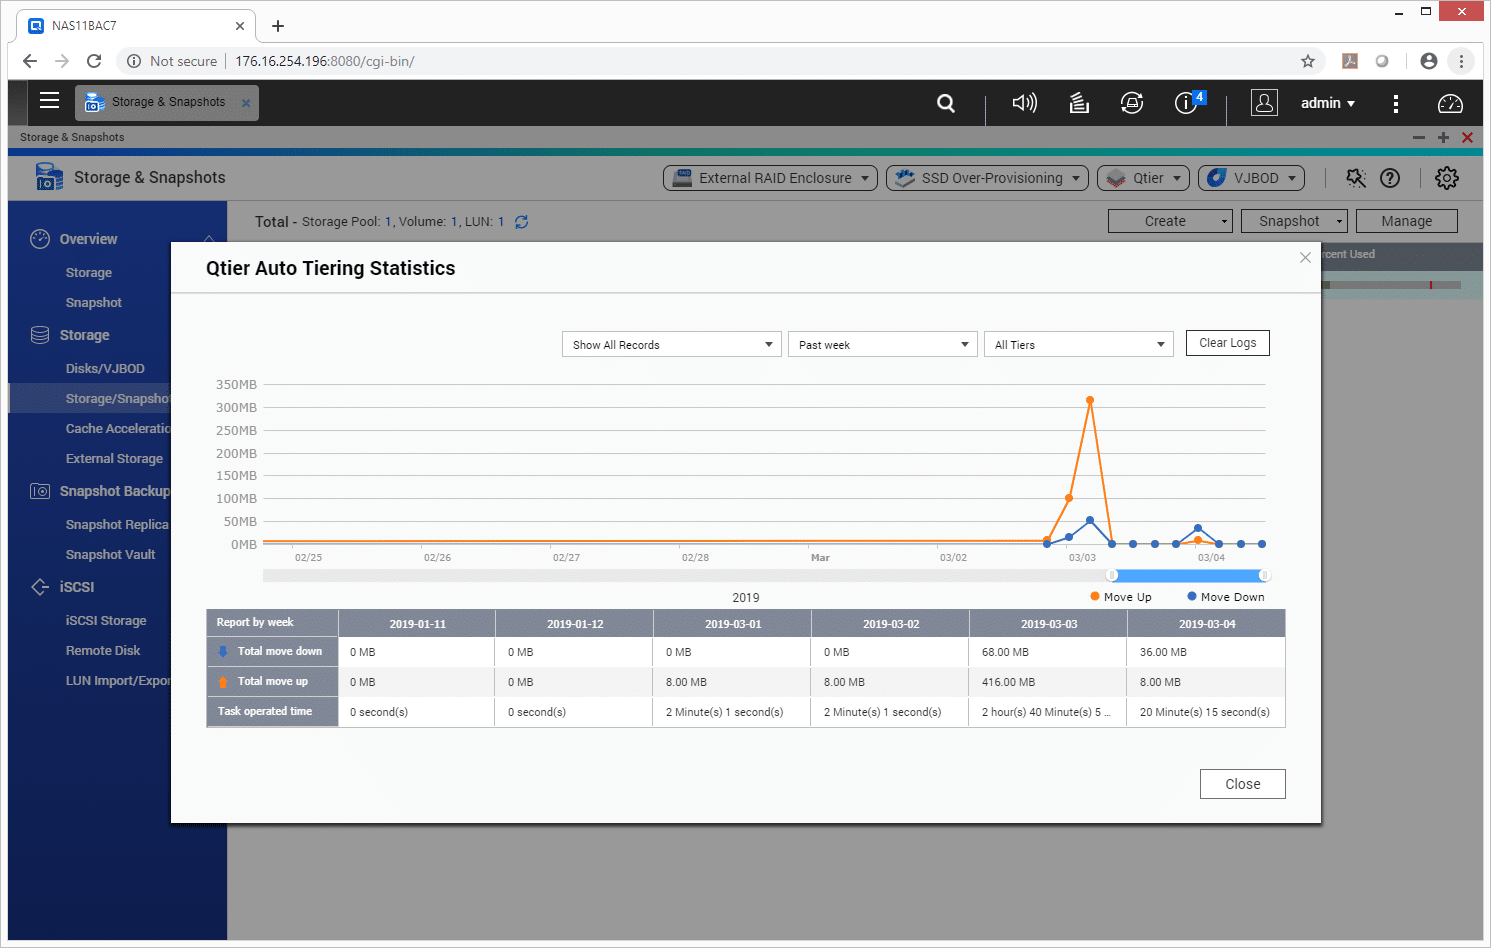
Through Qtier Auto Tiering Statistics users can see when and where their data is being moved.
Performance
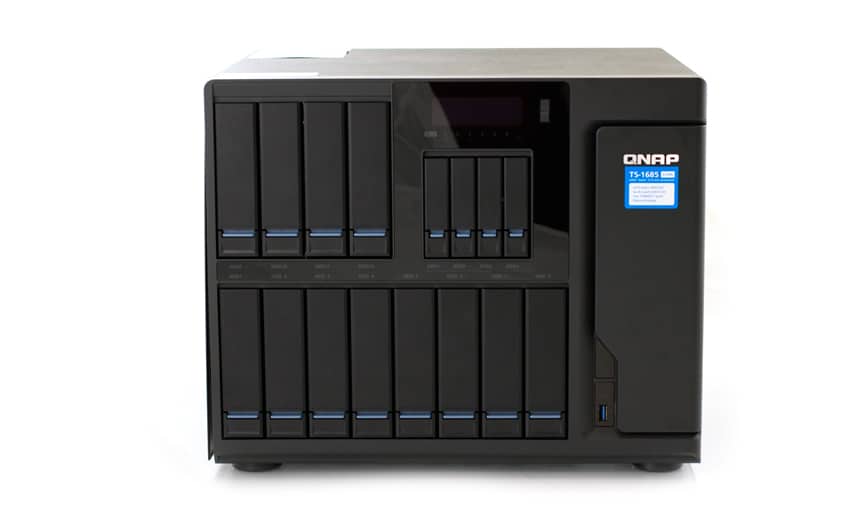
The testbed in this case is the QNAP TS-1685, which includes twelve 3.5” bays for high-capacity storage as well as four dedicated 2.5” SSD bays. In addition to the front-accessible storage, QNAP also supports up to six SATA-based m.2 SSDs internally. The system under test is configured with 64GB RAM, twelve 8TB Seagate Enterprise NAS HDDs and four 960GB Samsung 860 DCT SSDs. The HDDs were configured in a 12-drive RAID6 and the SSDs were attached to the storage pool via Qtier in a 4-drive RAID10 with 10% over-provisioning suggested via the QNAP SSD profiling tool. From this storage pool we carved out a 1TB LUN that we attached to a VMware ESXi 6.7u1 host to perform out tests on.
For the purposes of this review, we tested three configurations:
- Standard performance of the 12-drive RAID6 HDD Pool
- RAID6 HDD Pool + SSD cache (RAID10 via our 4 SSDs)
- RAID6 HDD Pool + SSD Tier (RAID10 via our 4 SSDs)
VDBench Workload Analysis
Profiles:
- 4K Random Read: 100% Read, 128 threads, 0-120% iorate
- 4K Random Write: 100% Write, 64 threads, 0-120% iorate
- 64K Sequential Read: 100% Read, 16 threads, 0-120% iorate
- 64K Sequential Write: 100% Write, 8 threads, 0-120% iorate
- Synthetic Database: SQL and Oracle
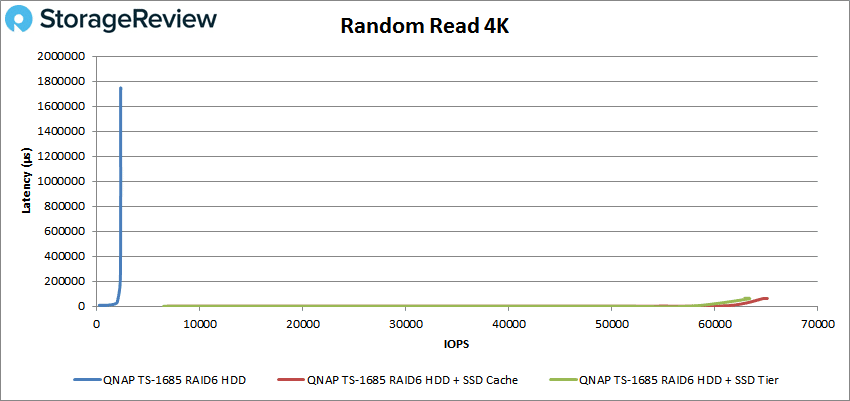
In 4K peak read performance, the standard performance started at 245 IOPS and 9.3ms latency before going on to peak at 2,329 IOPS with a latency of 1,737ms. Both Qtier and SSD cache started around 7K IOPS and under 1ms in latency, both configurations stayed under 1ms until about 52K IOPS. The SSD cache peaked higher with 64,770 IOPS at 63ms compared to the Qtier’s peak of roughly 63,300 IOPS with a latency of 60.1ms before dropping off some.
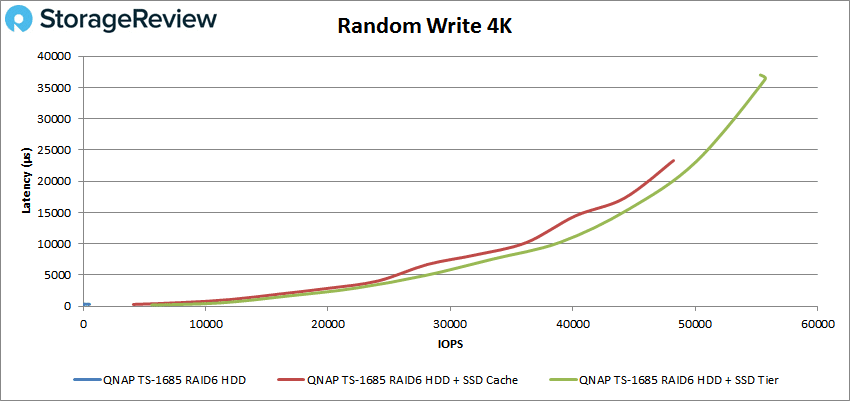
Looking at 4K random write, the standard performance was short lived with a start of 50 IOPS at 343μs ad a peak of 518.5 IOPS at 336.8μs. SSD cache started at 4,100 IOPS and 308.1μs and broke 1ms at about 11K IOPS. SSD cache went on to peak with 48,231 IOPS at a latency of 23.3ms. The top performer here was the Qtier starting with 5,599 IOPS at 201μs and staying under 1ms until about 12K IOPS and going on to peak at 55,721 IOPS with 36.3ms for latency.
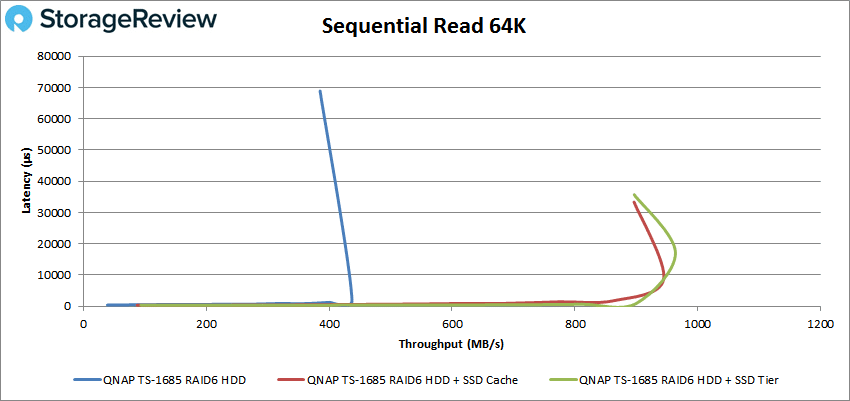
Switching over to sequential workloads, in the 64K read the standard performance began at 629 IOPS or 39MB/s with a latency of 398μs. Standard performance peaked at about 7K IOPS or about 437M/s at 2ms latency before dropping off in performance and spiking in latency. The SSD cache was the next highest performer starting at 1,402 IOPS or 87MB/s at 355.4μs and went on to peak at roughly 15K IOPS or 944MB/s at 8.6ms before dropping off. The Qtier was the top performer here starting at 1,498 IOPS or 94MB/s at 377μs for latency and was able to sustain sub-millisecond latency until about 14K IOPS. The Qtier peaked at just over 15K or 963MB/s with a latency of 17.2ms before dropping off.
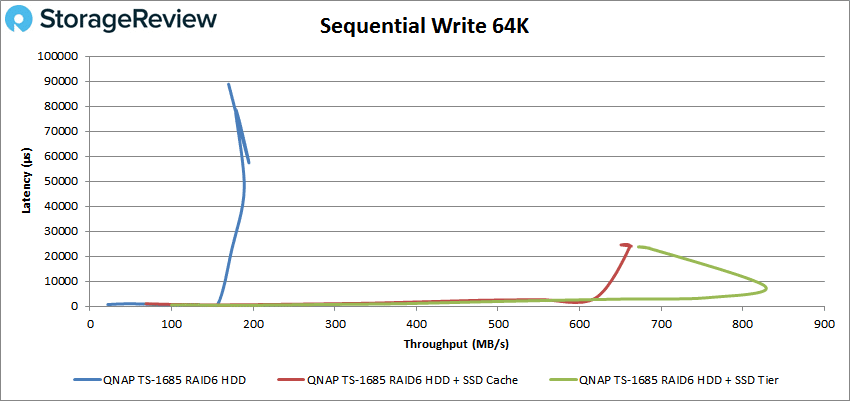
For 64K sequential write the standard started at 349 IOPS or 21.8MB/s at 729.8μs latency. The standard had sub-millisecond latency until about 2,500 IOPS or about 150MB/s and went on to peak at 3,116 IOPS or 194.7MB/s with a latency of 57.4ms. The SSD cache started at 1,098 IOPS or 68.6MB/s at a latency of 1.03ms. The cache went on to peak at 10,583 IOPS or 672MB/s at 23.8ms for latency. The Qtier started at 1,599 IOPS or 100MB/s at 571.8μs latency. It went on to peak at roughly 13,300 IOPS or 827MB/s at 8.1ms latency before dropping off.
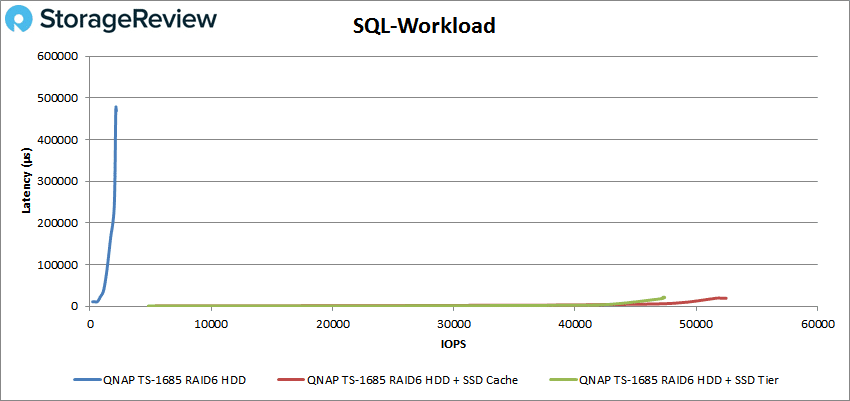
Next up is our SQL workloads. Here the standard started at 221 IOPS and 11.1ms latency and peaked at 2,141 IOPS at 478.7ms. Qtier started at 4,807 IOPS with 529.6μs latency and made it to about 19K IOPS under 1ms. The Qtier peaked at 47,398 IOPS with a latency of 21.6ms. The SSD cache started at 5,401 IOPS with 657.1μs latency and stayed under 1ms until about 16K IOPS. The SSD cache peaked at 52,465 IOPS and a latency of 19.5ms.
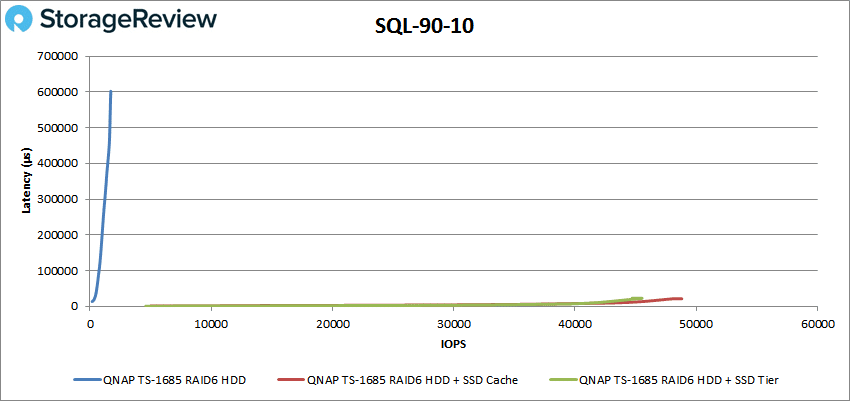
For SQL 90-10 the standard started at 180 IOPS with 13.4ms latency and peaked at 1,720 IOPS at 594ms latency. The Qtier started at 4,607 IOPS at 556.9μs latency and popped over 1ms at about 10K IOPS. The Qtier peaked at 45,528 IOPS at 22.5ms latency. The SSD cache started at 4,997 IOPS and 817.4μs latency and went on to peak at 48,808 IOPS with 21.1ms for latency.
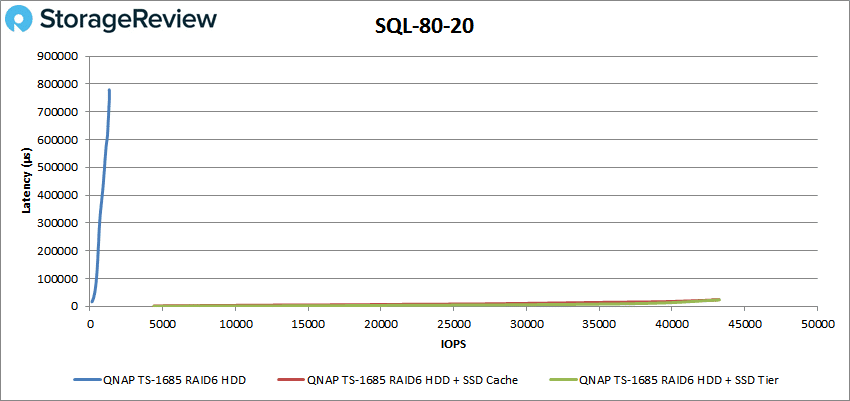
With SQL 80-20 the standard started at 139.7 IOPS at 16.3ms latency and peaked at 1,332 IOPS at 749.6ms latency. The SSD cache started at 4,399 IOPS at 1.53ms latency and peaked at 43,196 IOPS with 23.5ms latency. Qtier started at 4,391 IOPS with 574.7μs latency and went on to peak at 43,250 IOPS at 23.7ms latency.
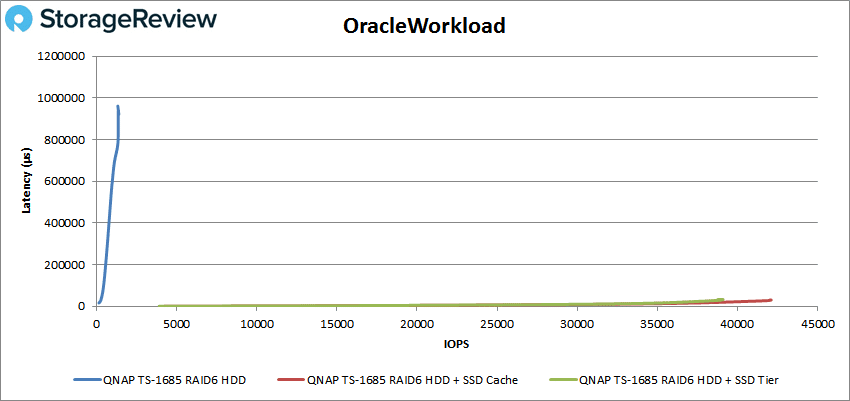
Our final batch of tests for this review is our Oracle workloads. Here the standard started at 139.8 IOPS at 16.1ms latency and peaked at 1,378 IOPS with 921ms for latency. Qtier started at 3,894 IOPS and 599.8μs latency and peaked at 39,101 IOPS with 32.7ms latency. The SSD cache started at 4,199 IOPS and 641.3μs latency and went on to peak at 42,100 IOPS with a latency of 30.4ms.
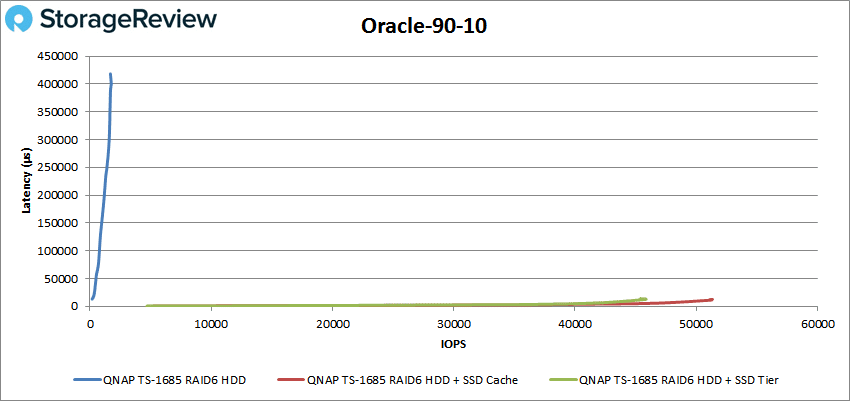
With Oracle 90-10 the standard started at 180.1 IOPS with a latency of 12.9ms and peaked at 1,757 IOPS with a latency of 400ms. The Qtier started at 4,696 IOPS and a latency of 556.7μs and peaked at roughly 46K IOPS with 12.6ms latency. The SSD cache started at 5,196 IOPS and 624.3μs latency and went on to peak at 51,340 IOPS at a latency of 12.6ms.
Our finale test is the Oracle 80-20 where the standard started at 140.4 IOPS and a latency of 16.1ms and peaked at 1,344 IOPS with 496ms latency. The Qtier started at 84,497 IOPS with 592μs going over 1ms at about 9K IOPS and going on to peak at 44,233 IOPS at a latency of 13.9ms. The SSD cache started at 4,697 IOPS with 904.1μs latency and peaked at 48,345 IOPs with 13ms for latency.

Conclusion
Flash has obvious performance benefits over spinning disks, but the later has a cost to capacity benefit over the former. Knowing that putting nothing but flash in a NAS is probably not something most organizations can do, QNAP offers to options for user to take full advantage of flash’s performance while still leveraging the capacity and value of HDDs. QNAP offers an SSD caching option to write to and read from the SSDs for faster performance for the hot data that is sent to flash. The company also offers a tiering option, named Qtier, that automatically moves data to the appropriate media depending on how often it is accessed.
For testing we looked at a standard of all HDDs in RAID6 as a benchmark. The standard performed as expected and is more of a comparison than delving too deep into how it performed again here. For our 4K random read testing turning on both the SSD cache and Qtier resulted in an over 60K IOPS performance with dramatically lower latency, over 1,700ms difference. In 4K read the SSD cache was slightly better in peak performance. Random 4K write showed the SSD cache with 44K IOPS over standard and the Qtier with over 51K IOPS over standard. For sequential workloads both the caching and tiering options showed over 500MB/s better performance versus standard with the Qtier being slightly better in 64K read. In 64K write the SSD cache ran about 470MB/s better than standard and the Qtier ran about 630MB/s better than standard.
For our synthetic database workloads we ran our SQL and Oracle workloads. With SQL the Qtier peaked 45K IOPS over standard and the SSD cache peaked 50K IOPS over standard. In SQL 90-10 Qtier peaked 43K IOPS over standard while the SSD cache peaked 46K IOPS over standard. SQL 80-20 saw the SSD cache peak about 42K IOPS over standard while Qtier peaked slightly higher but roughly the same. Looking at Oracle the Qtier peaked about 37K IOPS over standard while the SSD cache peaked about 40K IOPS over standard. Oracle 90-10 saw Qtier peak about 44K IOPS over standard and the SSD cache peaked nearly 50K IOPS over standard. And finally Oracle 80-20 saw the Qtier peak about 42K IOPS over standard while the SSD cache peaked about 46K IOPS over standard.
Overall both features performed as expected, and coupled with a few SSDs, helped to drive new levels of performance from the NAS. There were some benchmarks where one or the other would win out, but in either case, users will definitely see a big boost in performance leveraging one technology or the other. For organizations that aren’t quite ready for the all-flash datacenter just yet, QNAP offers a great alternative that requires no additional licensing, just a couple SSDs to get operational.


 Amazon