

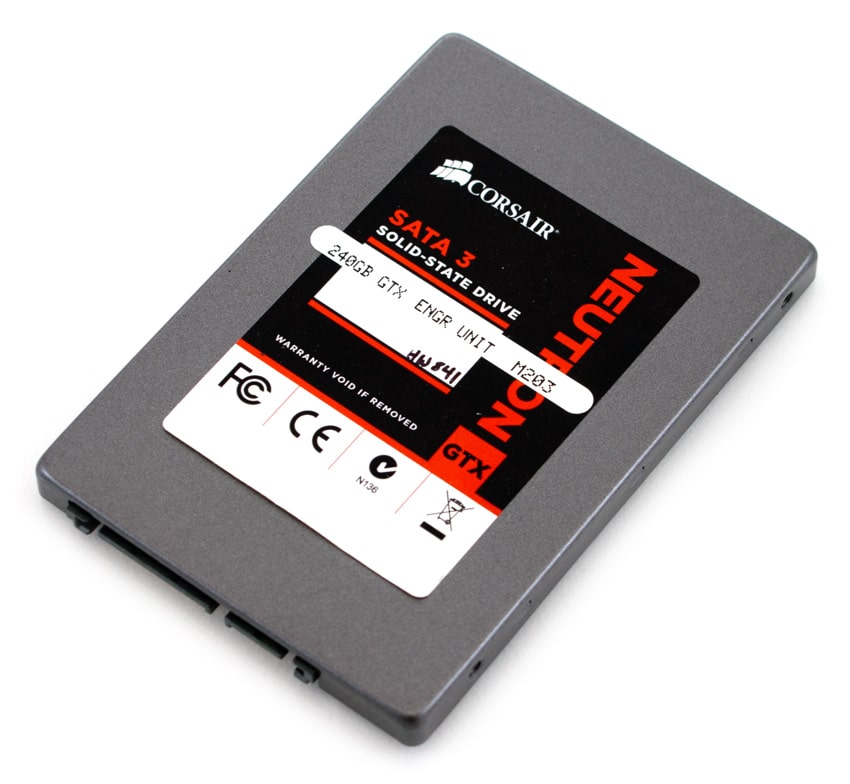
Corsair is nothing if not flexible when it comes to selecting the best available components for their consumer SSD lines seen with the new Neutron SSD family. Already using SSD controllers from SandForce and Marvell, Corsair has launched the Neutron and Neutron GTX today based on the Link A Media (LAMD) controller. Corsair’s ability to move with the market to create industry-leading SSDs highlights the benefit of investing in an engineering team with the capabilities of understanding and integrating with a variety of components. In this review we take a look at the GTX version of the Neutron, which features a LM87800 6Gb/s controller and 24nm Toshiba Toggle NAND to deliver read and write throughput of 559MB/s and 511MB/s respectively.
The center of attention inside the new Corsair Neutron family of SSDs is the Link A Media Devices LM87800 controller, which is claimed to reached I/O speeds of up to 90,000 IOPS read/write. For a newcomer to the over-saturated consumer SSD market, that level of performance is nothing to scoff at, which up until this point has been the realm of a select few SSDs. The LAMD LM87800 controller also comes packed with eBoost, a technology aimed at bringing enterprise-class NAND reliability and endurance to the client space with proprietary adaptive signal estimation and strong error correction technology. Similar to LSI SandForce controllers, the LAMD LM87800 supports variable over-provisioning and RAID/Chipkill technology to maintain performance in the event of a NAND failure. The controller supports 8 NAND channels, supporting ONFi 2.3 and Toggle flash, and scales up to a maximum capacity of 1TB.
The Corsair Neutron family is offered in two varieties, the standard and the GTX. The GTX which is the subject of this review, is clearly an enthusiast SSD, offering top-shelf performance for desktop and PC users who want the most out of the SATA interface. Users with their sights set on superior game load speeds, video/graphics editing and great response times while running multiple applications at once all stand to benefit from the GTX.
Currently the targeted capacities of this controller include 64GB, 128GB, 256GB, and 512GB SSDs using all available NAND types such as SLC, MLC, and eMLC. At this time the implementation Corsair is offering with the Neutron GTX uses MLC Toggle NAND in capacities of 120GB, 240GB, and 480GB.
The 7mm 2.5″ form factor is compatible with standard and ultra-thin notebooks and Corsair includes a 3.5″ mounting kit for desktop deployments.
Corsair Neutron GTX Specifications
- SSD Controller: Link A Media Devices (LAMD) LM87800 Controller
- Flash memory: Toshiba 24nm toggle NAND
- Interface: SATA III 6.0 Gb/s
- Capacities/Models:
- 120GB: CSSD-N120GBGTX-BK
- 240GB: CSSD-N240GBGTX-BK
- 480GB: CSSD-N480GBGTX-BK
- Operating Temperature: 0°C to +70°C
- Operating Humidity: 10% to 90% RH (0° to +40° C)
- MTBF: 2,000,000 hours
- Includes 3.5” Adapter
- Compatibility: Windows XP, Vista, 7; MacOS X (Lion), Windows 8 Beta
Design and Build
The Corsair Neutron GTX is designed to fit in almost every platform that is compatible with a 2.5″ or 3.5″ SATA drive. It ships standard in a 7mm 2.5-inch form factor, making it fit in notebooks and ultra-thin notebooks, and even desktops with an included 3.5-inch adapter plate. The SSD itself has a metal body, made up of a top and bottom cover that snap together without the use of screws.
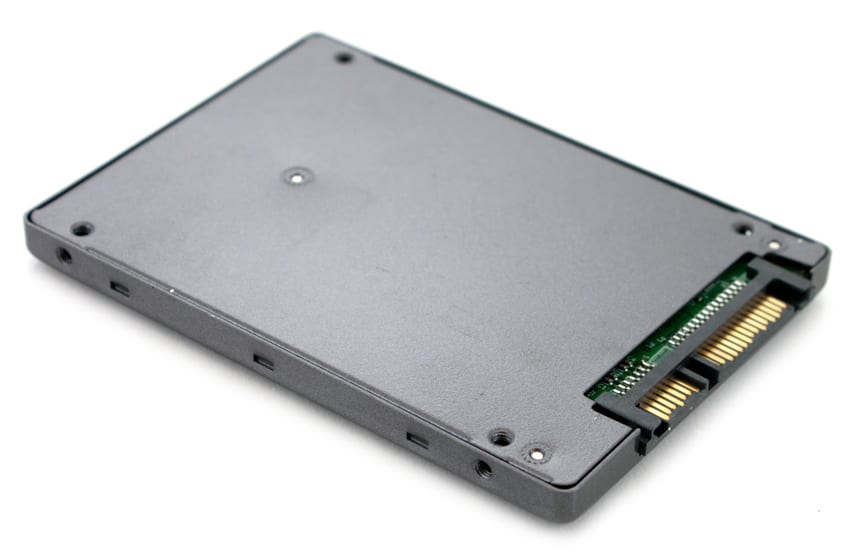
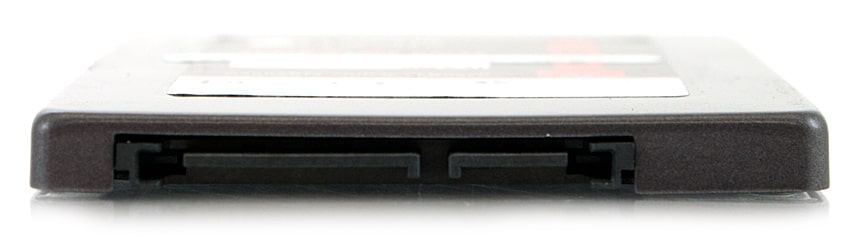
A view from the front shows the slim 7mm drive height, giving it almost universal compatibility with most computers on the market that don’t use a proprietary design. With its slim design it still retains the same side mounting holes to secure it in drive bays and the like. The front includes a standard SATA power and data connector, with no visible service pins.
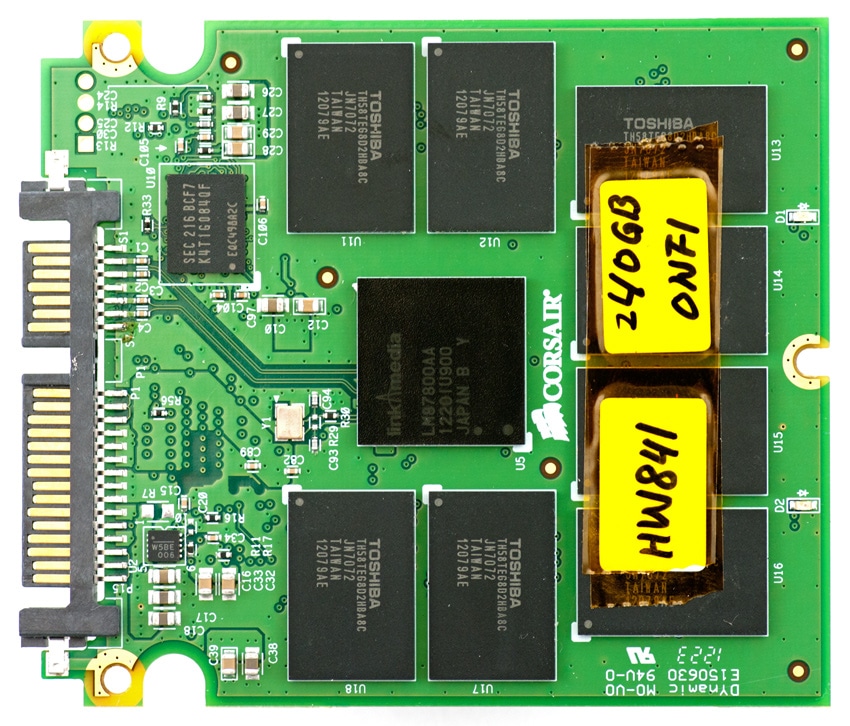
Opening up the Corsair Neutron GTX isn’t a walk in the park with the snap together sides, and by doing so you also void your warranty. Using a small plastic wedge you are able to carefully pry the case apart at the edges. Once open the small circuit board inside is visible, showing the bottom view with NAND and RAM visible.
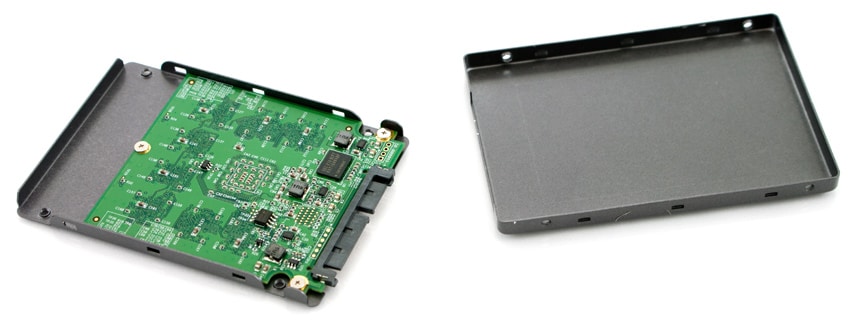
After unscrewing the circuit board from the bottom plate, you have you slowly peel the two sections apart as a small thermal pad on the controller causes the two to stick together. After that is removed the Link A Media Devices LM87800 controller is visible.
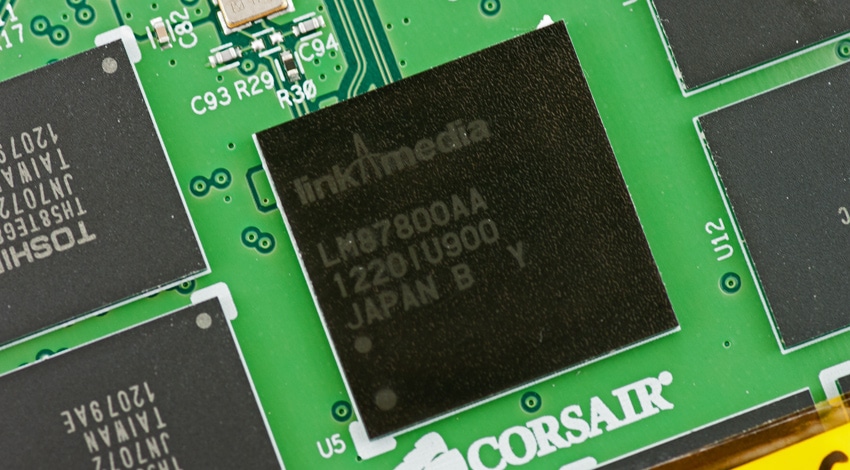
The Corsair Neutron GTX is comprised of Toshiba MLC Toggle NAND, 256MB of DDR2 RAM, and the LAMD controller.
The standard Neutron-series SSD has the same layout, although the flash is swapped with synchronous MLC NAND. A similar comparison could be made between the Corsair Force GS and the Corsair Force GT.
Consumer Synthetic Benchmarks
The Corsair Neutron GTX uses Toshiba’s 25nm Toggle MLC NAND, a LAMD LM87800 controller and a 6.0Gb/s SATA interface; our review unit is 240GB. The comparables used for this review include the following recently reviewed SSDs: Intel SSD 520 (240GB, SandForce SF-2281, Intel 25nm NAND, SATA), OCZ Vertex 3 MAX IOPS (240GB, SandForce SF-2281, Toshiba 32nm MLC NAND, SATA), Plextor PX-M5S (256GB, Marvell 9174, Micron 25nm MLC NAND, SATA), the Samsung 830 (256GB, Samsung 3-core MCX controller, Samsung 2x nm Toggle NAND Flash, SATA), and the OCZ Vertex 4 (512GB, Indilinx Everest 2, Intel 25nm MLC NAND, SATA), and the Kingston HyperX SSD (240GB, SandForce SF-2281, Intel 25nm NAND, SATA). All IOMeter figures are represented as binary figures for MB/s speeds. For our consumer benchmarks, all SSDs were tested on our client testing platform.
For the past month, we have been working closely with Corsair providing performance feedback on the Neutron GTX. As the label below hints towards, we worked through firmware version M203 to the shipping version M206 over this period of time. While this is an early production sample, the hardware configuration remains the same, with our formal performance analysis centering around the production version of firmware that will ship with the Neutron GTX.
Corsair advertises speeds of up to 559MB/s read and 511MB/s write in sequential transfers. Our first test is designed to test exactly that, using IOMeter with a 2MB sequential transfer.
In our sequential transfer test, we measured speeds of 464MB/s read and 466MB/s write with incompressible data from the Neutron GTX, which puts it in the middle of the pack in read speed and at the top of the pack in write speed.
Our next test keeps the 2MB transfer size, but this time checks random transfer speeds.
The Corsair Neutron GTX maintained the highest write speeds in the pack, measuring 466MB/s write, and came in the middle with 463MB/s read.
In our next test we measure low queue depth random 4K read and write performance.
At a queue depth of 1, the Corsair Neutron GTX slips towards the back of the pack in both read and write speeds, but not exactly by a large margin.
While the previous test looked just at QD=1 performance, our next section scales queue depth between 1 to 64, showing how well the drive reacts to an increased load.
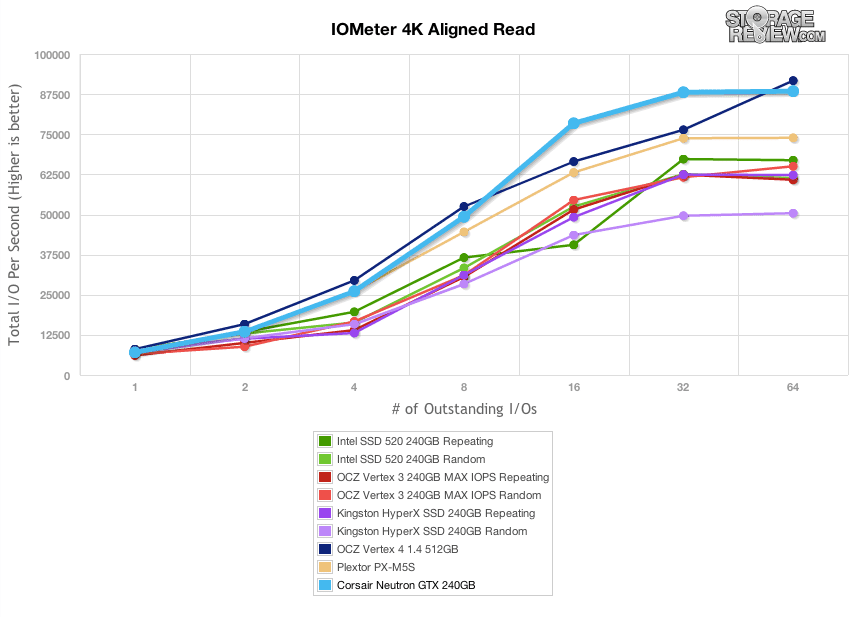
In a random 4K read setting, the Corsair Neutron GTX jumped towards the top of the pack at queue depths above 2, offered the highest random read speeds between QD16 and QD32, and fell in just behind the OCZ Vertex 4 at QD64.
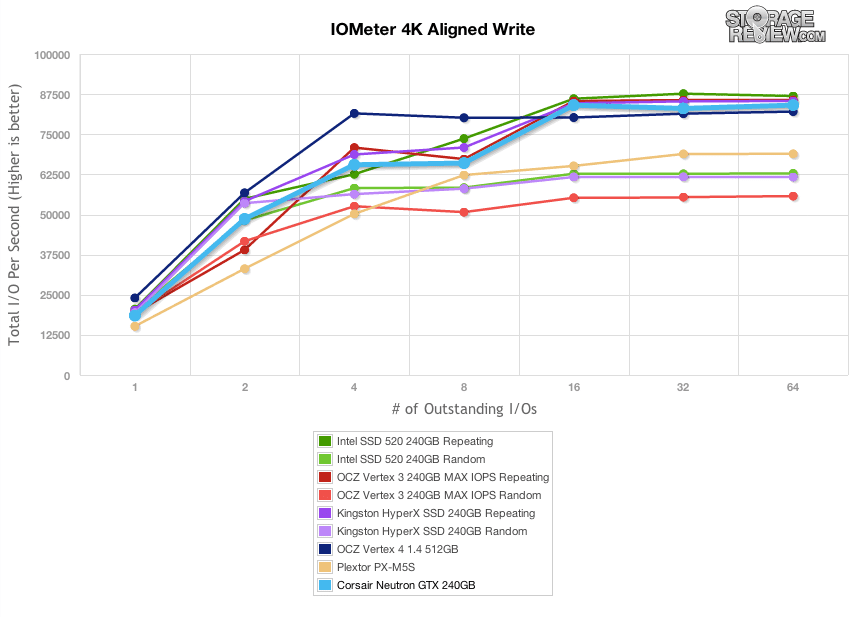
Measuring random 4K write performance, the Neutron GTX came in towards the middle of the pack at lower queue depths, but stayed at the top of the group with incompressible data, which speed was only matched by the SandForce-powered SSDs with compressible data.
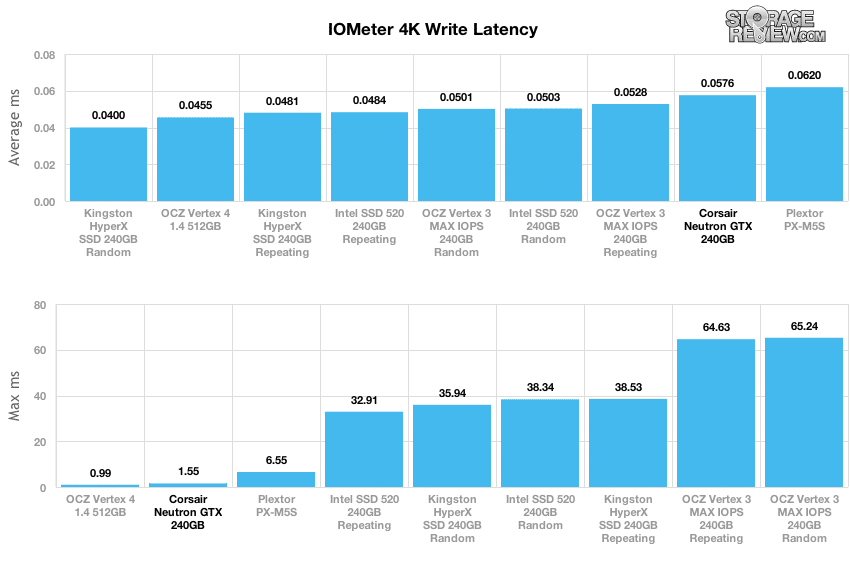
Expanding our QD1 4K test, we look at write latency of each SSD. Lower numbers are better, since it means less wait time for activity to process. Max latency is also important, although that number can change as the NAND wears over time. The Neutron GTX came in with latency at the bottom of this group of SSDs with its weaker low queue depth write performance. We measured an average latency of 0.0576ms from the GTX with an excellent peak latency of 1.55ms.
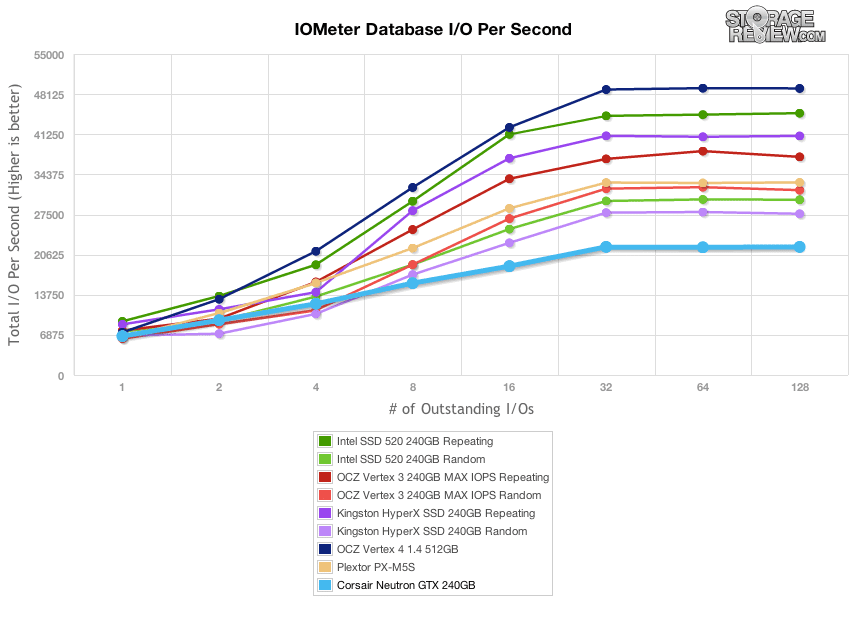
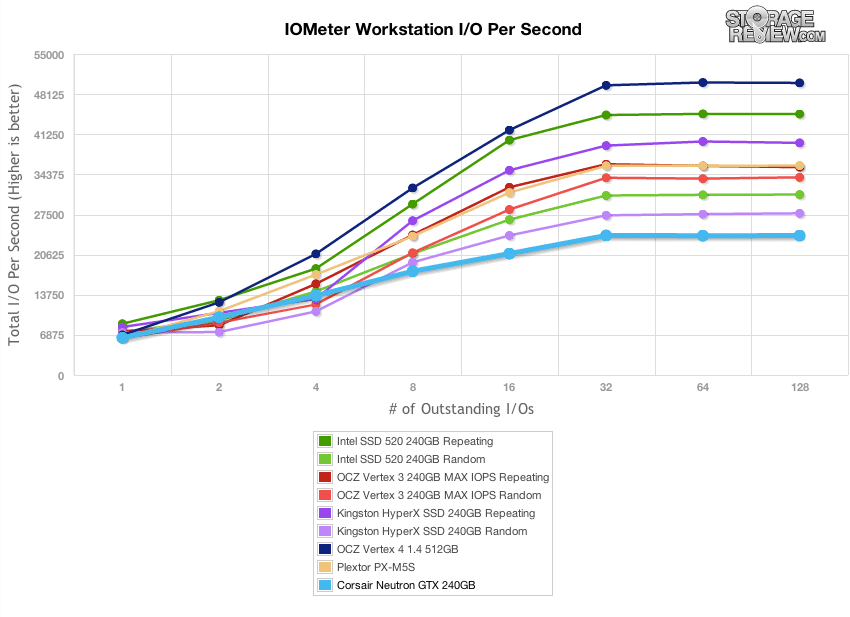
Our last series of synthetic benchmarks compare the hard drives in a series of server mixed-workloads with a queue depth of ranging from 1 to 128. Each of our server profile tests has a strong preference towards read activity, ranging from 67% read with our database profile to 100% read in our web server profile. In burst conditions the Neutron GTX came in towards the bottom of the pack in workloads with both read and write activity, but scored fairly well when it came to the read-only Web Server workload.
The first is our database profile, with a 67% read and 33% write workload mix primarily centered on 8K transfer sizes.
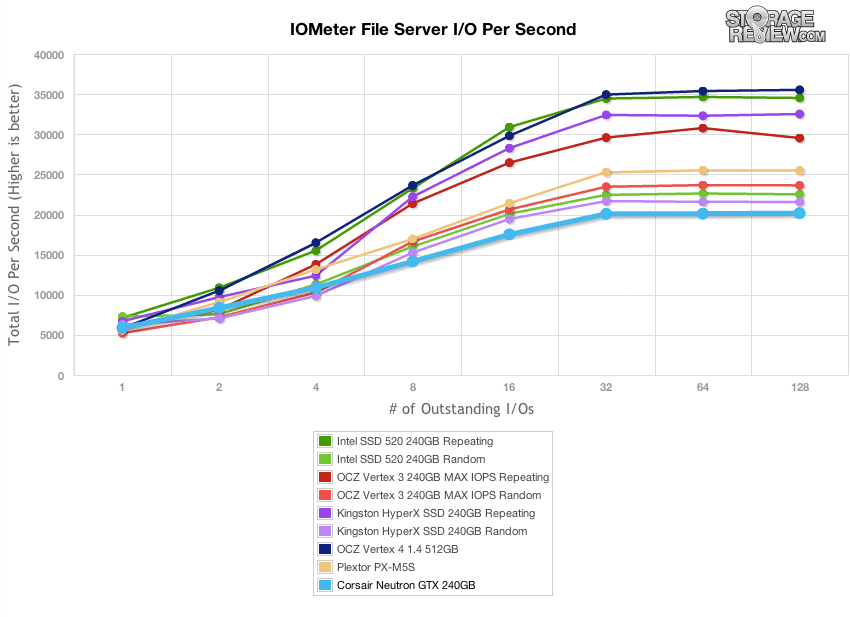
The next profile looks at a file server, with 80% read and 20% write workload spread out over multiple transfer sizes ranging from 512-byte to 64KB.
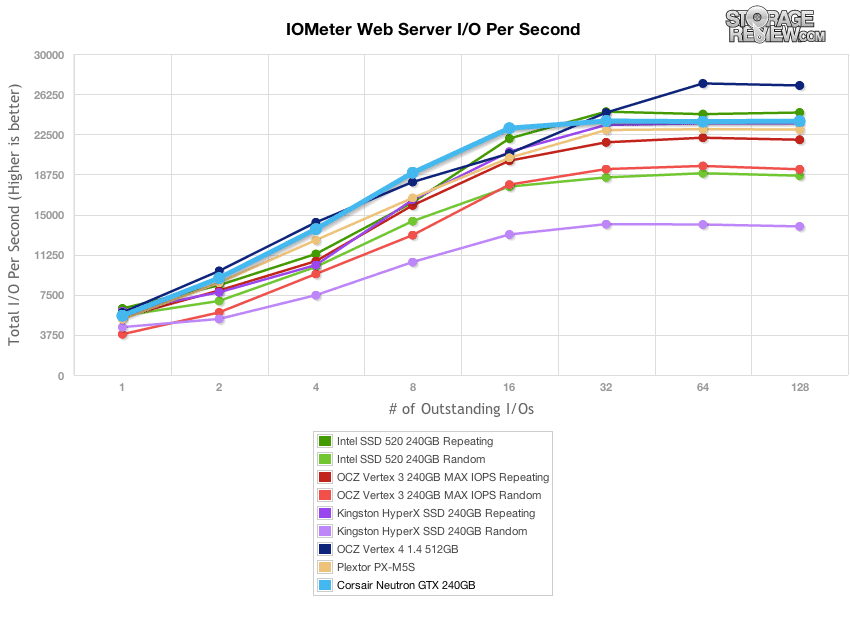
Our web server profile is read-only with a spread of transfer sizes from 512-byte to 512KB.
The last profile looks at a workstation, with a 20% write and 80% read mixture using 8K transfers.
Consumer Real-World Benchmarks
For the average consumer, trying to translate random 4K write speeds into an everyday situation is pretty difficult. It helps when comparing drives in every setting possible, but it doesn’t exactly work out into faster everyday usage or better game loading times. For this reason we turned to our StorageMark 2010 traces, which include HTPC, Productivity, and Gaming traces to help readers find out how a drive might rank under their conditions.
The first real-life test is our HTPC scenario. In this test we include: playing one 720P HD movie in Media Player Classic, one 480P SD movie playing in VLC, three movies downloading simultaneously through iTunes, and one 1080i HDTV stream being recorded through Windows Media Center over a 15 minute period. Higher IOps and MB/s rates with lower latency times are preferred. In this trace we recorded 2,986MB being written to the drive and 1,924MB being read. Our second real-life test covers disk activity in a productivity scenario. For all intents and purposes this test shows drive performance under normal daily activity for most users. This test includes: a three hour period operating in an office productivity environment with 32-bit Vista running Outlook 2007 connected to an Exchange server, web browsing using Chrome and IE8, editing files within Office 2007, viewing PDFs in Adobe Reader, and an hour of local music playback with two hours of additional online music via Pandora. In this trace we recorded 4,830MB being written to the drive and 2,758MB being read.
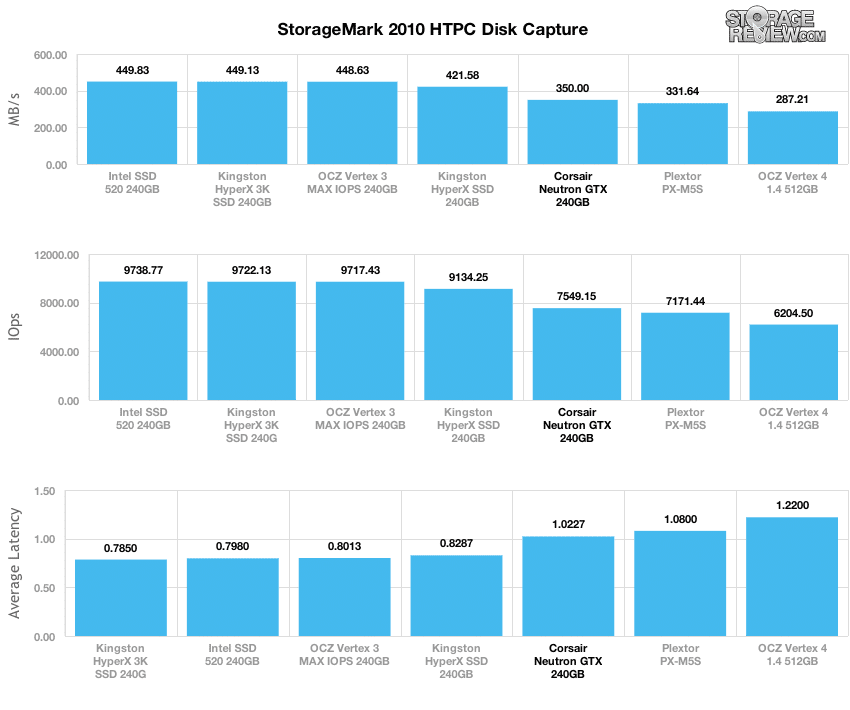
In our HTPC trace, the Corsair Neutron came in just below the SandForce powered SSDs, with an average transfer speed of 350MB/s.
Our second real-life test covers disk activity in a productivity scenario. For all intents and purposes this test shows drive performance under normal daily activity for most users. This test includes: a three hour period operating in an office productivity environment with 32-bit Vista running Outlook 2007 connected to an Exchange server, web browsing using Chrome and IE8, editing files within Office 2007, viewing PDFs in Adobe Reader, and an hour of local music playback with two hours of additional online music via Pandora. In this trace we recorded 4,830MB being written to the drive and 2,758MB being read.
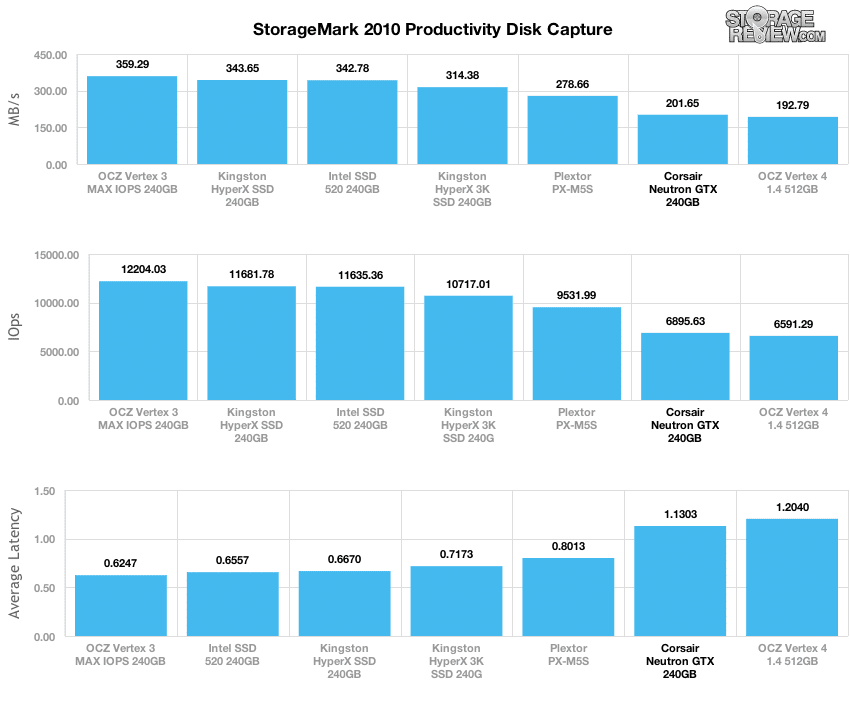
In our Productivity trace, the Neutron GTX came in at the back of the group, but above the Vertex 4 with a speed of 201MB/s.
Our third real-life test covers disk activity in a gaming environment. Unlike the HTPC or Productivity trace, this one relies heavily on the read performance of a drive. To give a simple breakdown of read/write percentages, the HTPC test is 64% write, 36% read, the Productivity test is 59% write and 41% read, while the gaming trace is 6% write and 94% read. The test consists of a Windows 7 Ultimate 64-bit system pre-configured with Steam, with Grand Theft Auto 4, Left 4 Dead 2, and Mass Effect 2 already downloaded and installed. The trace captures the heavy read activity of each game loading from the start, as well as textures as the game progresses. In this trace we recorded 426MB being written to the drive and 7,235MB being read.
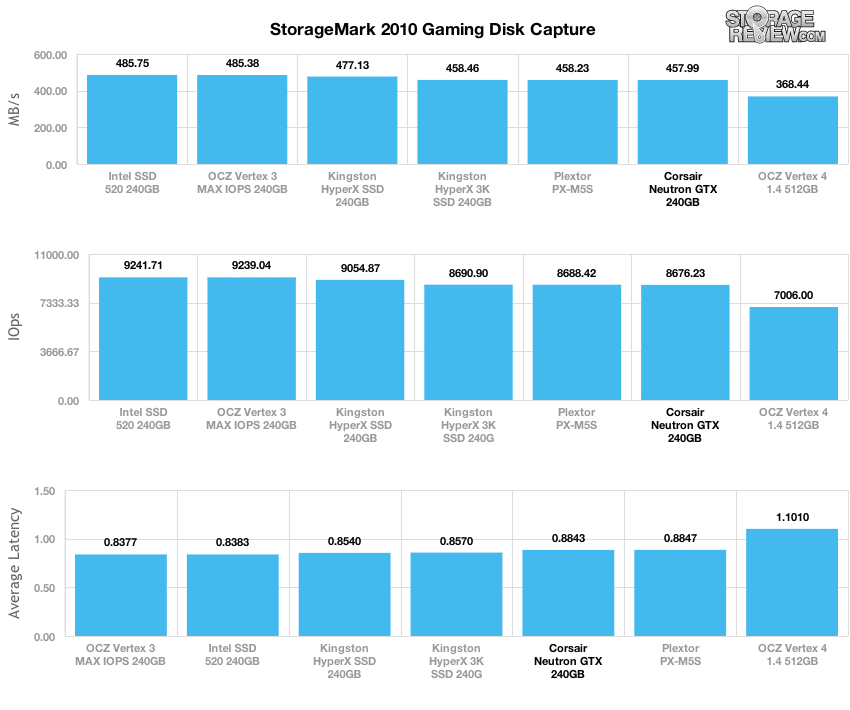
In our read-heavy Gaming trace, the Corsair Neutron GTX slipped behind the SandForce-powered SSDs, but still retained a solid average speed of 457MB/s.
Enterprise Testing
When evaluating high-end consumer storage, we now apply enterprise level testing, as often these types of drives are found within large enterprise arrays that have found ways to manage the life of MLC NAND, typically found within consumer SSDs. We offer the same hardware and infrastructure found in many datacenters where the devices we test would ultimately be destined for. This includes enterprise servers as well as proper infrastructure equipment like networking, rack space, power conditioning/monitoring, and same-class comparable hardware to properly evaluate how a device performs. None of our reviews are paid for or controlled by the manufacturer of the equipment we are testing; with relevant comparables picked at our discretion from products we have in our lab.
When any new drive comes to market, we like to put it through our enterprise workloads, since above all else they show how it performs under the worst conditions possible. It also gives us an opportunity to get a sneak peek at what might be in store for the enterprise version of the SSD, which generally lag behind the consumer models, using the same controller although frequently using higher grade NAND and increased over-provisioning.
Compared to our consumer tests, which took the optimized capacity for each particular SSD, for our enterprise workload we picked each sample so that they matched with 256GB of raw NAND. Depending on the stock configuration that usable capacity may differ, but this shows all drives in an equal light as shipped from the manufacturer at this capacity point.
StorageReview Enterprise Testing Platform:
- 2 x Intel Xeon X5650 (2.66GHz, 12MB Cache)
- Windows Server 2008 Standard Edition R2 SP1 64-Bit and CentOS 6.2 64-Bit
- Intel 5500+ ICH10R Chipset
- Memory – 8GB (2 x 4GB) 1333Mhz DDR3 Registered RDIMMs
Review Comparables:
Corsair Force GS
- NAND Type: Toggle MLC
- Controller: LSI SandForce SF-2281
- Capacity: 240GB
Corsair Force GT
- NAND Type: Synchronous MLC
- Controller: LSI SandForce SF-2281
- Capacity: 240GB
Corsair Neutron GTX
- NAND Type: Toggle MLC
- Controller: Link A Media Devices LM87800
- Capacity: 240GB
Plextor M5S
- NAND Type: Synchronous MLC
- Controller: Marvell 9174
- Capacity: 256GB
Samsung SSD 830
- NAND Type: Toggle MLC
- Controller: Samsung 3-core MCX
- Capacity: 256GB
OCZ Vertex 4
- NAND Type: Toggle MLC
- Controller: Indlilinx Everest 2
- Capacity: 256GB
Enterprise Synthetic Workload Analysis (Stock Settings)
The way we look at flash storage solutions dives deeper than just looking at traditional burst or steady-state performance. When looking at averaged performance over a long period of time, you lose sight of the details behind how the device performs over that entire period. Since flash performance varies greatly as time goes on, our new benchmarking process analyzes the performance in areas including total throughput, average latency, peak latency, and standard deviation over the entire preconditioning phase of each device. With high-end enterprise products, latency is often more important than throughput. For this reason we go to great lengths to show the full performance characteristics of each device we put through our Enterprise Test Lab.
All devices tested go under the same testing policy from start to finish. Currently, for each individual workload, devices are secure erased using the tools supplied by the vendor, preconditioned into steady-state with the identical workload the device will be tested with under heavy load of 16 threads with an outstanding queue of 16 per thread, and then tested in set intervals in multiple thread/queue depth profiles to show performance under light and heavy usage. For tests with 100% read activity, preconditioning is with the same workload, although flipped to 100% write.
Preconditioning and Primary Steady-State Tests:
- Throughput (Read+Write IOPS Aggregate)
- Average Latency (Read+Write Latency Averaged Together)
- Max Latency (Peak Read or Write Latency)
- Latency Standard Deviation (Read+Write Standard Deviation Averaged Together)
At this time Enterprise Synthetic Workload Analysis includes four common profiles, which can attempt to reflect real-world activity. These were picked to have some similarity with our past benchmarks, as well as a common ground for comparing against widely published values such as max 4K read and write speed, as well as 8K 70/30 commonly used for enterprise drives. We also included two legacy mixed workloads, including the traditional File Server and Webserver offering a wide mix of transfer sizes. These last two will be phased out with application benchmarks in those categories as those are introduced on our site, and replaced with new synthetic workloads.
- 4K
- 100% Read or 100% Write
- 100% 4K
- 8K 70/30
- 70% Read, 30% Write
- 100% 8K
- File Server
- 80% Read, 20% Write
- 10% 512b, 5% 1k, 5% 2k, 60% 4k, 2% 8k, 4% 16k, 4% 32k, 10% 64k
- Webserver
- 100% Read
- 22% 512b, 15% 1k, 8% 2k, 23% 4k, 15% 8k, 2% 16k, 6% 32k, 7% 64k, 1% 128k, 1% 512k
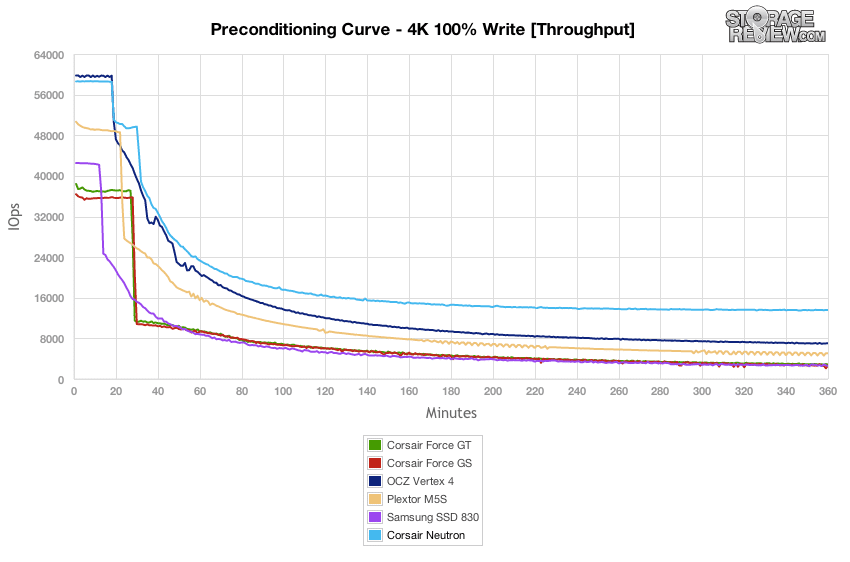
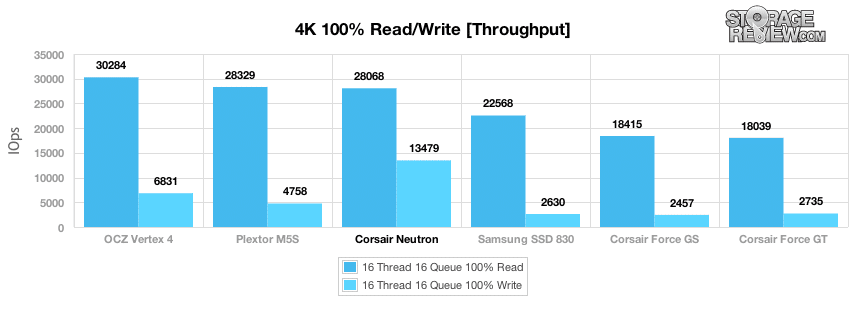
Looking at 100% 4K write activity under a heavy load of 16 threads and 16 queue over a 6 hour period, the Corsair Neutron GTX dominated the group, having almost triple the speed of the LSI SandForce models of the same capacity, and had a healthy lead over the Plextor MS5 and OCZ Vertex 4.
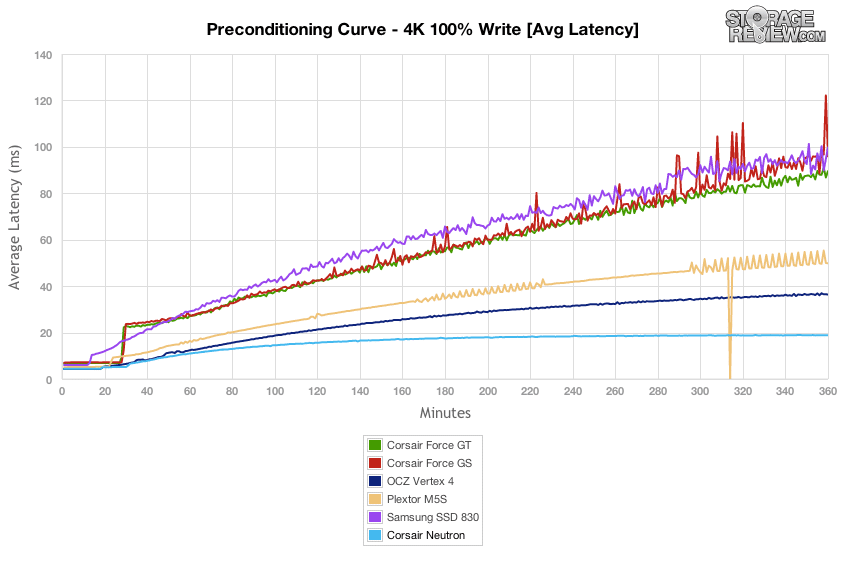
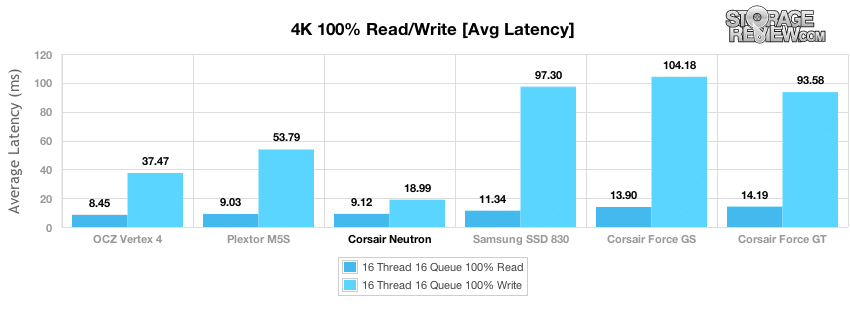
Average write latency stayed relatively calm for the Neutron GTX in our 4K 100% write workload, with the Vertex 4 acting in the same manner, but a step higher. The Plextor M5S and SandForce-powered SSDs significantly increased their average latency as they neared stead-state.
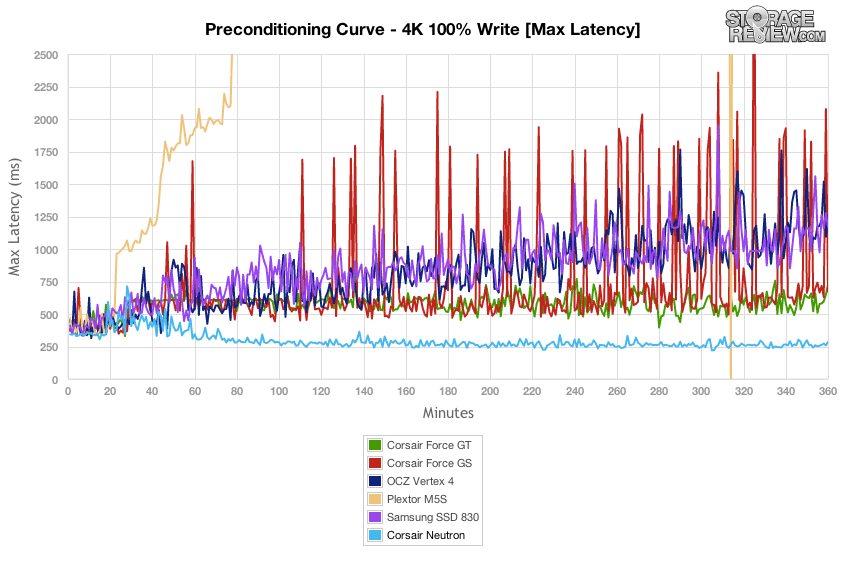
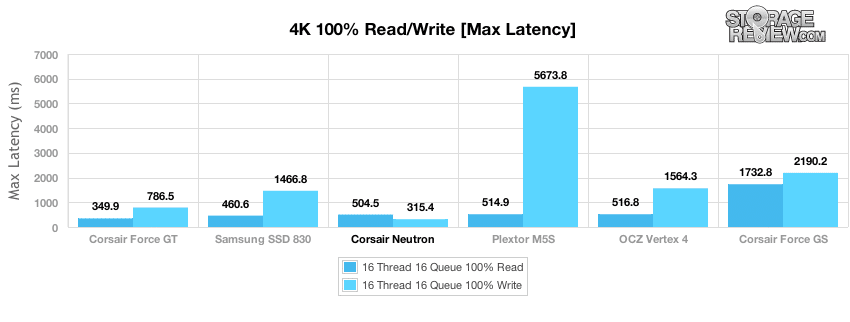
Looking at max latency, the Neutron GTX performed significantly better than the rest of the group, with the Plextor M5S getting its latency out of controller to a degree that took it off our charts.
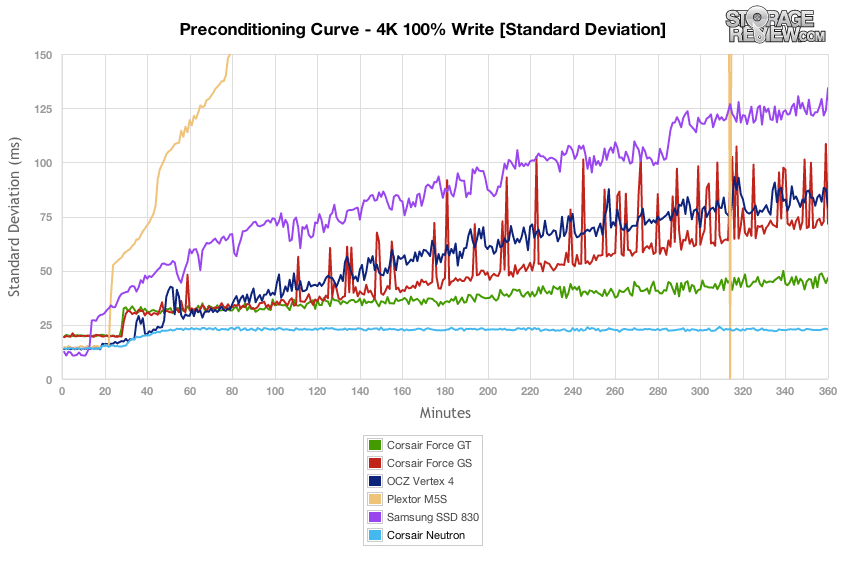
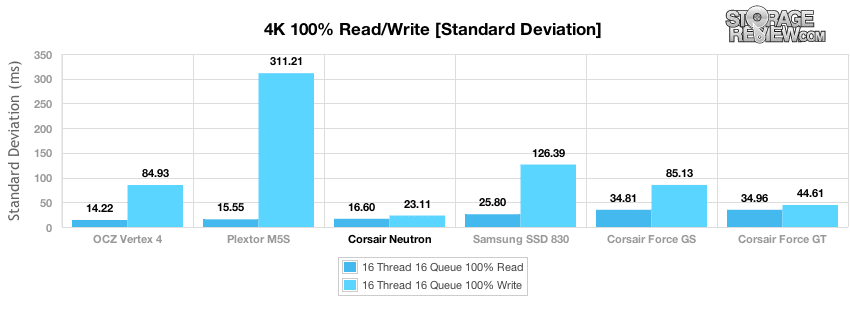
The standard deviation of the Corsair Neutron GTX in our 4K write workload showed that latency remained relatively consistent over the duration of the test, after slowly increasing at the beginning.
After the preconditioning process had ended, we took a longer sample interval to measure the final speeds of each SSD. Looking at write speed, the Corsair Neutron GTX had double the performance of the closest drive (OCZ Vertex 4) and had nearly 5x the speed of the fastest LSI SandForce powered consumer SSD. When it came to read speeds, the Corsair Neutron came in towards the middle of the pack, right under the OCZ Vertex 4 and Plextor M5S.
Average 4K write latency when each consumer SSD came into steady-state showed the Neutron GTX remained cool under pressure, with an average latency of 18.99ms, compared to 37.47-104.18ms from the rest of the pack.
Max latency measurements had the Corsair Neutron GTX staying the most responsive over the sample interval, with the worst-case example being the Plextor M5S which had a peak response time of 5.6 seconds.
While max latency shows the highest response time over the duration of the test, standard deviation shows how consistent the latency was over the duration of the test. Out of the group, the Corsair Neutron GTX had by far the most consistent 4K write latency, and ranked average in 4K read latency.
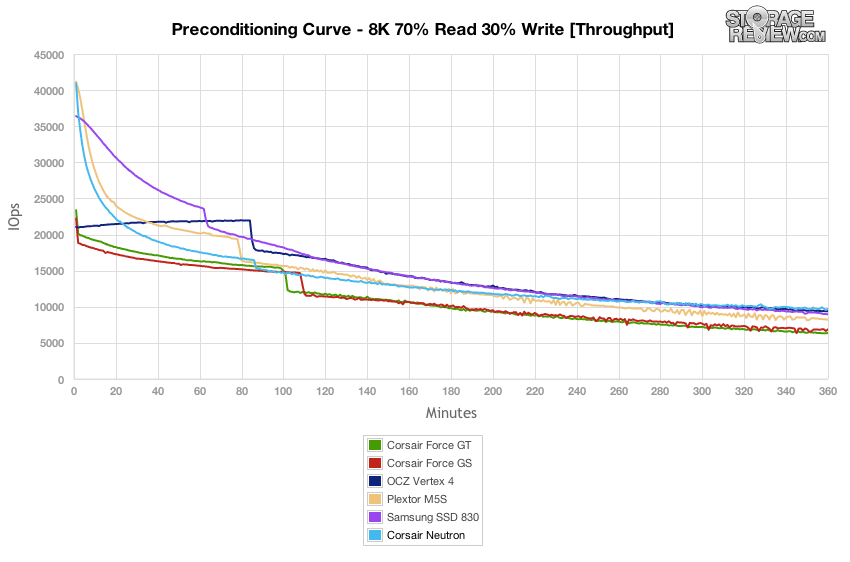
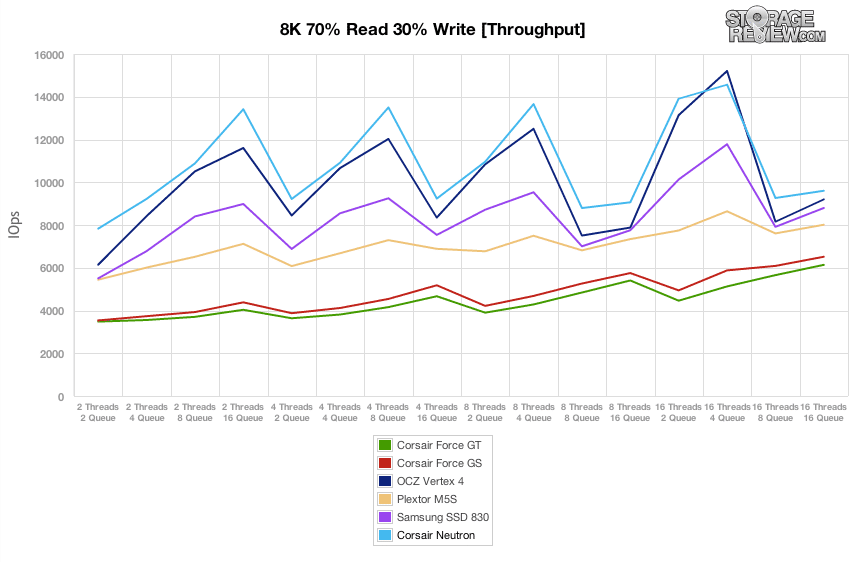
The next preconditioning test works with a more realistic read/write workload spread, versus the 100% write activity in our 4K test. Here, we have a 70% read and 30% write mix of 8K transfers. Looking at our 8K 70/30 mixed workload under a heavy load of 16 threads and 16 queue over a 6 hour period the Corsair Neutron started off with one of the highest burst-transfer speeds, which then tapered off with a small lead over the Samsung SSD 830 and the OCZ Vertex 4.
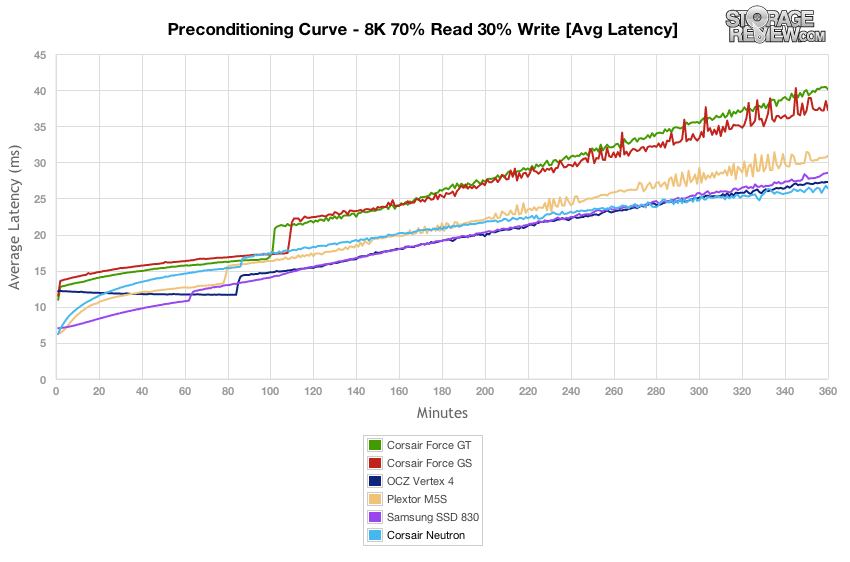
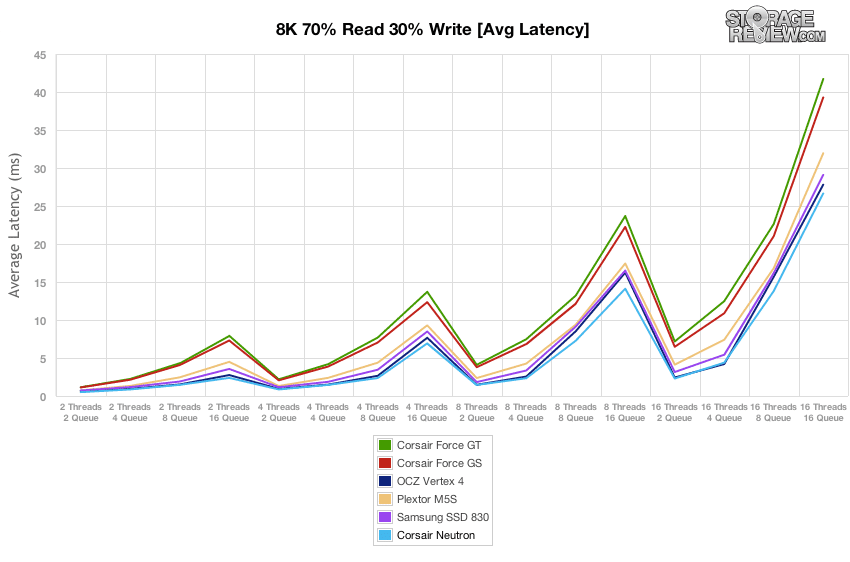
Turning towards average latency you can see the close race between the Corsair Neutron GTX, Samsung SSD 830, and OCZ Vertex 4 before the Neutron GTX takes the lead.
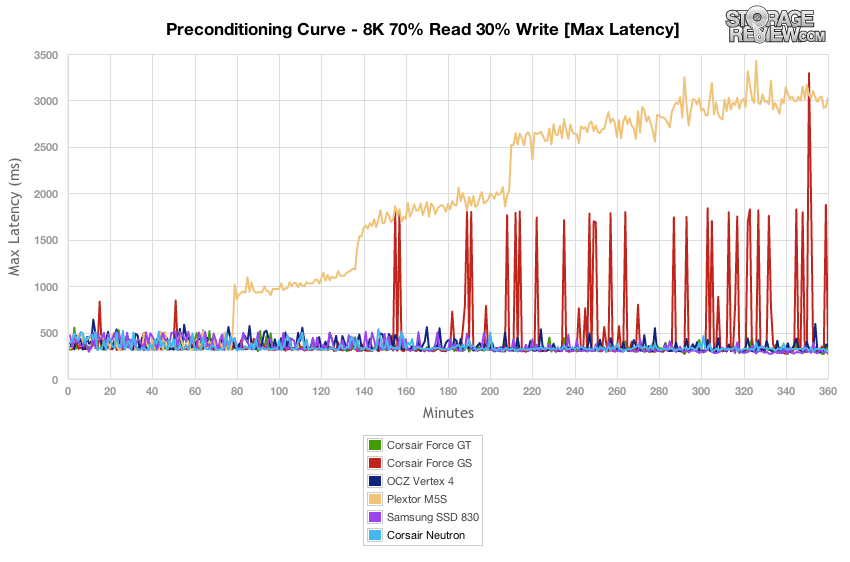
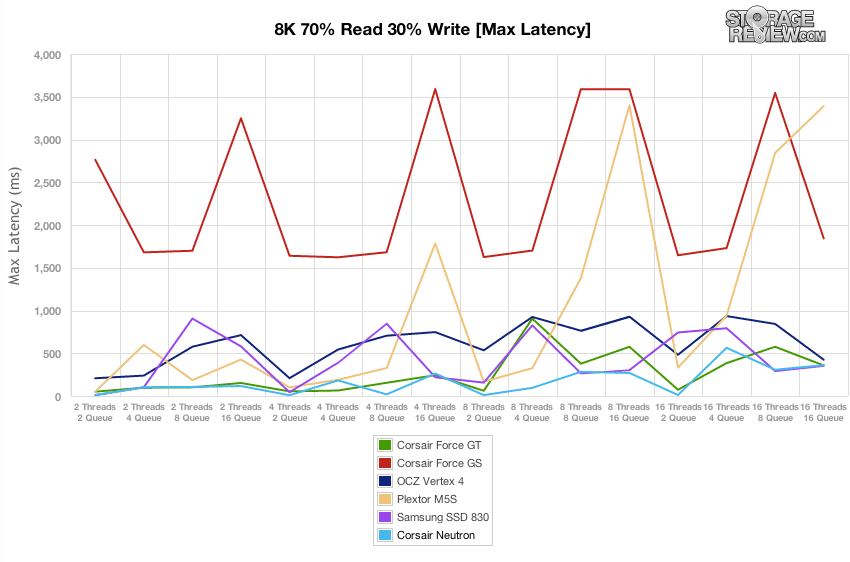
Max latency for all but the Plextor M5S stayed in the range of under 500ms, except for blips the Corsair Force GS started making as the drive neared steady-state. The Plextor M5S was in a category of its own though, which each progression into steady-state met with an ever increasing response rate.
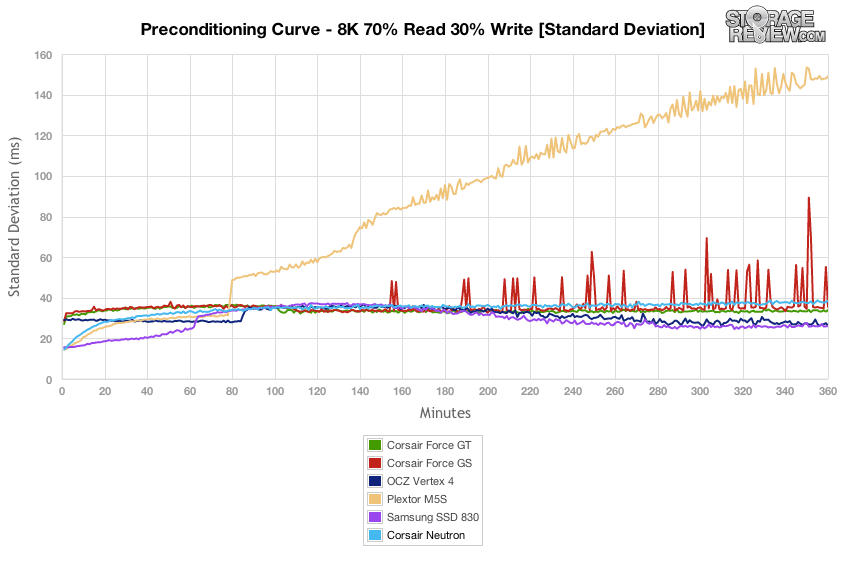
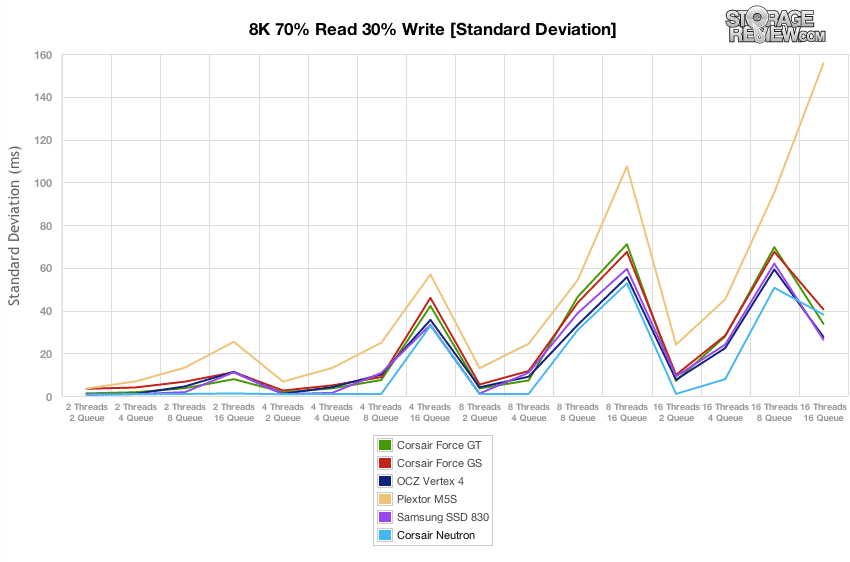
While max latency shows the worst single response times per interval, standard deviation lets you analyze how spread out or tightly packed the values we over the given intervals. In other words it lets you sort out one time occurrences from repeating activity. The Corsair Neutron came in towards the middle, although it had one of the flatted lines out of the group. The Plextor M5S drastically started to get more unresponsive from the early stages in our test, making some of the blips on the Force GS look tame by comparison.
Compared to the fixed 16 thread, 16 queue max workload we performed in the 100% 4K write test, our mixed workload profiles scale the performance across a wide range of thread/queue combinations. In these tests we span our workload intensity from 2 threads and 2 queue up to 16 threads and 16 queue. While the Corsair Neutron GTX didn’t appear to have the best performance off the line in our consumer workloads, when put in an enterprise environment it led the pack. The OCZ Vertex 4 closely trailed behind it, showing a similar scaling of throughput as the thread and queue depth increased.
The Corsair Neutron GTX managed itself very well when it came to latency in our 8K 70/30 primary workload, with the Vertex 4 trailing closely behind it. What was interesting is how far the SandForce-powered models lagged behind, with average response times losing ground as the load increased.
Looking at max latency in our varying load 8K 70/30 workload, the Force GS was the outlier with much higher peak response times out of the bunch. the Neutron GTX stayed towards the bottom with the lowest peak spikes.
Comparing latency standard deviation from the group in our 8K 70/30 workloads from 2T/2Q to 16T/16Q, the Neutron GTX had to most consistent performance in the bulk of the loads, slipping slightly at 16T/16Q.
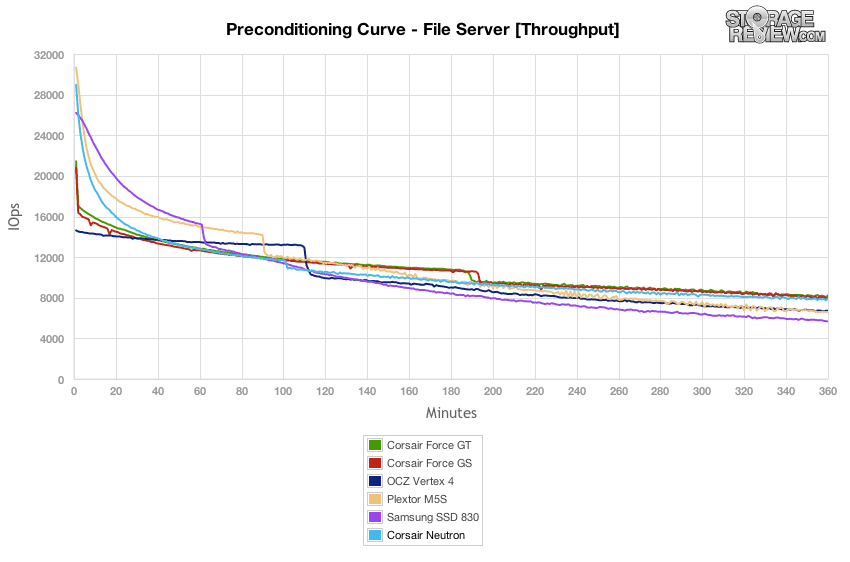
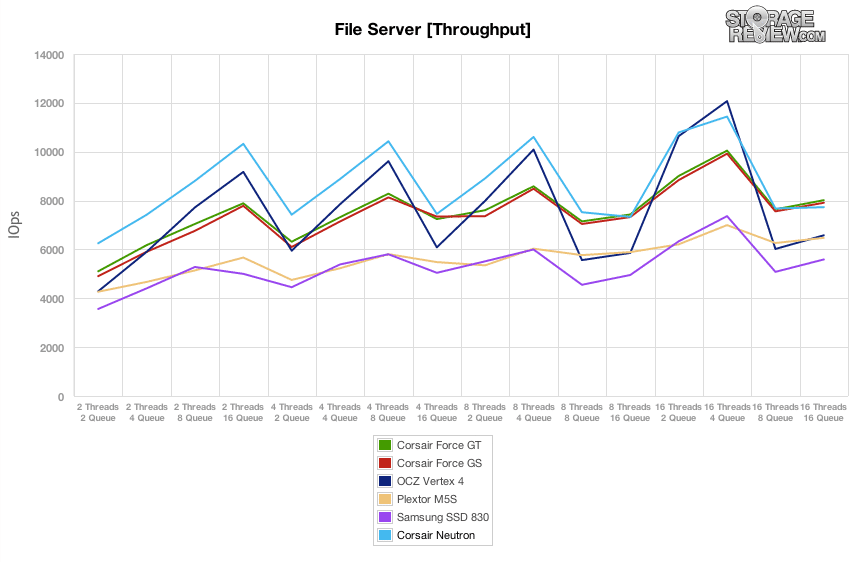
The File Server workload represents a larger transfer-size spectrum hitting each particular device, so instead of settling in for a static 4k or 8k workload, the drive must cope with requests ranging from 512b to 64K. In our File Server throughput test, the Corsair Neutron GTX trailed behind the Force GS and Force GT which led this particular workload.
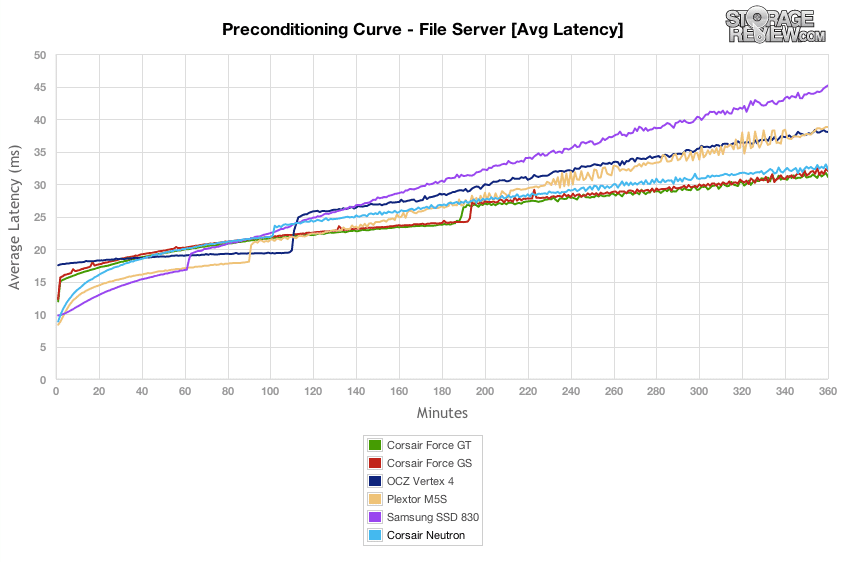
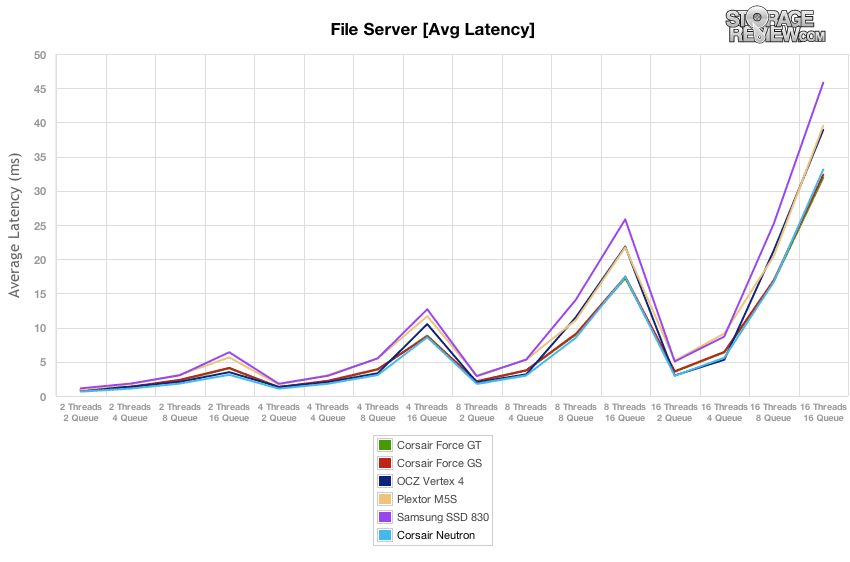
Looking at average latency, you can see the Force GT and Force GS holding onto the lead, with the Neutron GTX just behind them.
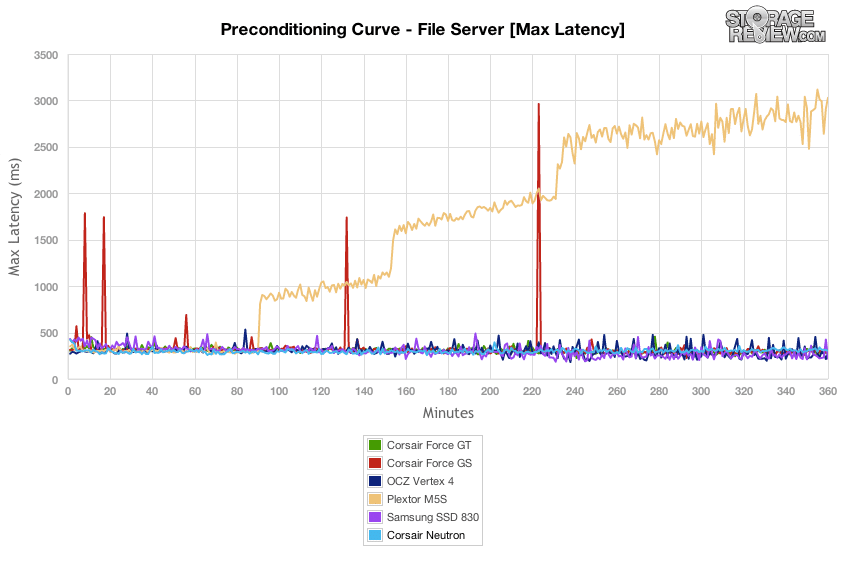
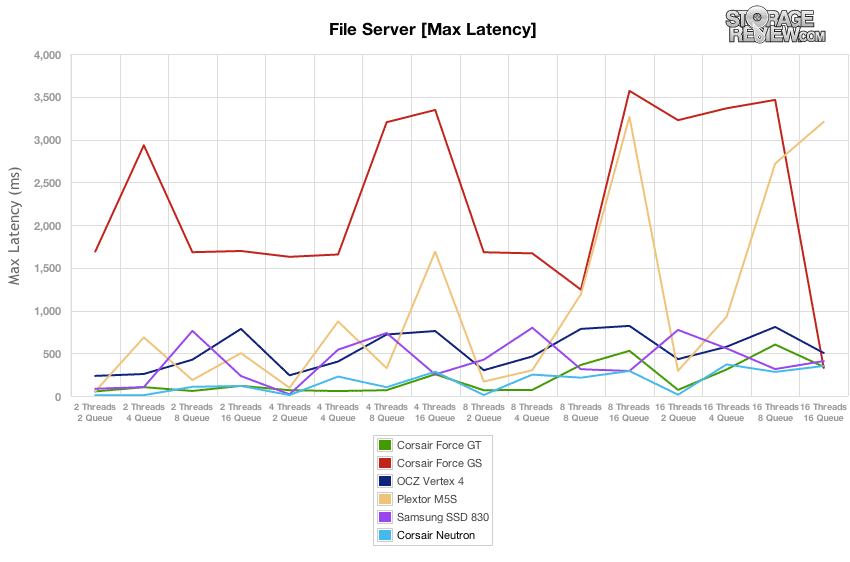
Max latency from this group of consumer SSDs as fairly close together, with the Plextor M5S losing its responsiveness as the test went on. The Neutron GTX remained fairly stable with its peaks staying below 500ms.
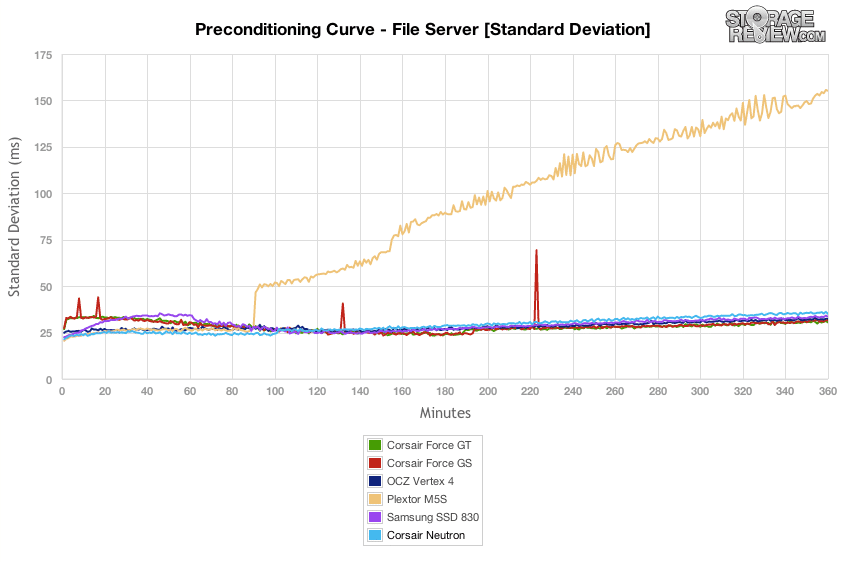
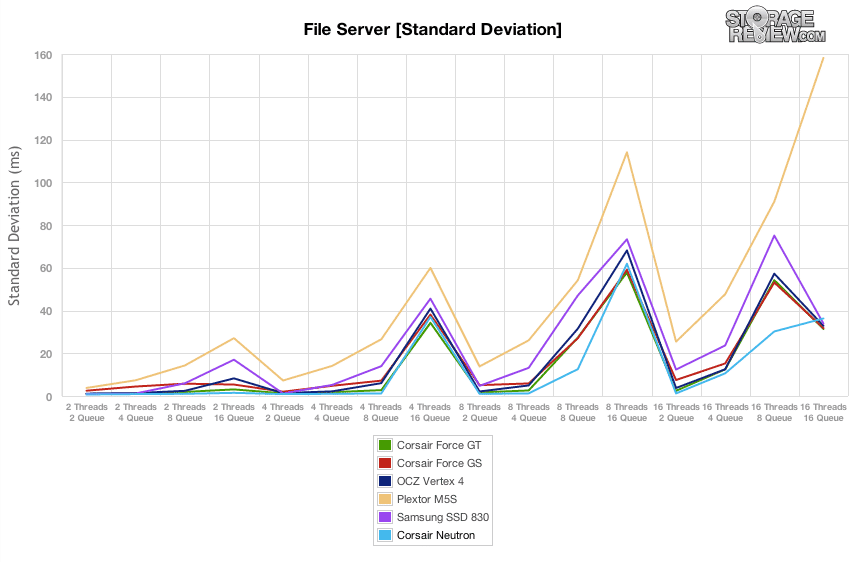
Standard deviation from the consumer SSDs in the File Server preconditioning remained closely grouped together, except for the Plextor M5S.
Once our preconditioning process finished under a high 16T/16Q load, we looked at File Server performance across a wide range of activity levels. In the majority of loads, the Neutron GTX held a strong lead over the other consumer SSDs. It wasn’t until the highest of loads there the drive became overloaded and slipped in performance and lost its lead.
Average latency showed a similar picture, with latency staying under control for most of the consumer SSDs up until the higher thread and queue counts.
Looking at max latency, the Corsair Neutron GTX stayed at the bottom with the smallest spikes, with the Force GS having some of the largest spikes.
In our File Server latency standard deviation section, the Neutron GTX maintained its composure the best, except for the highest workloads where it started to slip behind.
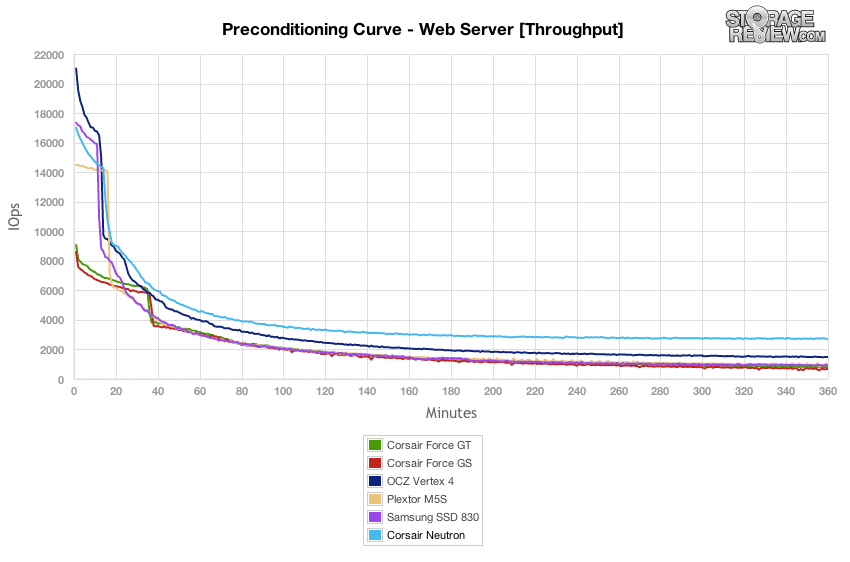
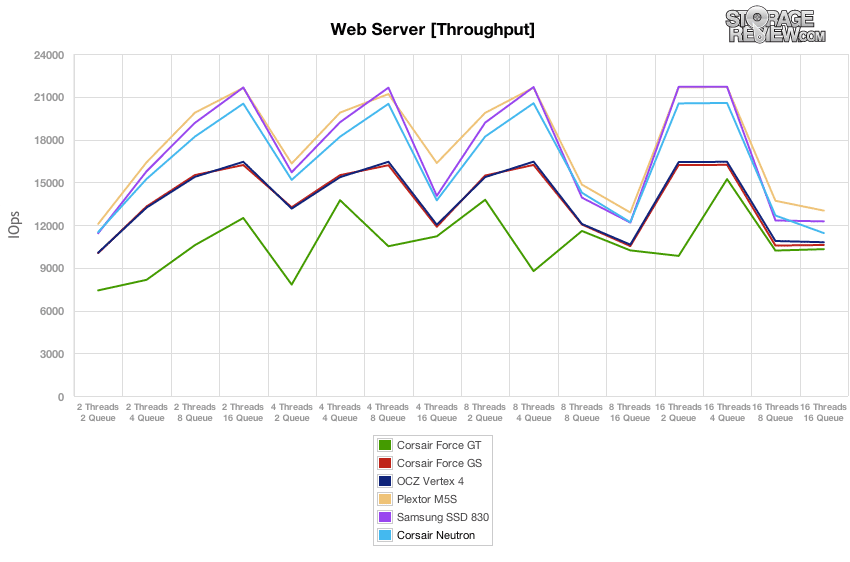
Our last workload is rather unique in the way we analyze the preconditioning phase of the test compared to the main output. As a workload designed with 100% read activity, it’s difficult to show each device’s true read performance without a proper preconditioning step. To keep the conditioning workload the same as the testing workload, we inverted the pattern to be 100% write. For this reason the preconditioning charts are much more dramatic than the final workload numbers.
In our Web Server preconditioning test, known for torturing SSDs, the Corsair Neutron GTX held its own with a clear strength over the other consumer SSDs.
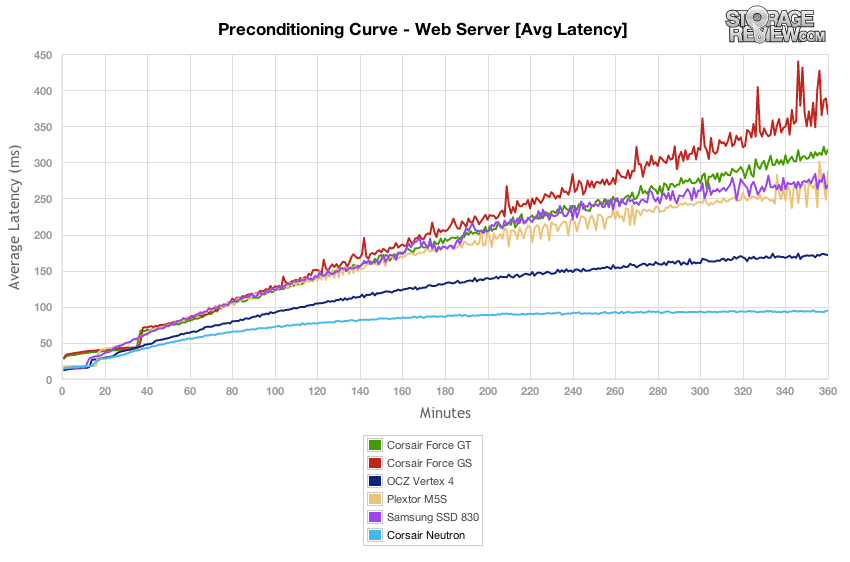
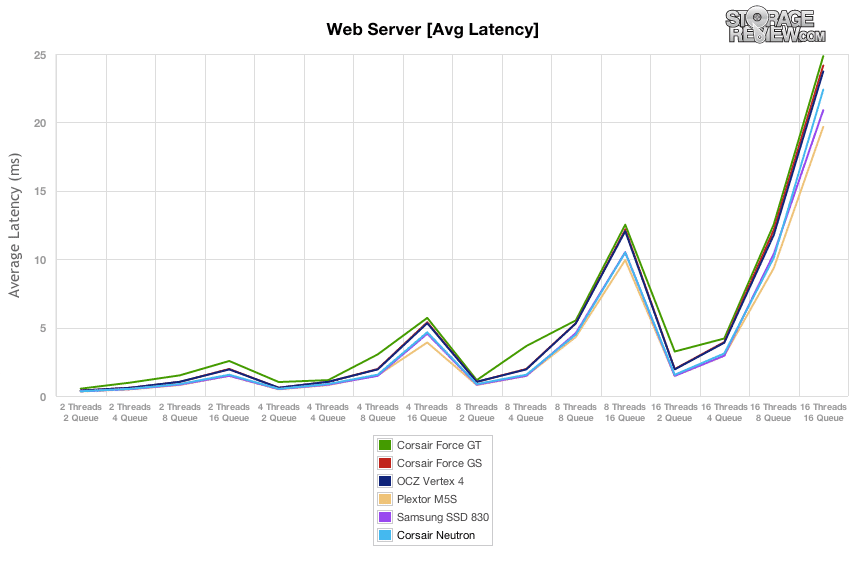
Looking at average latency in the Web Server preconditioning workload the Corsair Neutron GTX led the pack. The Vertex 4 trailed behind it, with the rest of the pack far behind.
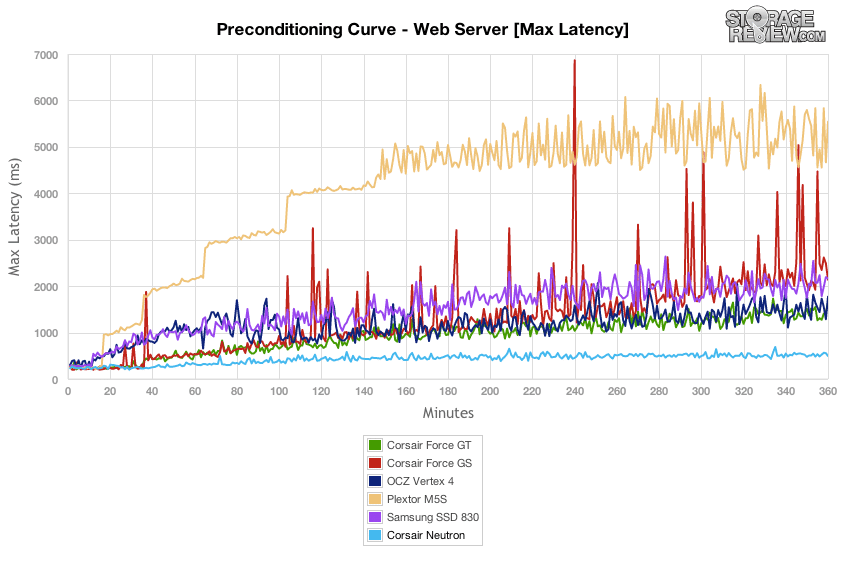
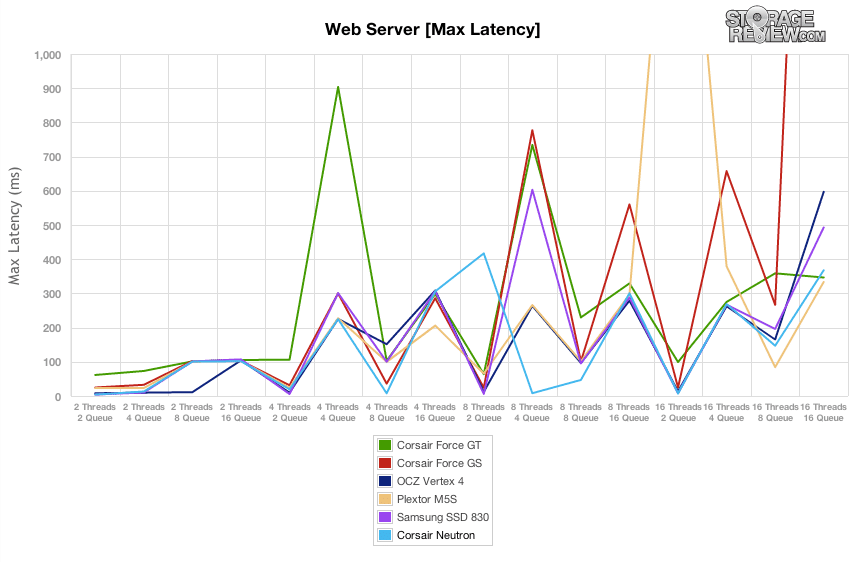
Over the 100% write Web Server preconditioning test, the Neutron GTX had the lowest peak response times, with the rest of the consumer SSDs floating between 1-2,000ms (and the Plextor M5S around 5,000ms).
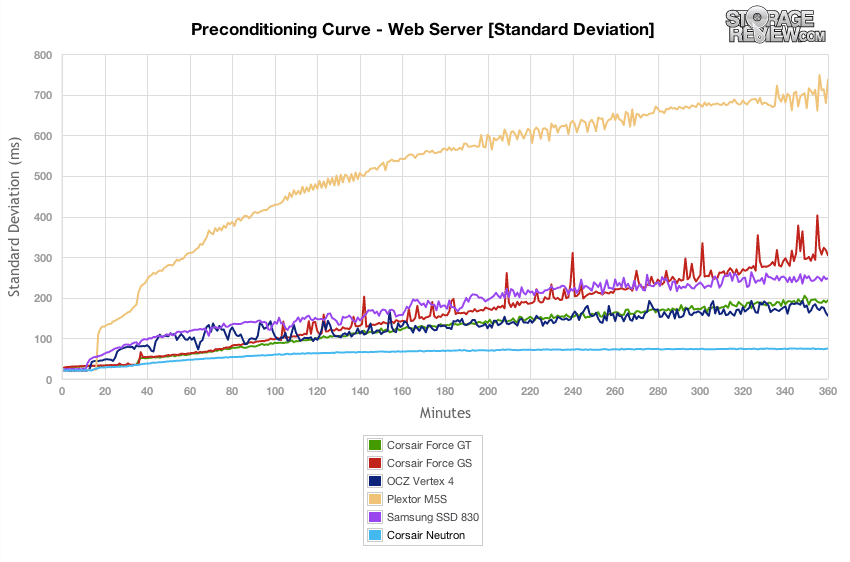
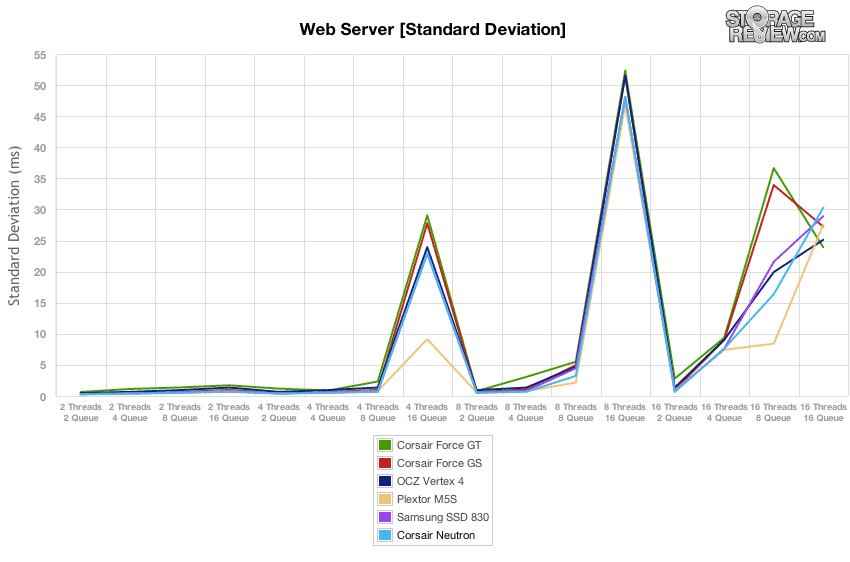
Latency standard deviation comparing this group of consumer SSDs had the Neutron GTX not even putting up a fair fight. Its behavior was more like an enterprise SSD tossed into the comparison than another consumer drive.
Switching back to a 100% read Web Server workload after the preconditioning process, the Corsair Neutron lost some of its performance advantage over the Plextor M5S and Samsung 830 which took the lead. It still stayed at the top of the pack, but it didn’t have its commanding lead that it had with write-intensive workloads.
Average latency in the 100% read Web Server test had all of the SSDs closely grouped together.
It was a toss-up for which drive lead in our peak latency section, as most bounced around in a range between 100-600ms between tests.
There was little difference between the consumer SSDs when it came to latency standard deviation in our 100% read Web Server test. Most spiked as the loads increased, and if any SSD had a lead it was the Plextor M5S that kept the lowest times in certain high-load areas.
Power Consumption
When looking at any modern SSD, power consumption is a huge deciding factor for many mobile shoppers, since the drive itself can make up a large portion of the total power used in a given notebook. In our power consumption tests we look at how much a given drive draws during read and write activities, as well as startup requirements and idle.
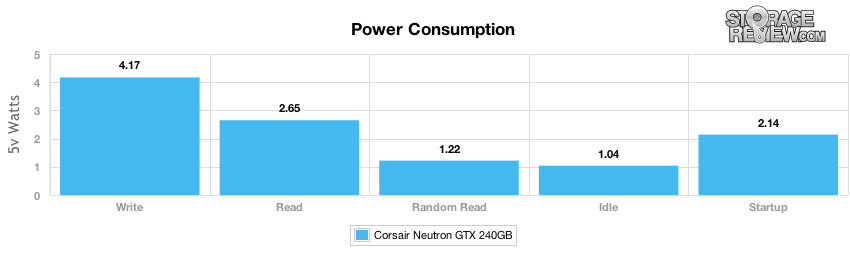
The Corsair Neutron GTX ranks about average in terms of power consumption, with idle power measuring 1.04 watts; above double what most of the newer consumer SSDs measure. In our tests we measured write activity at 4.17 watts while read activity measured 2.65 watts. Random read activity measured 1.22 watts with a startup need of 2.14 watts.
Conclusion
Corsair has shown themselves to be quite the mercenary in the SSD world, selecting from and making an array of SSDs based on the industry’s best available controllers. While many SSD companies have standardized on a single controller, when you don’t own your own controller technology, it’s not such a bad thing to be a soldier of fortune. In the case of the Neutron and Neutron GTX, Corsair makes the bold move to be first to market with the Link A Media Devices LM87800 controller. The LAMD controller is the first serious challenger to Marvell and SandForce in the consumer controller space pretty much since both of those companies released their first efforts a few years ago.
Given the Neutron GTX is an SSD offering based around a new controller, Corsair wanted to make sure we had enough time to run the drive through our gamut of testing. The last several weeks we’ve been pounding away, applying our strict testing rigor from both consumer and enterprise perspectives. This is important for a variety of reasons, not the least of which is the growing trend of using consumer MLC drives in enterprise flash arrays. We’ve also seen that standard consumer testing simply doesn’t accurately depict the complete performance picture of an SSD, which is exactly the case with the Neutron GTX.
From a consumer-oriented performance view, the Neutron GTX offered strong performance in our burst-oriented workloads. While performance didn’t necessarily top the charts in all of our consumer tests, it still ranked very well compared to the fastest SSDs currently on the market. If there was one area that stuck out against the rest, it was the strong sequential and random large-block transfer speeds. Switching to our new enterprise workloads, the Neutron GTX held a clear advantage in nearly all areas, especially those with 100% write conditions. In other areas it was able to suppress most high-latency spikes, which for some of the other consumer models went out of control as our preconditioning process went on.
Pros
- Incredibly strong performance in endurance write-heavy workloads
- Best large-block sequential and random write speeds
- Maintains low response times in our enterprise workloads
Cons
- Falls behind SandForce-powered SSDs in bursty consumer workloads
Bottom Line
If we only looked at the Corsair Neutron GTX with our standard consumer workloads, we would have found the drive to be nice, although not particularly remarkable in many ways. What’s exciting though is that when we really start working the drive hard with our new enterprise grade testing, especially in heavy workloads with lots of write activity, the SSD simply shines above all other current generation consumer SSDs. If you’re evaluating a drive to humm along with basic tasks, honestly, most will do well under that guideline. But if you want a consumer grade drive that can deliver under heavy load and write tasking, then the Neutron GTX is the best we’ve seen.


 Amazon