

The Crucial P2 is the latest low-cost addition to the company’s NVMe SSD consumer portfolio. These types of drives are certainly one of the more bare-bone solutions on the NVMe consumer market, as it’s barely a step up from the slower and less durable QLC NAND drives. That said, its price point makes it one of the most affordable out there, which makes the P2 perfect for those looking for an ultra-affordable way to upgrade their rig to an NVMe-based system.
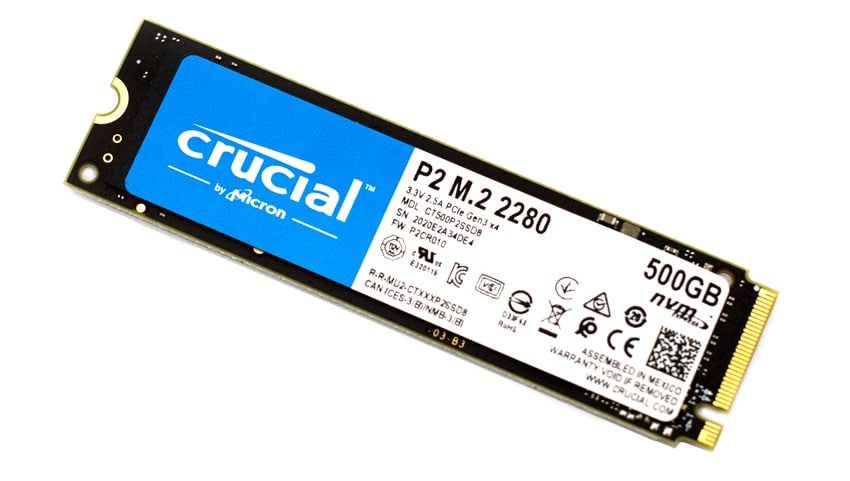
As for what the P2 actually capable of, Crucial quotes up to 2,300MB/s read and 940MB/s write for the 500GB model; this marks a potential 300MB/s improvement (in reads) over the previous P1 line, though writes remain the same. Life Expectancy (MTTF) is specced at 1.5 million hours while Endurance is set at 150TB TBW for both capacities, the latter which is a noticeable increase over its predecessor’s 500GB model.
The Crucial P2 SSD also comes with handy management software for performance optimization, data security, and firmware updates, as well as Acronis True Image for Crucial, the latter which allows users to clone drives, and backup operating systems, applications, settings.
Our video overview is here:
Backed by a 5-year warranty, the P2 is priced at $50 for the 250GB model and $65 for the 500GB model. We will be looking at the 500GB model for this review.
Crucial P2 NVMe SSD Specifications
| Interface | PCIe G3 1×4 / NVMe |
| Form factor | M.2 2280 |
| Capacities | 250GB, 500GB |
| Performance | Sequential Read (up to) – 2300 MB/s
Sequential Write (up to) – 940 MB/s |
| Data Transfer Software | Acronis True Image for Crucial cloning software |
| Advanced Features | • Dynamic Write Acceleration
• Redundant Array of Independent NAND (RAIN) • Multistep Data Integrity Algorithms • Adaptive Thermal Protection • Integrated Power Loss Immunity • Active Garbage Collection • TRIM Support • NVMe standard Self-Monitoring and Reporting Technology (SMART) • Error Correction Code (ECC) • NVMe Autonomous Power State Transition (APST) Support |
| Life Expectancy (MTTF) | 1.5 million hours |
| Endurance | 250GB: 150 Total Bytes Written (TBW)
500GB: 150 Total Bytes Written (TBW) |
| Warranty | Manufacturer’s 5 Year Limited |
Crucial P2 NVMe SSD Performance
Testbed
The test platform leveraged in these tests is a Dell PowerEdge R740xd server. We measure SATA performance through a Dell H730P RAID card inside this server, although we set the card in HBA mode only to disable the impact of RAID card cache. NVMe is tested natively through an M.2 to PCIe adapter card. The methodology used better reflects end-user workflow with the consistency, scalability and flexibility testing within virtualized server offers. A large focus is put on drive latency across the entire load range of the drive, not just at the smallest QD1 (Queue-Depth 1) levels. We do this because many of the common consumer benchmarks don’t adequately capture end-user workload profiles.
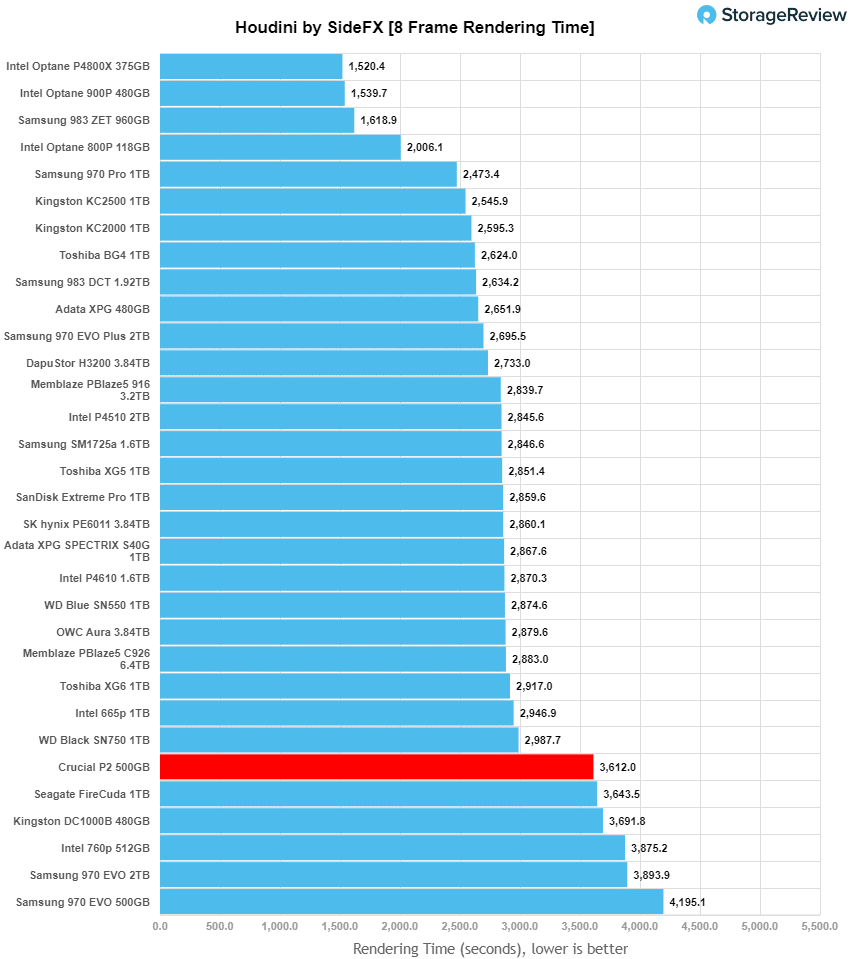
Houdini by SideFX
The Houdini test is specifically designed to evaluate storage performance as it relates to CGI rendering. The test bed for this application is a variant of the core Dell PowerEdge R740xd server type we use in the lab with dual Intel 6130 CPUs and 64GB DRAM. In this case, we installed Ubuntu Desktop (ubuntu-16.04.3-desktop-amd64) running bare metal. Output of the benchmark is measured in seconds to complete, with fewer being better.
The Maelstrom demo represents a section of the rendering pipeline that highlights the performance capabilities of storage by demonstrating its ability to effectively use the swap file as a form of extended memory. The test does not write out the result data or process the points in order to isolate the wall-time effect of the latency impact to the underlying storage component. The test itself is composed of five phases, three of which we run as part of the benchmark, which are as follows:
- Loads packed points from disk. This is the time to read from disk. This is single-threaded, which may limit overall throughput.
- Unpacks the points into a single flat array in order to allow them to be processed. If the points do not have dependency on other points, the working set could be adjusted to stay in-core. This step is multi-threaded.
- (Not Run) Processes the points.
- Repacks them into bucketed blocks suitable for storing back to disk. This step is multi-threaded.
- (Not Run) Writes the bucketed blocks back out to disk.
Here, we see the Crucial P2 render a score of 3,612 seconds, which ranked near the bottom of the pack and well behind the next best drive.
VDBench Workload Analysis
When it comes to benchmarking storage devices, application testing is best, and synthetic testing comes in second place. While not a perfect representation of actual workloads, synthetic tests do help to baseline storage devices with a repeatability factor that makes it easy to do apples-to-apples comparison between competing solutions. These workloads offer a range of different testing profiles ranging from “four corners” tests, common database transfer size tests, to trace captures from different VDI environments. All of these tests leverage the common vdBench workload generator, with a scripting engine to automate and capture results over a large compute testing cluster. This allows us to repeat the same workloads across a wide range of storage devices, including flash arrays and individual storage devices. Our testing process for these benchmarks fills the entire drive surface with data, then partitions a drive section equal to 5% of the drive capacity to simulate how the drive might respond to application workloads. This is different than full entropy tests which use 100% of the drive and take them into steady state. As a result, these figures will reflect higher-sustained write speeds.
Profiles:
- 4K Random Read: 100% Read, 128 threads, 0-120% iorate
- 4K Random Write: 100% Write, 64 threads, 0-120% iorate
- 64K Sequential Read: 100% Read, 16 threads, 0-120% iorate
- 64K Sequential Write: 100% Write, 8 threads, 0-120% iorate
Comparables for this review:
For those of you new to interpreting the vdBench latency curve charts, low-cost drives tend to get some of the more crazy looking charts. vdBench measures the peak performance of the drive, marking that as “100%” load, and then scales back the load to look at latency at 10-120% load in 10% increments. 110% and 120% loads are used to over-saturate the drive to confirm every IOP or MB/s is accounted for, as well as showing how the drive responds to a higher load level.
Certain types of flash and certain controller designs though will perform worse than others under load, creating some interesting data points. If an unstable drive is measured with an increasing load, where latency spikes and performance drops, the datapoint will fall back versus the prior measured points. When all of the data points are connected to show the performance over the given range, this will give the appearance of the drive looping back on itself. For all intents and purposes, a smooth flat line with a small increase at the end is the optimal stable outcome. The line that stays lowest and goes farthest to the right is the fastest with the lowest latency. A drive where latency spikes and won’t stay consistent is unstable under that load. Most low-cost flash devices have write performance as their biggest weakness.
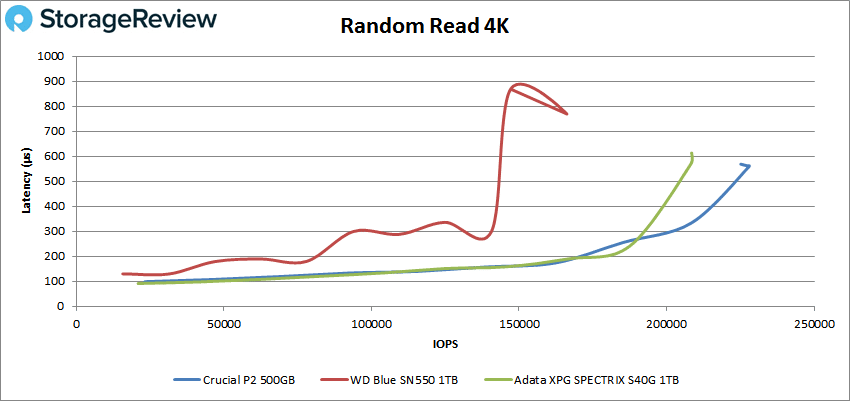
For 4K performance, the Crucial P2 remained below a millisecond throughout the test and went on to peak at 228,048 IOPS with a latency of 560.4ms.
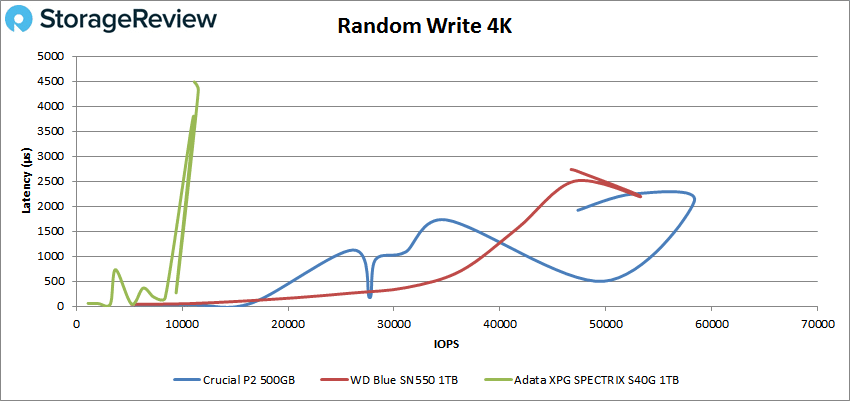
For 4K random write, the Crucial P2 reached a peak of 58,355 IOPS at a latency of 2,097.7µs before taking a significant dip in performance after it reached a moderate load.
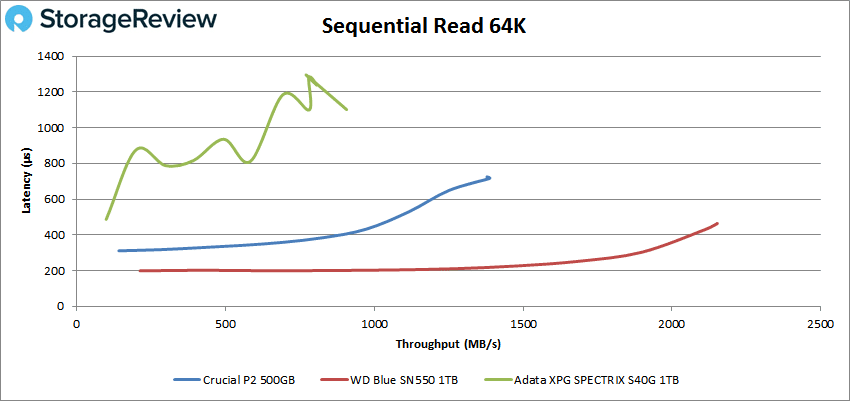
With 64K sequential performance, the Crucial P2 showed latency below 1 millisecond throughout the test and went on to peak at 22,206 IOPS (or 1.34GB/s) with 716µs, showing stable performance throughout with a slight dip at the very end.
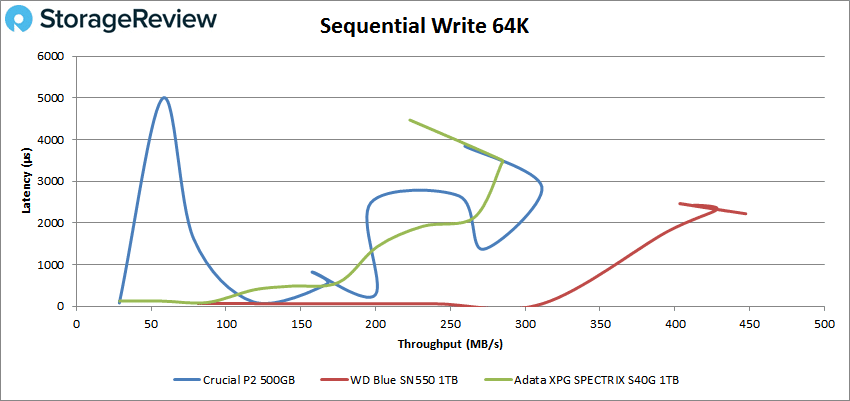
The Crucial P2 continued to show unstable write performance when looking at 64K, with huge spikes in lag from the get-go. It peaked almost 50k IOPS (or just 311MB/s) at 2,865ms before it took its last spike.
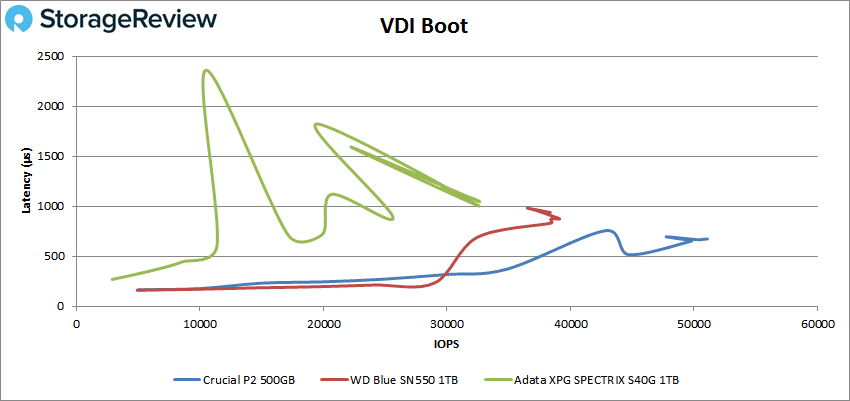
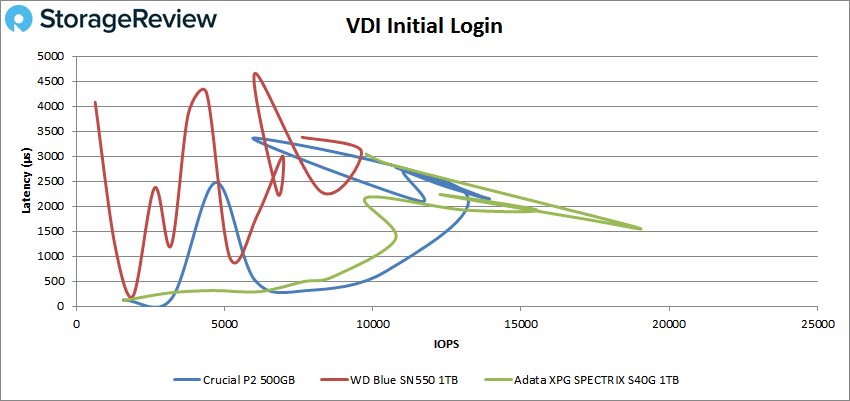
Next, we looked at our VDI benchmarks, which are designed to tax the drives even further. Here you can obviously see that all of these drives struggled, though this was expected due to their focus on price point and read performance only. These tests include Boot, Initial Login, and Monday Login. That said, the Boot test showed the most stable results of the three with a peak of 51,084 IOPS at a latency of 673.6µs.
Looking at our VDI Initial Login, the Crucial P2 showed a peak of 13,937 IOPS with a latency of 2,150µs, showing IOPS/lag spikes throughout.
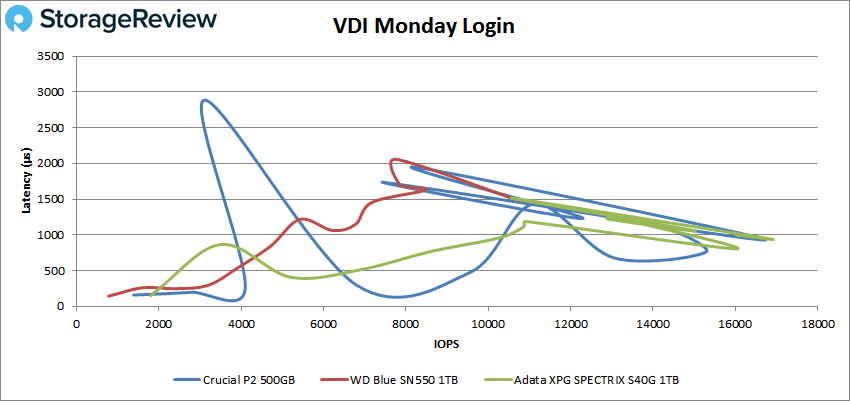
Finally, in our last test, VDI Monday Login showed the most unstable performance by the end of the test, where the Crucial P2 had a peak IOPS at around 16,700 IOPS with just under a millisecond in latency.
Conclusion
The Crucial P2 is an entry-level drive designed for end-users who want to leverage the NVMe technology in a very affordable way, specifically those building a new system or upgrading their old SATA-based one. Compared to the new P5 model (which focuses more on the graphic designer and gamer demo), the P2 is more in line with daily computing needs. Moreover, while its predecessor shipped with QLC, Micron decided to go more on a performance-focused route by equipping the P2 with TLC 3D NAND technology. Currently, it only comes in capacities of 250GB and 500GB.
There were no surprises with its performance results during our tests, showing very weak write activity across the board. Highlights include: 228,048 IOPS in 4K read, 58,355 IOPS in 4K write, 1.34GB/s in 64K read, and 311MB/s in 64K write. In our VDI Clone, we saw 51,084 IOPS in boot, 13,937 IOPS in initial login, and 16,700 IOPS in Monday login.
Though the P2 is one of the more weak-performing TLC-based consumer SSDs we’ve seen, in the end, Crucial achieved exactly what it set out to do: create an ultra-affordable NVMe drive that is priced at the expense of write performance. In any case, you will certainly see an overall improvement in system performance compared to a SATA SSD or an HDD if you install your OS on the Crucial P2 NVMe SSD. If you value cost over everything else or if you’re on a strict budget, the P2 is definitely a viable option as a starter drive.


 Amazon