

The ADATA XPG SPECTRIX S40G RGB is an M.2 SSD that is designed for those looking for performance at a good price as well as a little bit of Wow in their drive design. The S40G leverages an NVMe interface, as well as SLC caching and a DRAM buffer, for quoted speeds of 3.5GB/s read and 3GB/s write as well as throughput as his at 300K IOPS read and 240K IPS write. The drive is marketed toward gamers, PC enthusiasts, overclockers, and graphic professionals.
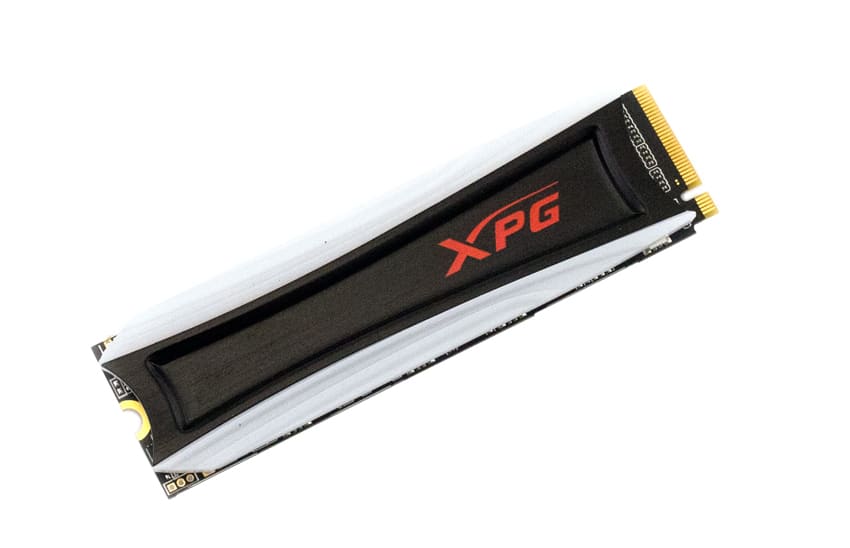
From a security and data integrity perspective, the S40G supports LDPC (Low-Density Parity-Check) error correcting code technology to detect and fix a wider range of data errors. ADATA states that this can provide more accurate data transfers and lengthen the life of the SSD. The drive also comes with AES 256-bit encryption for added security. The S40G has RGB lighting on either side of the drive and can be set to light up in different patterns, pulse speeds, and intensities. This is a plus for those that are wanting to add a little something extra to their rig.
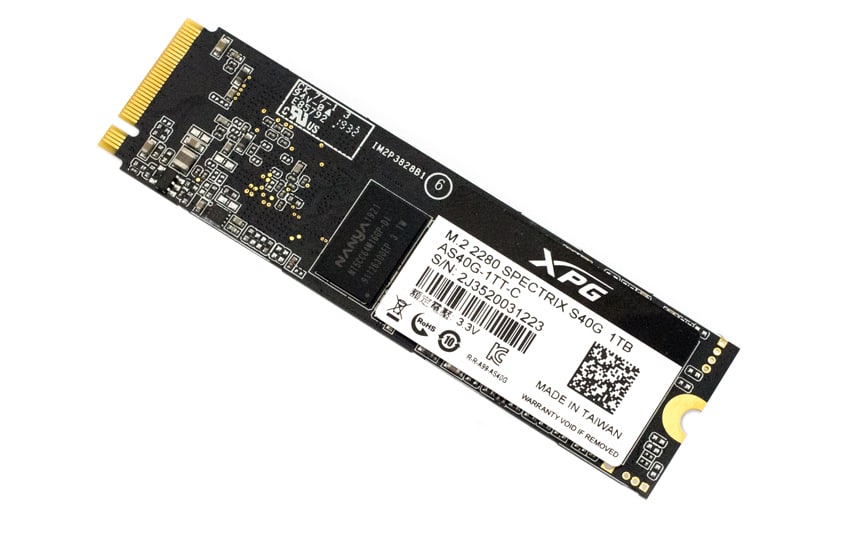
The ADATA XPG SPECTRIX S40G RGB SSD comes with a 5-year warranty, and can be picked up today for as $53 for the 256GB model. The drive also comes in a 512GB, 1TB, and 2TB version. For this review we will be looking at the 1TB model.
ADATA XPG SPECTRIX S40G RGB SSD Specifications
| Capacity | 256GB / 512GB / 1TB / 2TB |
| Form Factor | M.2 2280 |
| NAND Flash | 3D TLC |
| Interface | PCIe Gen3x4 |
| Performance (Max) | read 3500MB/s, write 3000MB/s |
| Maximum 4K random read / write IOPS | 300K/240K IOPS |
| MTBF | 2,000,000 hours |
| Dimensions (L x W x H) | 80 x 22 x 8 mm |
| Weight | 13.4g / 0.47oz |
| Operating temperature | 0°C – 70°C |
| Storage temperature | -40°C – 85°C |
| Shock resistance | 1500G/0.5ms |
| Warranty | 5-year limited warranty |
Performance
Testbed
The test platform leveraged in these tests is a Dell PowerEdge R740xd server. We measure SATA performance through a Dell H730P RAID card inside this server, although we set the card in HBA mode only to disable the impact of RAID card cache. NVMe is tested natively through an M.2 to PCIe adapter card. The methodology used better reflects end-user workflow with the consistency, scalability and flexibility testing within virtualized server offers. A large focus is put on drive latency across the entire load range of the drive, not just at the smallest QD1 (Queue-Depth 1) levels. We do this because many of the common consumer benchmarks don’t adequately capture end-user workload profiles.
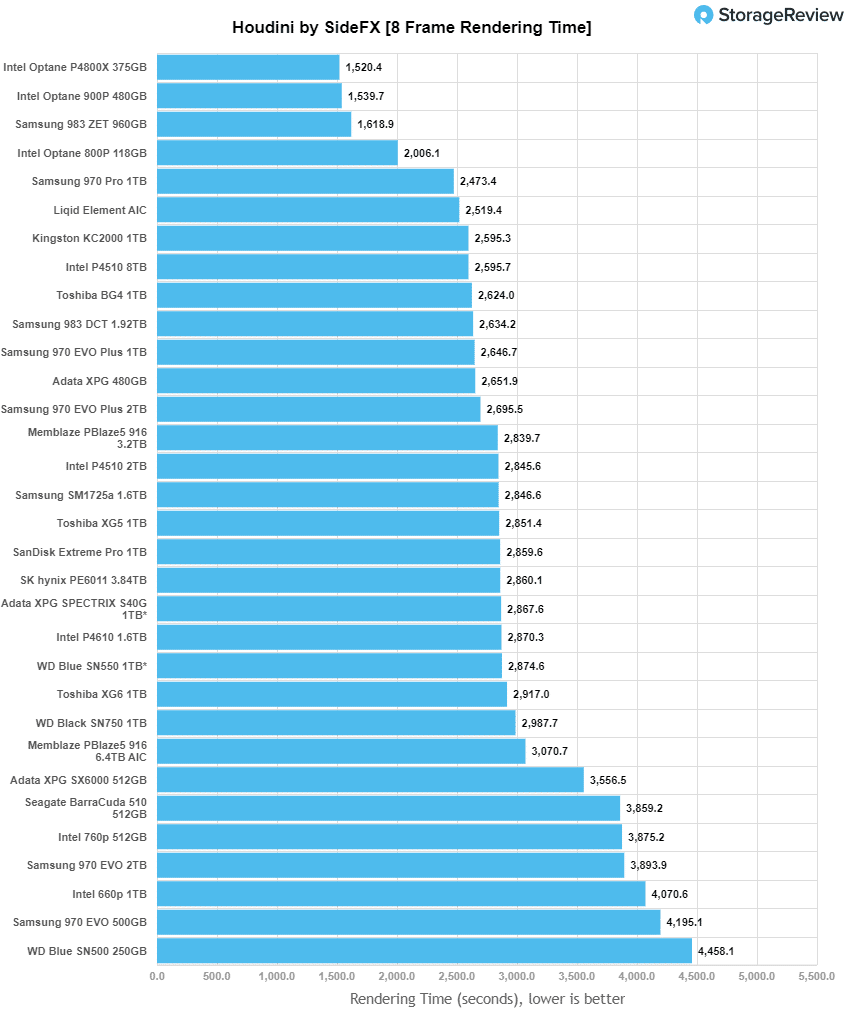
Houdini by SideFX
The Houdini test is specifically designed to evaluate storage performance as it relates to CGI rendering. The test bed for this application is a variant of the core Dell PowerEdge R740xd server type we use in the lab with dual Intel 6130 CPUs and 64GB DRAM. In this case we installed Ubuntu Desktop (ubuntu-16.04.3-desktop-amd64) running bare metal. Output of the benchmark is measured in seconds to complete, with fewer being better.
The Maelstrom demo represents a section of the rendering pipeline that highlights the performance capabilities of storage by demonstrating its ability to effectively use the swap file as a form of extended memory. The test does not write out the result data or process the points in order to isolate the wall-time effect of the latency impact to the underlying storage component. The test itself is composed of five phases, three of which we run as part of the benchmark, which are as follows:
- Loads packed points from disk. This is the time to read from disk. This is single threaded, which may limit overall throughput.
- Unpacks the points into a single flat array in order to allow them to be processed. If the points do not have dependency on other points, the working set could be adjusted to stay in-core. This step is multi-threaded.
- (Not Run) Process the points.
- Repacks them into bucketed blocks suitable for storing back to disk. This step is multi-threaded.
- (Not Run) Write the bucketed blocks back out to disk.
Looking at the performance of rendering time (where less is better), the ADATA S40G saw 2,867.6 seconds placing it roughly in the middle of the pack.
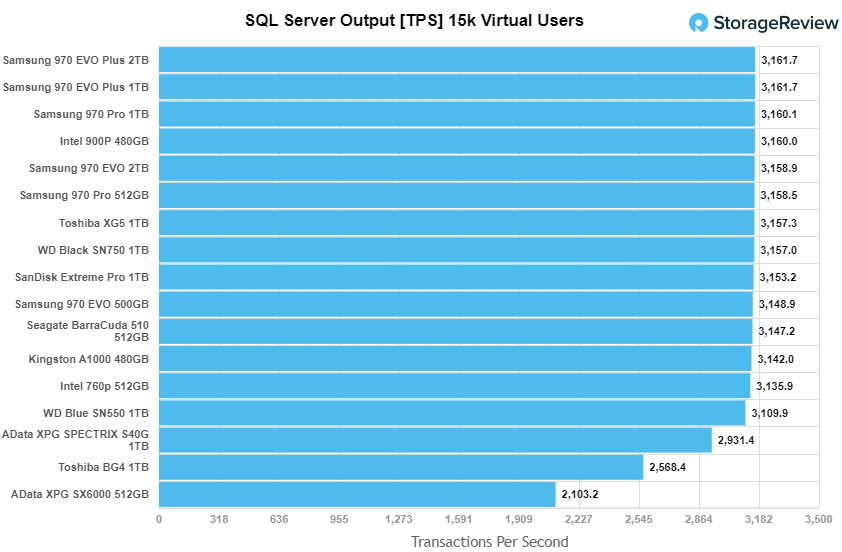
SQL Server Performance
We use a lightweight virtualized SQL Server instance to appropriately represent what an application developer would use on a local workstation. The test is similar to what we run on storage arrays and enterprise drives, just scaled back to be a better approximation for behaviors employed by the end user. The workload employs the current draft of the Transaction Processing Performance Council’s Benchmark C (TPC-C), an online transaction processing benchmark that simulates the activities found in complex application environments.
The lightweight SQL Server VM is configured with three vDisks: 100GB volume for boot, a 350GB volume for the database and log files, and a 150GB volume used for the database backup we recover after each run. From a system resource perspective, we configure each VM with 16 vCPUs, 32GB of DRAM and leverage the LSI Logic SAS SCSI controller. This test uses SQL Server 2014 running on Windows Server 2012 R2 guest VMs and is stressed by Dell’s Benchmark Factory for Databases.
SQL Server Testing Configuration (per VM)
- Windows Server 2012 R2
- Storage Footprint: 600GB allocated, 500GB used
- SQL Server 2014
- Database Size: 1,500 scale
- Virtual Client Load: 15,000
- RAM Buffer: 24GB
- Test Length: 3 hours
- 2.5 hours preconditioning
- 30 minutes sample period
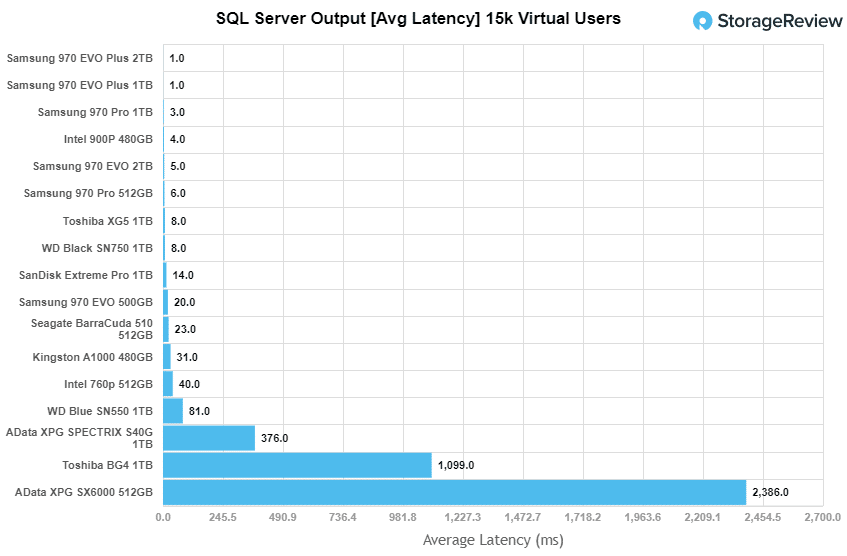
When looking at SQL Server Output, the S40G was near the bottom with a score of 2,931.4 TPS; the top score of 3,161.7 TPS.
Looking at average latency in the same test, the S40G saw 376ms, not the worst but far from the best.
VDBench Workload Analysis
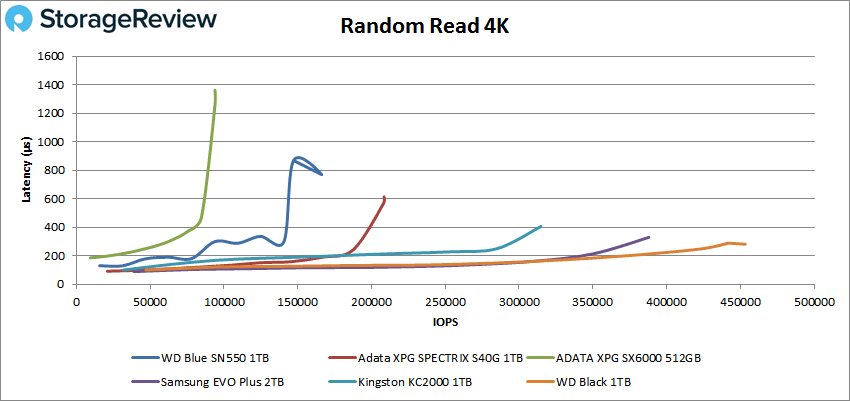
In our first VDBench Workload Analysis, we looked at random 4K read performance. Here, the ADATA S40G peaked at 208,196 IOPS with a latency of 613µs placing fourth in our pack.
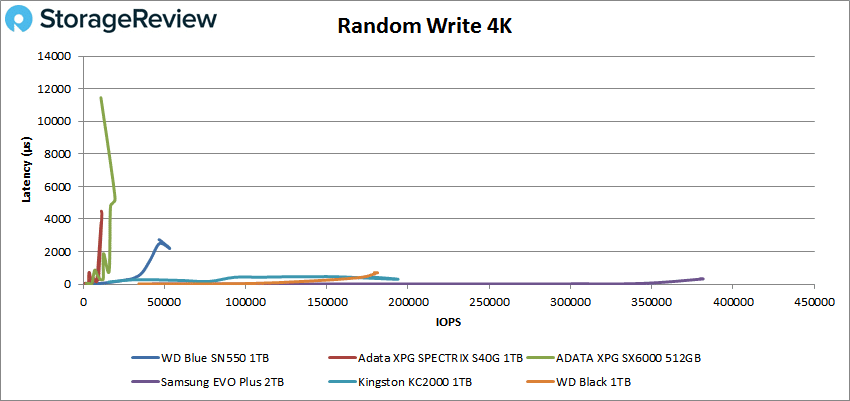
For 4K random writes the S40G placed last with a peek score of about 115K IOPS and a latency of 4.3ms. The drive did start at under 50µs though.
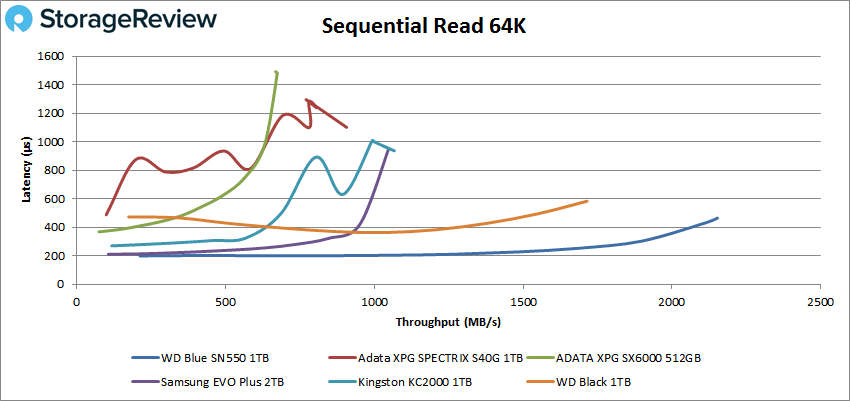
Switching to sequential work, for 64K read the S40G peaked at 14,516 IOPS or 907MB/s at a latency of 1.1ms taking fifth out of six.
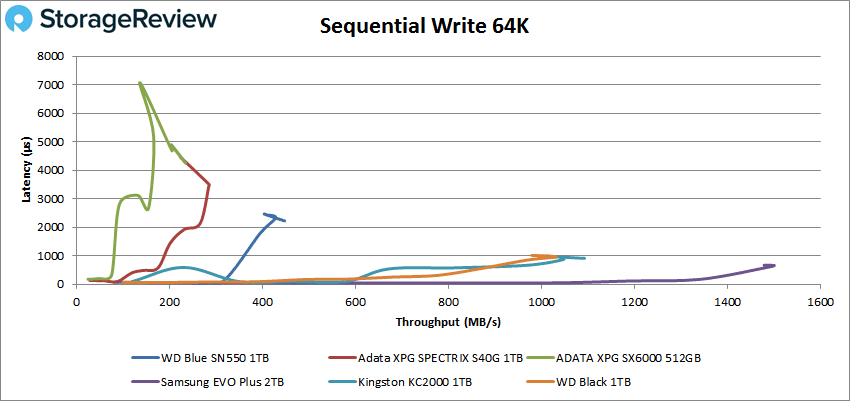
For 64K write the drive peaked at 4,547 IOPS or 284MB/s at a latency of 3.4ms before dropping off and placing last.
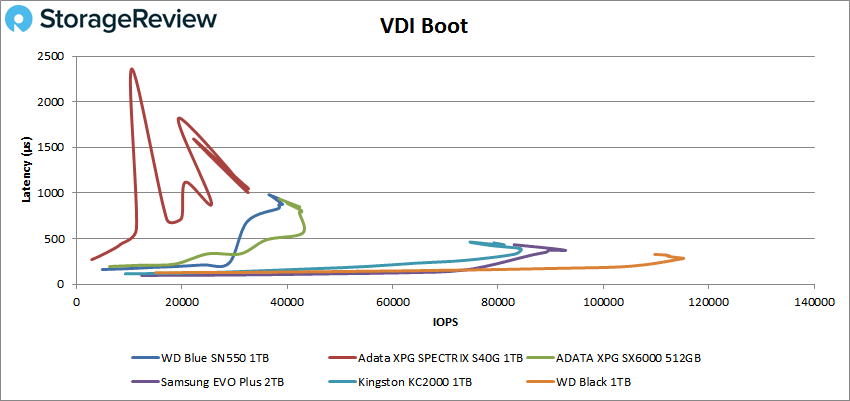
Next, we looked at our VDI benchmarks. This benchmark is designed to tax the drives even further and include Boot, Initial Login, and Monday Login tests. Looking at the Boot test, the ADATA S40G had a bit of an erratic performance and placed last with a peak score of 32,584 IOPS at a latency of 1ms, though it was running much higher before it peaked in latency.
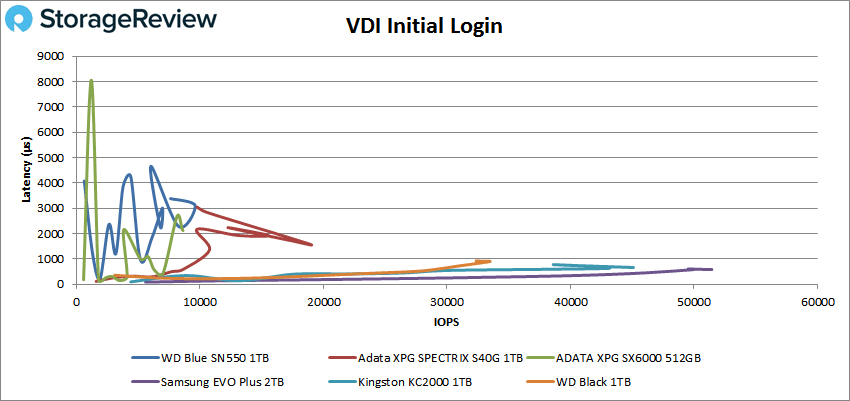
In VDI Initial Login the S40G performed better landing about in the middle with a peak score of 18,849 IOPS at a latency of 1.6ms.
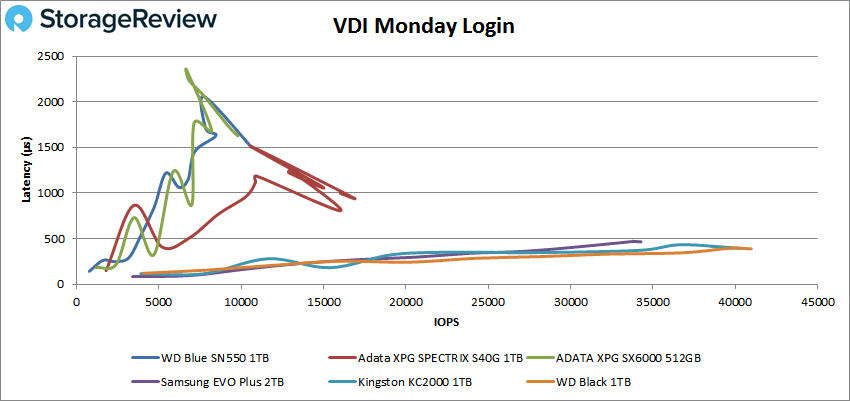
Finally for VDI Monday Login, the S40G landed in the middle with a peak performance of 16,840 IOPS at a latency of 946µs, although the latency had been running over 1ms before peak.
Conclusion
The ADATA XPG SPECTRIX S40G RGB is an M.2 SSD aimed at gamers and enthusiasts that want a little something extra for their rig. The SSD comes with claims of 3.5GB/s read and up to 300K IOPS. The S40G has AES 256-bit encryption and a 5-year warranty. And there are RGB lights on the side that can be customized to spruce up one’s PC.
Looking at performance the S40G isn’t every impressive compared to the other drives it was tested against. For Houdini the drive did alright with 2,867.6 seconds. In SQL Server the S40G was near the bottom with 2,931.4 TPS and an average latency of 376ms. Throughout our VDBench the S40G placed from middle to bottom of the pack. In 4K read it peaked at 208K IOPS, 4K write saw it with about 115K IOPS, 64K read was 907MB/s, and 64K write was 284MB/s. In our VDI benchmarks the drive didn’t fare much better with 33K IOPS for Boot, 19K IOPS for Initial Login, and 17K IOPS for Monday Login.
The ADATA XPG S40G is not a high performer. This is usually balanced out by having a lower price, but as of this writing you can buy the Samsung EVO Plus for only $17 more than the smallest capacity S40G. Other competing drives, priced lower are able to outperform the S40G, which makes some pricing arguments tough sells. However, if you are a recreational gamer and you want to add a little spice to your rig to make it stand out, programmable lights are a nice touch.


 Amazon