
In July, DataCore announced DataCore ONE, the company’s vision for the software-defined storage (SDS) industry. As part of the launch, DataCore released a new turnkey hyperconverged infrastructure (HCI) appliance. The HCI-Flex appliance merges the flexibility of hyperconverged with the flexibility of SDS into a single appliance that comes pre-installed with either VMware vSphere or Microsoft Hyper-V, as well as DataCore’s advanced data services including smart caching, thin provisioning, dynamic-auto-tiering, and Parallel I/O acceleration.
In July, DataCore announced DataCore ONE, the company’s vision for the software-defined storage (SDS) industry. As part of the launch, DataCore released a new turnkey hyperconverged infrastructure (HCI) appliance. The HCI-Flex appliance merges the flexibility of hyperconverged with the flexibility of SDS into a single appliance that comes pre-installed with either VMware vSphere or Microsoft Hyper-V, as well as DataCore’s advanced data services including smart caching, thin provisioning, dynamic-auto-tiering, and Parallel I/O acceleration.
DataCore’s main thrust with the HCI-Flex Appliance is the combination of HCI and SDS to truly reap the flexibility promises of hyperconverged. This combination of technology allows users to leverage internal and external storage regardless of vendor. Also, from a storage perspective, DataCore uses storage pooling, auto-tiering, and data migration for further optimization. Faster deployment (within an hour) through automation; this includes either ESXi or Hyper-V. Users can see a simplified management as well with a single-click console that is fully integrated with vCenter deployment and ESXi management. With performance, the HCI-Flex Appliance can sale up and out up to 64 nodes with minimal performance degradation, according to DataCore.
As part of the DataCore ONE announcement, DataCore Insight Services (DIS) introduces a cloud-based, software-as-a-service predictive analytics platform that continuously analyzes telemetry from users’ SANsymphony environment. Through DIS, AI and ML are leveraged to find problems and issues before they happen and tell admins the best way to prevent or fix these issues. DIS can also execute on actionable insights to help reduce support calls and save time. DIS can also tell when users have departed from best practices and guide them to better allocate their resources. Admins are able to view DIS analytics, as well as their insights, from the DataCore Web Console.
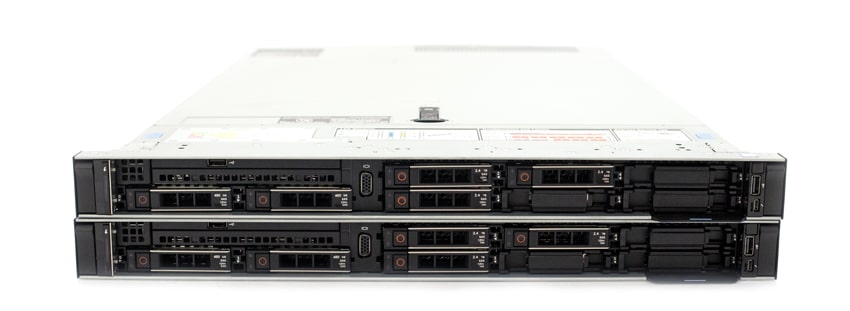
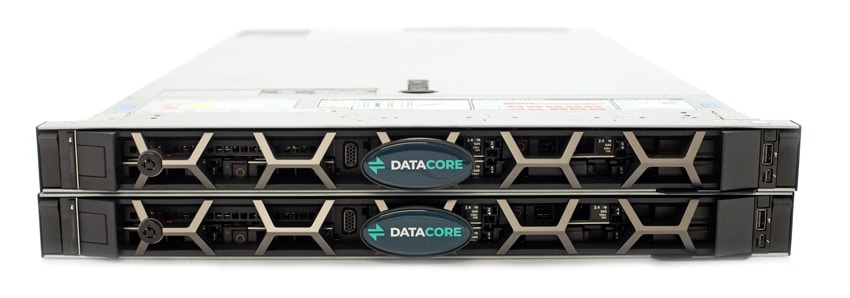
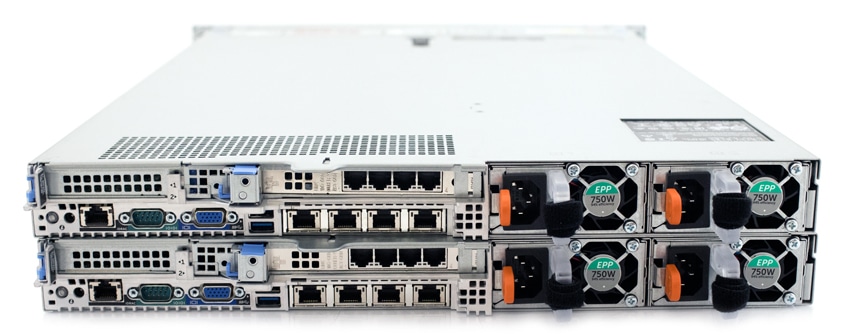
From a hardware perspective, the appliance comes in either 1U or 2U form factor. DataCore leverages Dell’s PowerEdge server. The DataCore HCI-Flex Appliance leverages Intel Xeon CPUs and up to 768GB of memory. The appliances come in both Hybrid and Flash configurations with a maximum capacity of 20TB in a 2U form factor.
DataCore HCI-Flex Specifications
| Models | Processor | Memory | HDD | SSD | Capacity | NIC |
| HCI-Flex 3, 1U HYBRID | (2) Intel Xeon Silver 4110 2.1G, 8C/16T, 9.6GT/s 2UPI, 11M Cache, Turbo, HT (85W) | 64GB | 3×2.4TB | 2x480GB | 5TB | RJ45 or SFP+ |
| HCI-Flex 3, 1U SSD | (2) Intel Xeon Silver 4110 2.1G, 8C/16T, 9.6GT/s 2UPI, 11M Cache, Turbo, HT (85W) | 64GB | 4x960GB | 3TB | RJ45 or SFP+ | |
| HCI-Flex 5, 1U HYBRID | (2) Intel Xeon Gold 5118 2.3G, 12C/24T, 10.4GT/s 2UPI, 16.5M Cache, Turbo, HT (105W) | 128GB | 6×2.4TB | 2x480GB | 10TB | RJ45 or SFP+ |
| HCI-Flex 5, 1U SSD | (2) Intel Xeon Gold 5118 2.3G, 12C/24T, 10.4GT/s 2UPI, 16.5M Cache, Turbo, HT (105W) | 128GB | 8x960GB | 6TB | RJ45 or SFP+ | |
| HCI-Flex 7, 2U HYBRID – 192GB | (2) Intel Xeon Gold 6152 2.1G, 22C/44T, 10.4GT/s 2UPI, 25M Cache, Turbo, HT (140W) | 192GB | 11×2.4TB | 2x480GB | 20TB | RJ45 or SFP+ |
| HCI-Flex 7, 2U HYBRID – 384GB | (2) Intel Xeon Gold 6152 2.1G, 22C/44T, 10.4GT/s 2UPI, 25M Cache, Turbo, HT (140W) | 384GB | 11×2.4TB | 2x480GB | 20TB | RJ45 or SFP+ |
| HCI-Flex 7, 2U SSD – 192GB | (2) Intel Xeon Gold 6152 2.1G, 22C/44T, 10.4GT/s 2UPI, 25M Cache, Turbo, HT (140W) | 192GB | 16x960GB | 13TB | RJ45 or SFP+ | |
| HCI-Flex-7 2U SSD – 384GB | (2) Intel Xeon Gold 6152 2.1G, 22C/44T, 10.4GT/s 2UPI, 25M Cache, Turbo, HT (140W) | 384GB | 16x960GB | 13TB | RJ45 or SFP+ |
Management
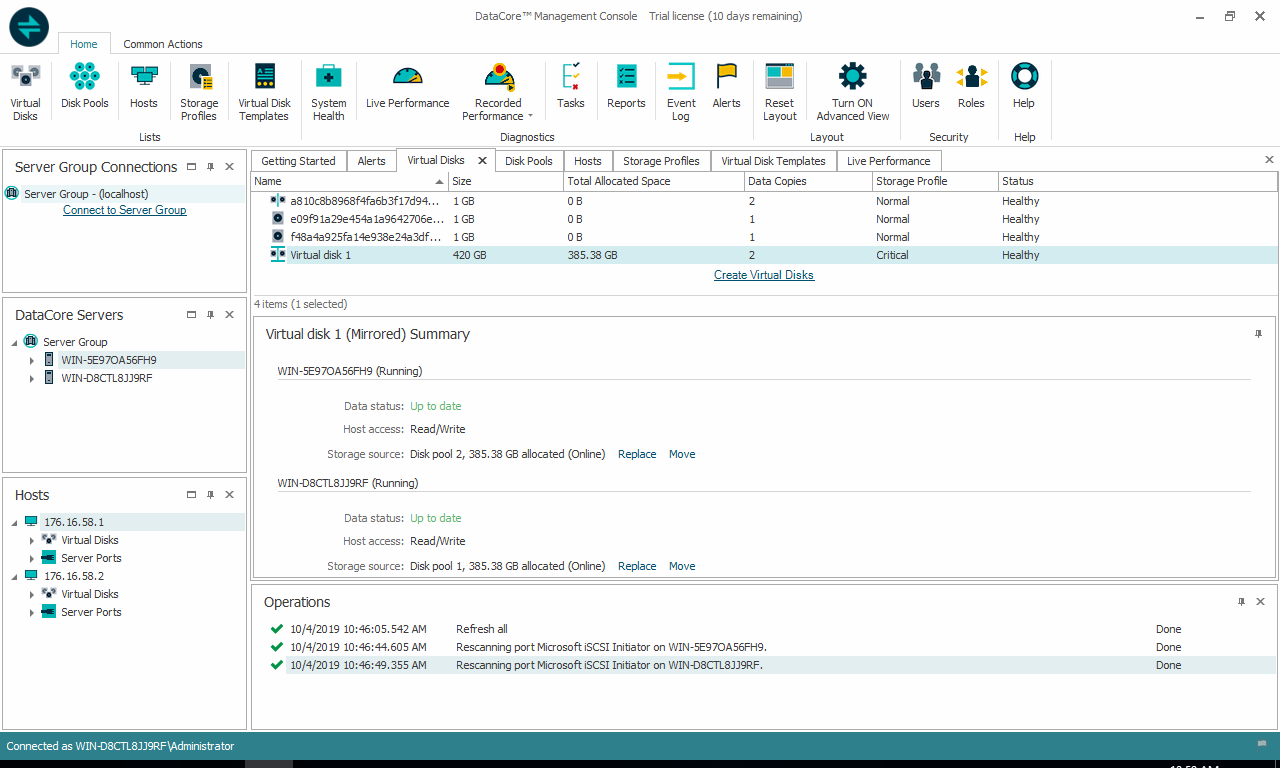
DataCore has completely redesigned it UI. The company states that through the redesign, users should have more time leveraging automation while also being able to see everything in a single pane of glass. Opening up the DataCore Management Console we are greeted with the home screen. Here there are two main tabs (at first): Home and Common Actions. Beneath home there is a series of sub-tabs including Virtual Disks, Disk Pools, Hosts, Storage Profiles, Virtual Disk Templates, System Health, Live Performance Recorded Performance, Tasks, Reports, Even Log, Alerts, Reset Layout, Turn ON Advanced View, Users, Roles, and Help. Beneath that, on the left are lists including Server Group Connections, DataCore Servers, and Hosts. On the right, are diagnostics including Getting Started, Alerts, Virtual Disks, Disk Pools, Hosts, Storage Profiles, Virtual Disk Templates, and Live Performance.
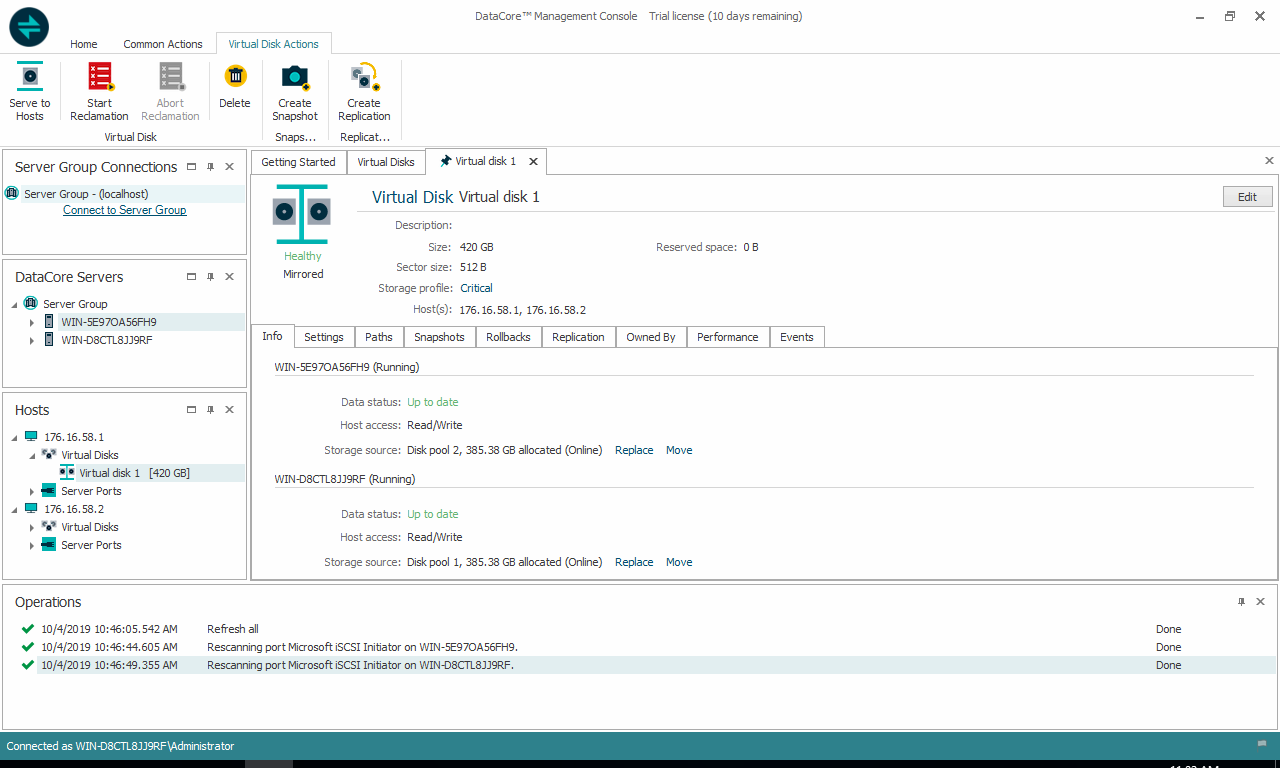
Through Diagnostics>Virtual Disks we can drill down into individual Virtual Disks. Here we can see info like its size, total allocated space, data copies, storage profile, and status. New virtual disks can be created here as well. A brief summary of the selected virtual disk is given along with its operations.
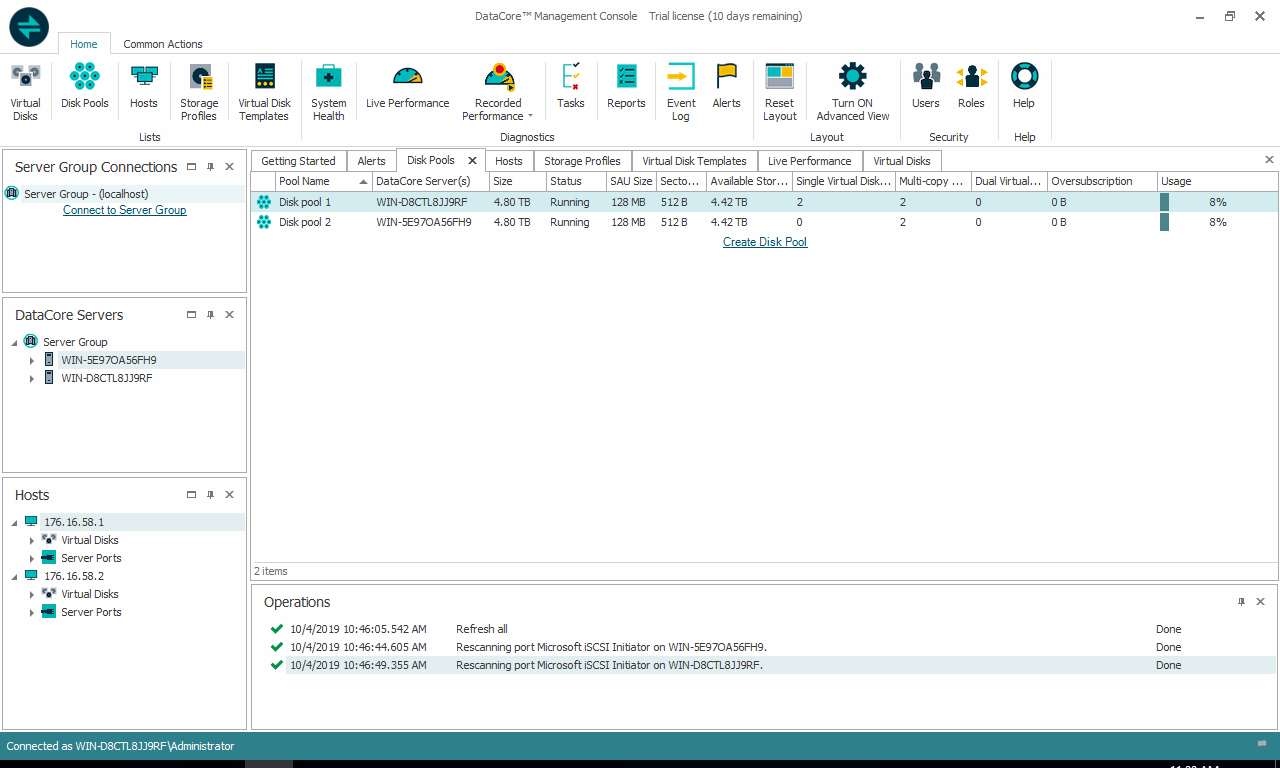
Next up is Diagnostics>Disk Pools with similar information to the above. One can see the pools running and their names, which DataCore server it is located on, its size, status, SAU size, sector size, available storage, single or dual virtual disks, multi-copy, the amount of overprovisioning, and usage. Clicking on a pool allows us to drill a little further into operations.
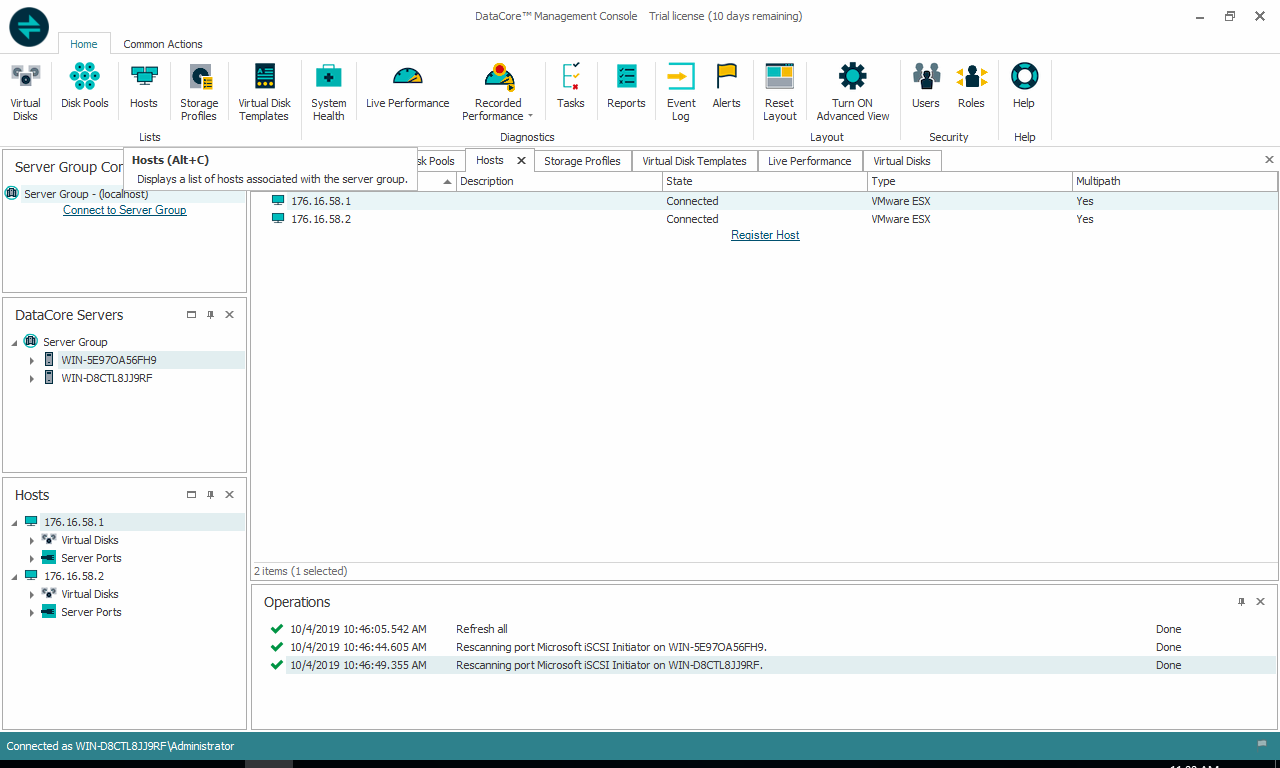
Diagnostics>Hosts is fairly simple, listing off the hosts, a description if one is added, its state, type, and whether it is Multipath. Clicking on the hosts drills down into operations.
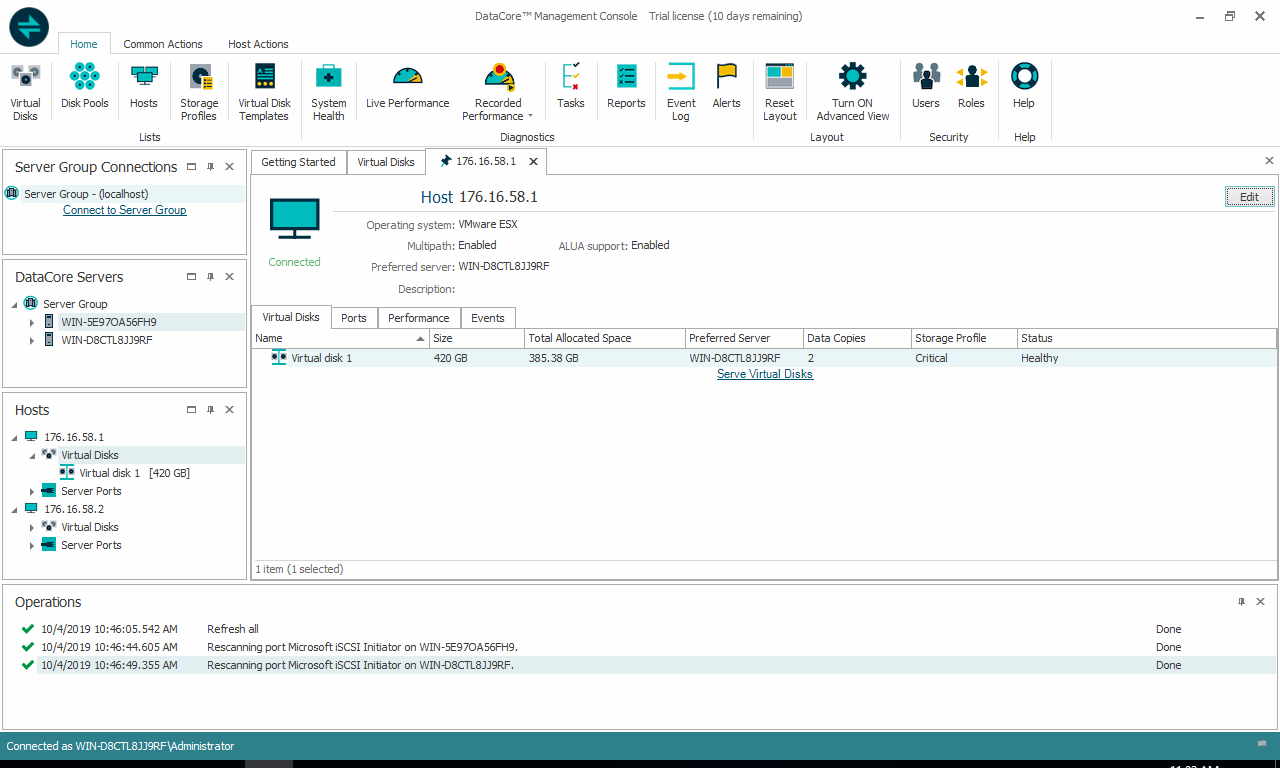
Double clicking on the Hosts in the box on the left can pull up even more information such as OS, whether multipath is enable, ALUA support, and the preferred server. There are also more sub-tabs including Virtual Disks, Ports, Performance, and Events.
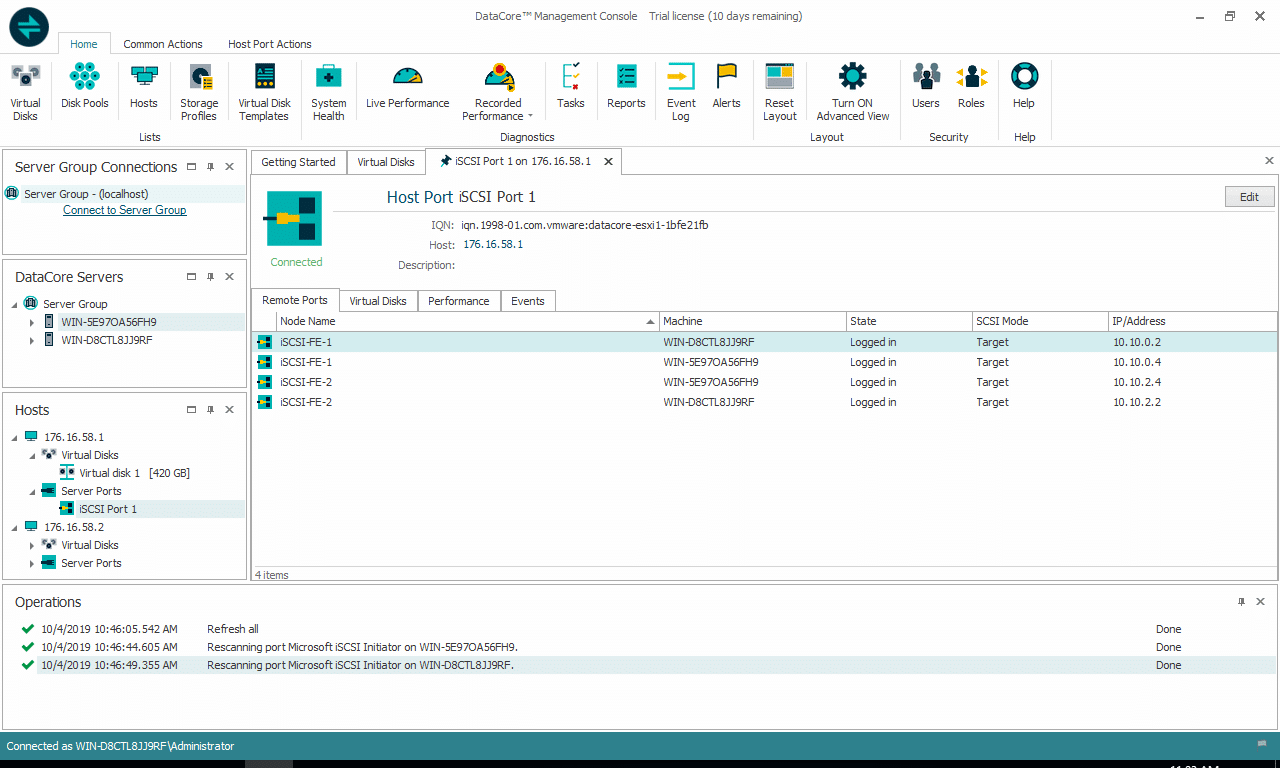
Clicking on the iSCSI Port and give more in-depth information such as IQN, Host, and description. As well as Node name, Machine, State, SCSI Mode, and IP/Address.
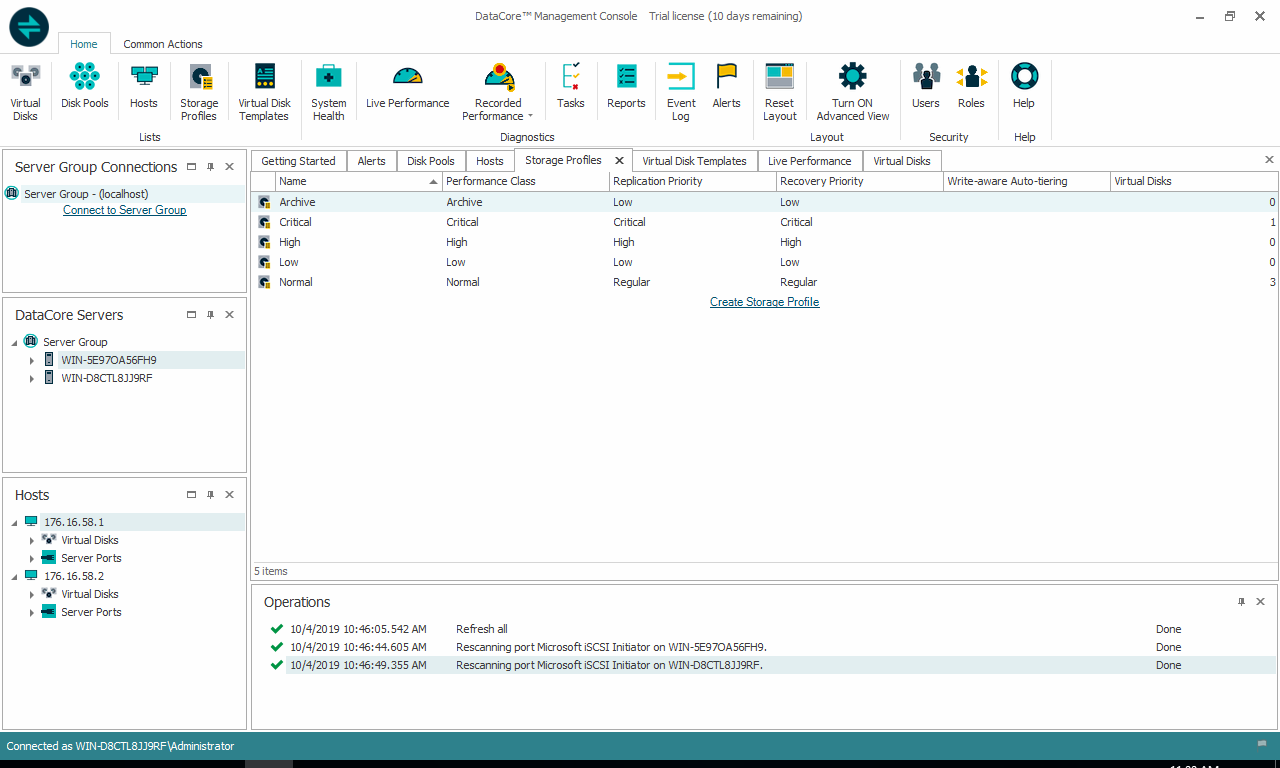
Diagnostics>Storage Profiles lists the name and performance class (here we named the profile after its performance class) as well as its replication and recovery priority. Admins can create new storage profiles here and drill down into existing ones.
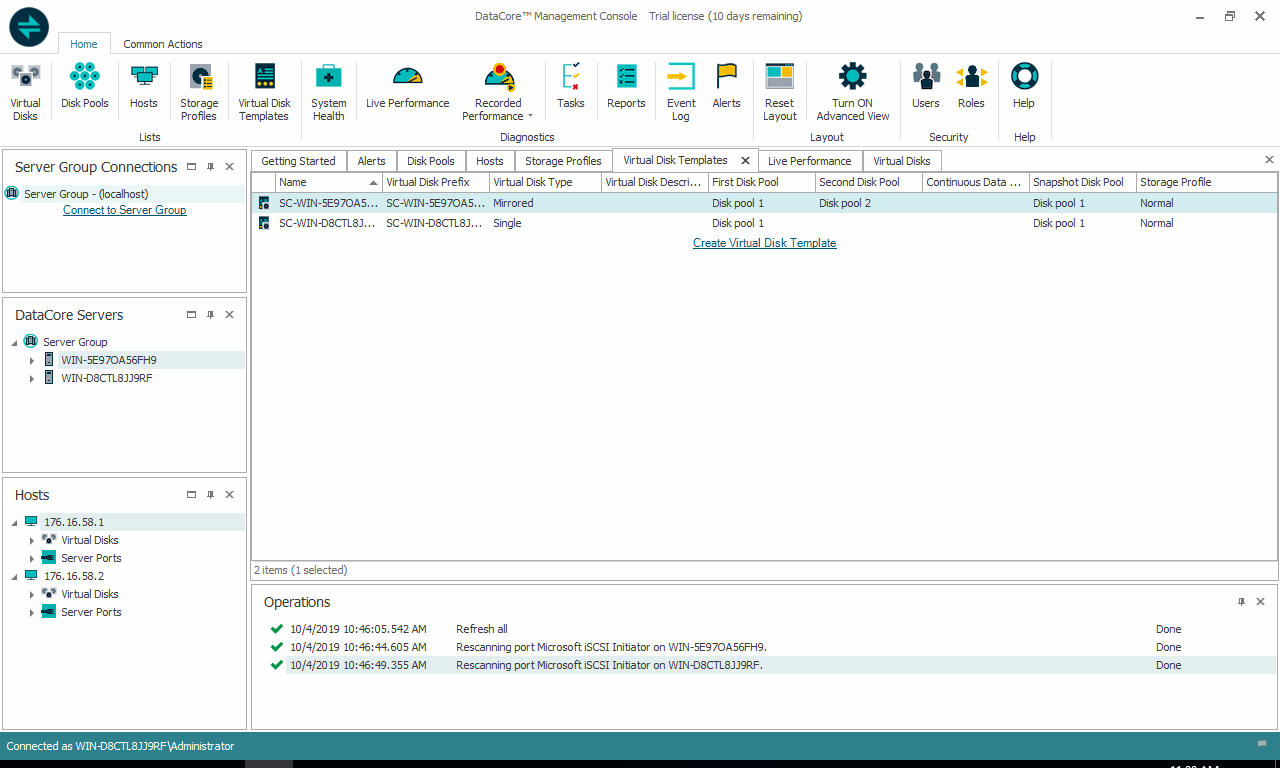
Next is Diagnostics>Virtual Disk Templates. Clicking on this sub-tab admins see name, virtual disk prefix, virtual disk type, virtual disk description, first disk pool, second disk pool, continuous data, snapshot disk pool, and storage profile. New virtual disk templates can be created here as well.
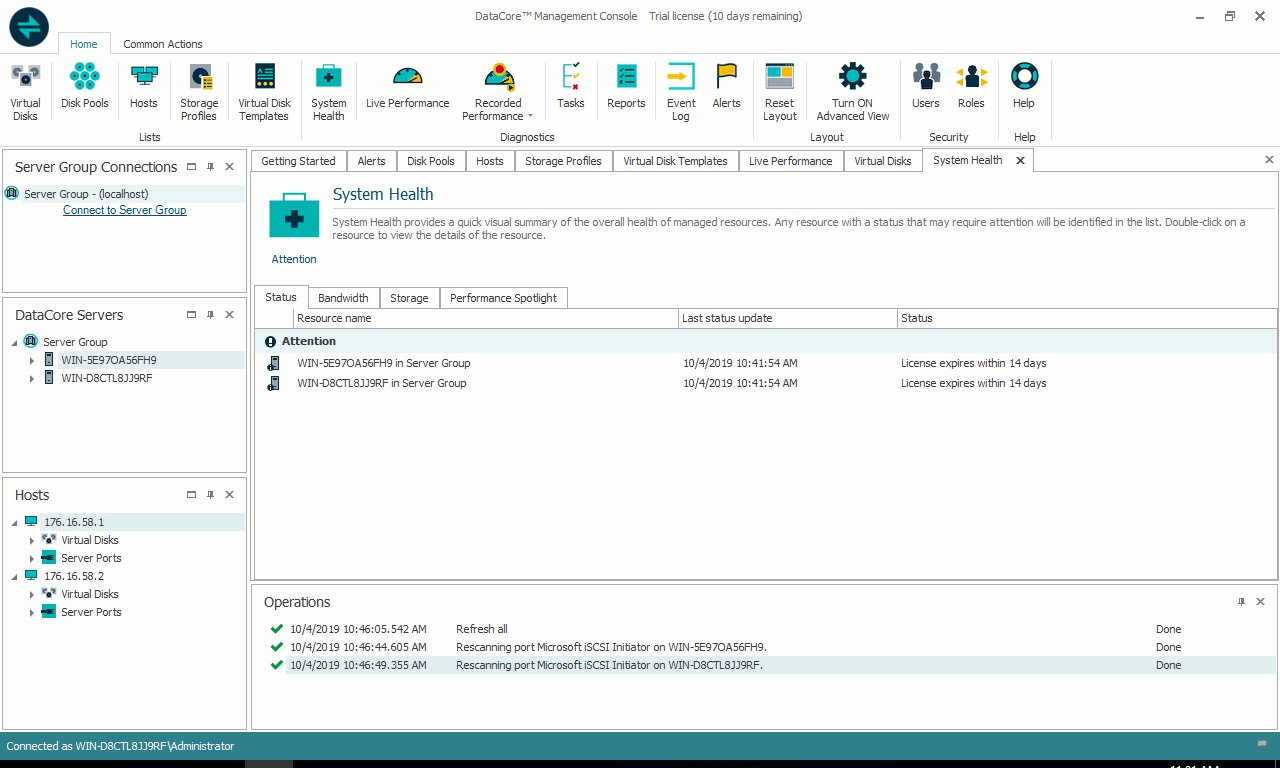
Diagnostics>System Health is fairly self-explanatory. Admins can look over the system health as a whole and find what is in need of attention so it can be corrected.
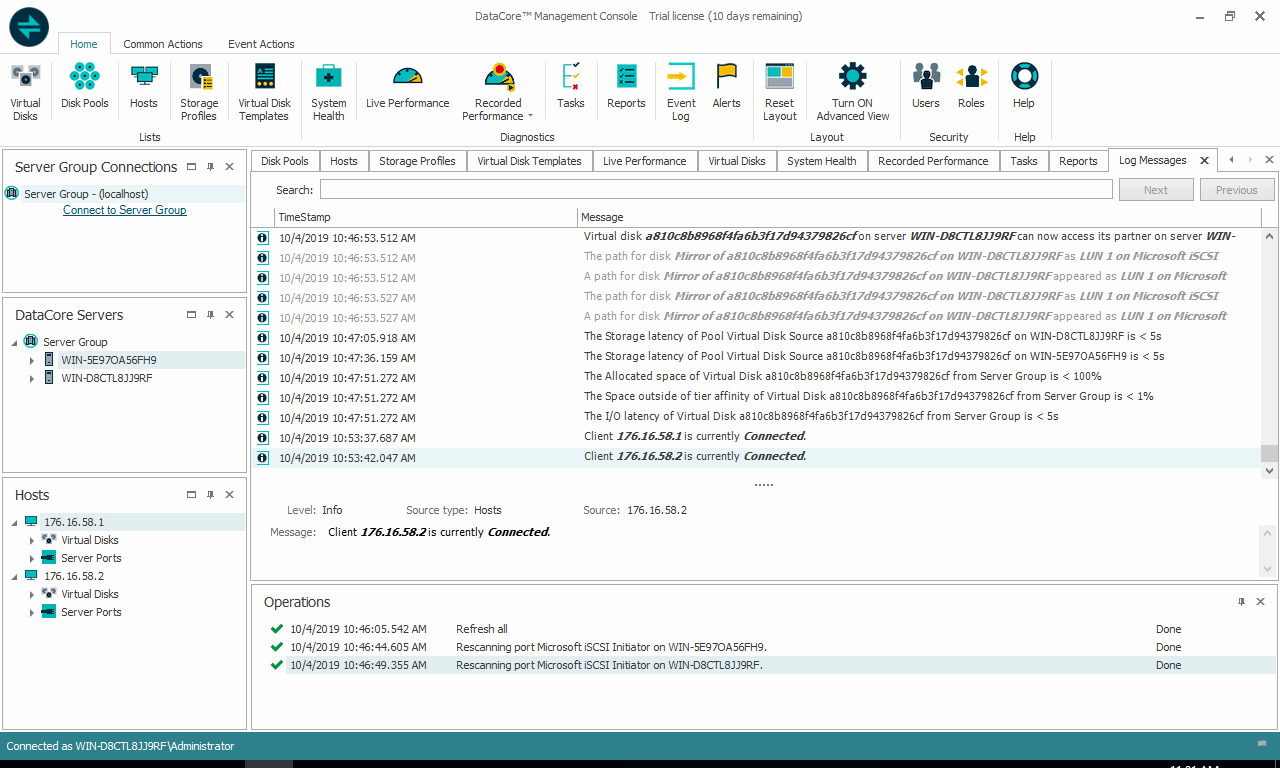
Finally, under diagnostics is Log Messages and gives admins alerts of issues as well as normal operations.
Other main tabs to choose from including Virtual Disk Actions that can go into much more depth on individual Virtual disks. This includes a Description, Size, Sector Size, Storage Profile, Hosts, Reserved space, as well as whether the virtual disk is healthy and/or mirrored or not. There are also more sub-tabs including Info, Settings, Paths, Snapshots, Rollbacks, Replication, Owned by, Performance, and Events.
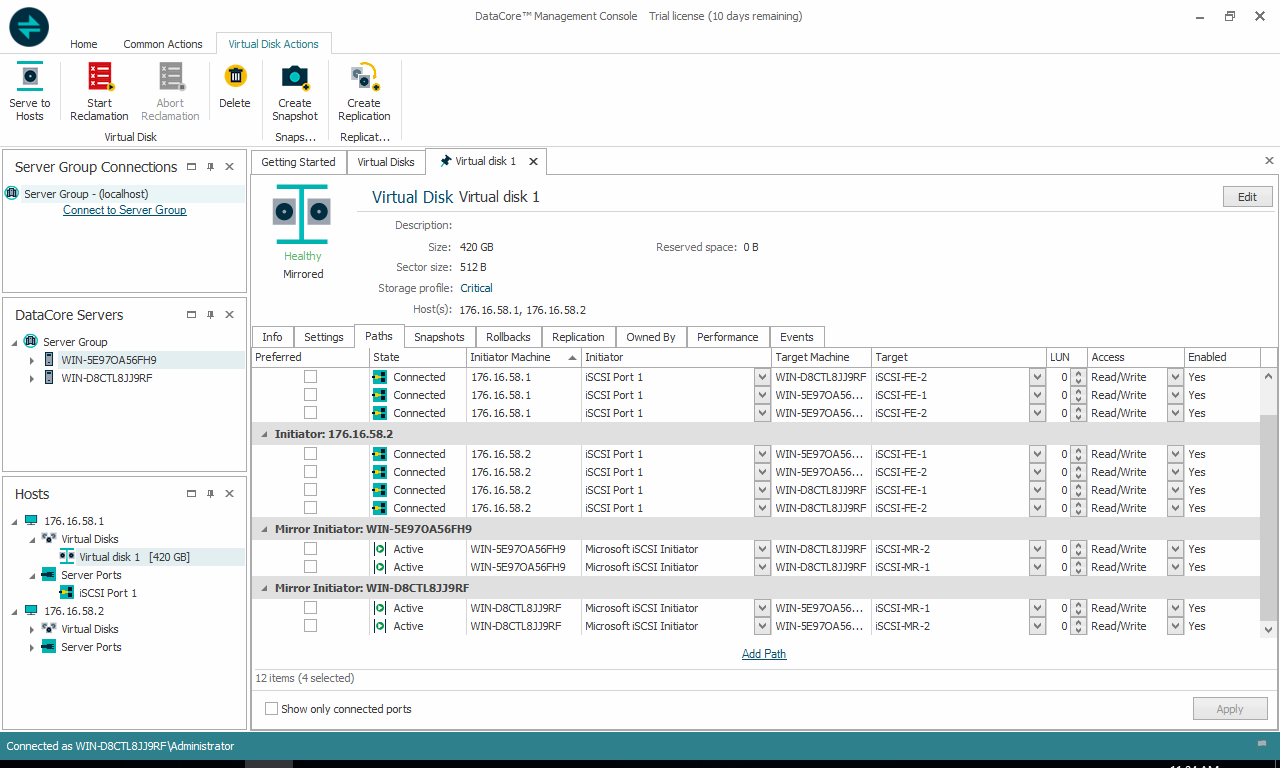
Clicking on the Paths sub-tab we can select the path for the virtual disk including preferred path, state, initiator machine, initiator, target machine, target, LUN, access, and whether or not it is enabled.
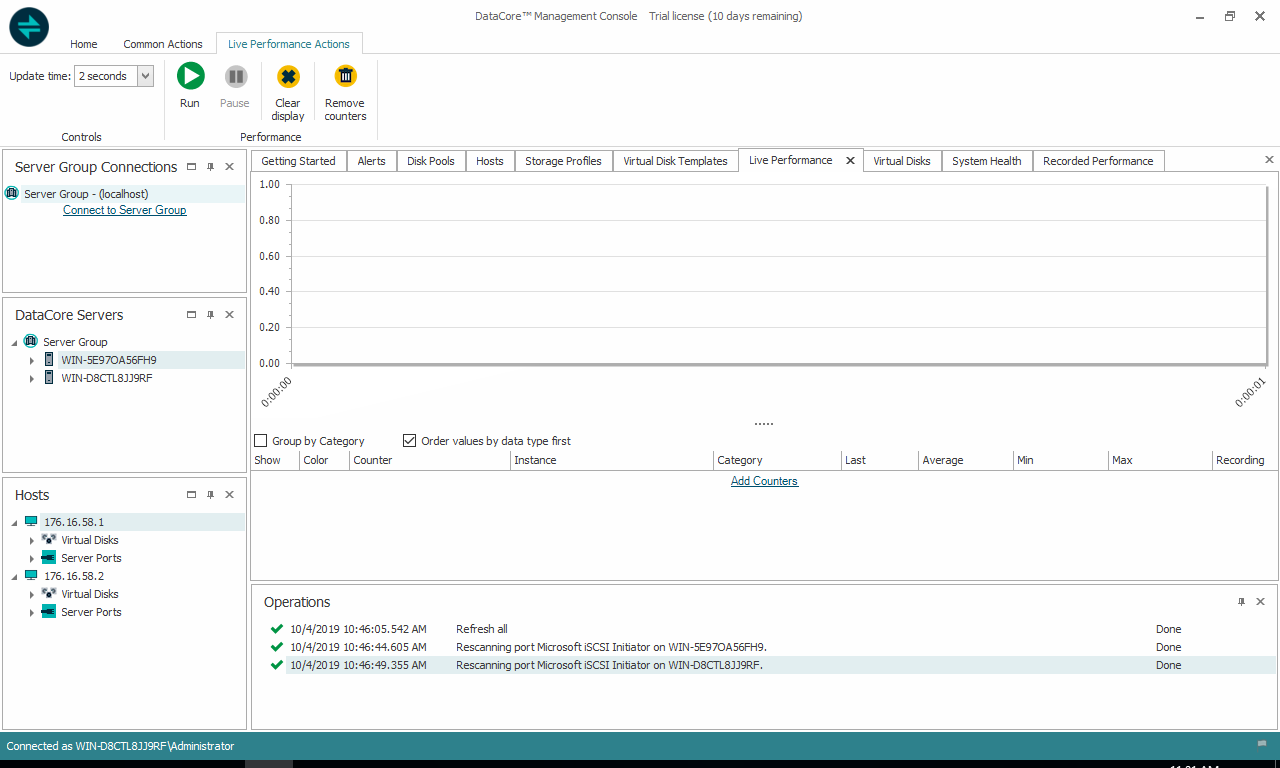
There is a Live Performance Actions main tab as well that allows user to see performance in real-time as well as take actions if need be.
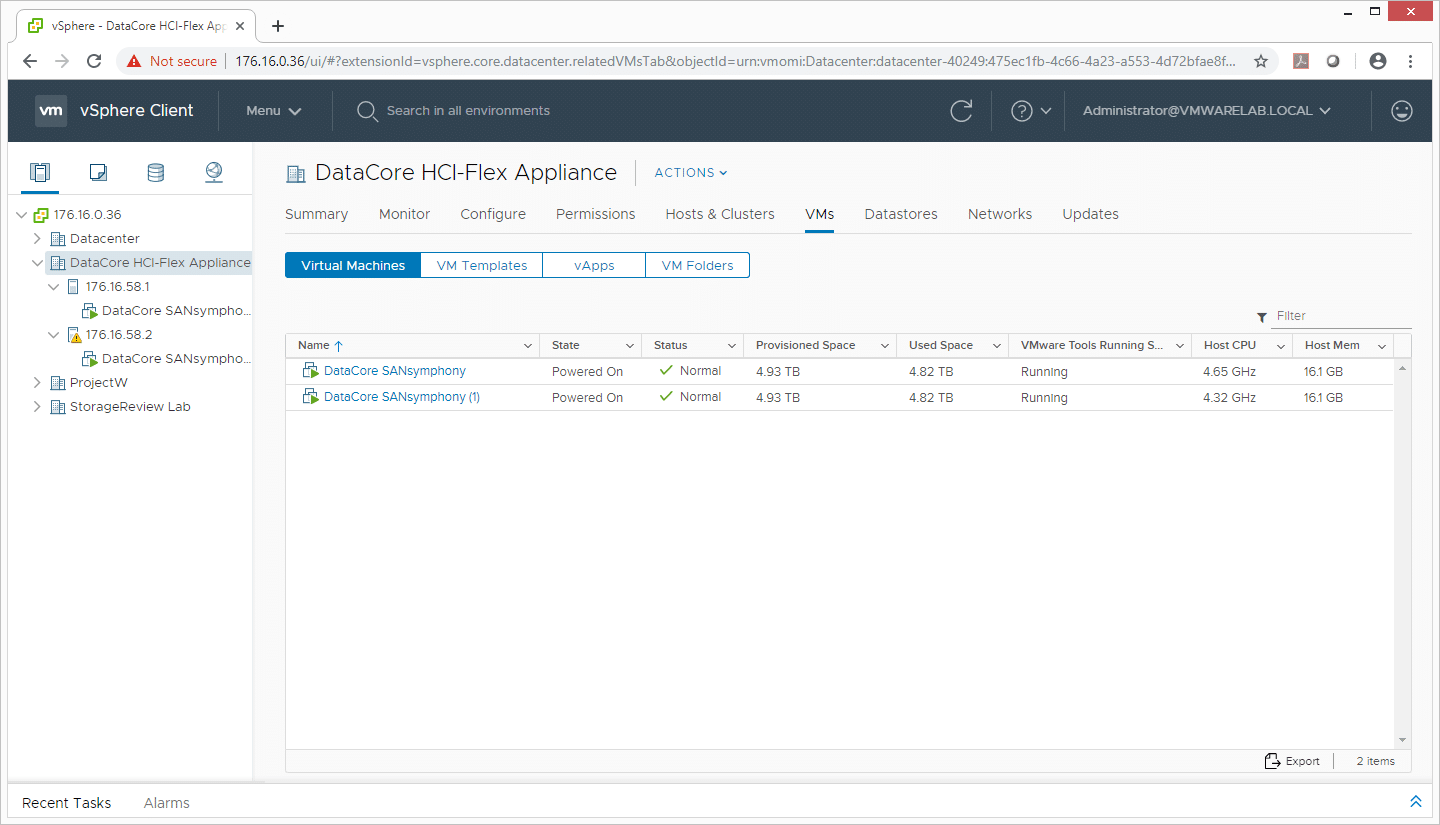
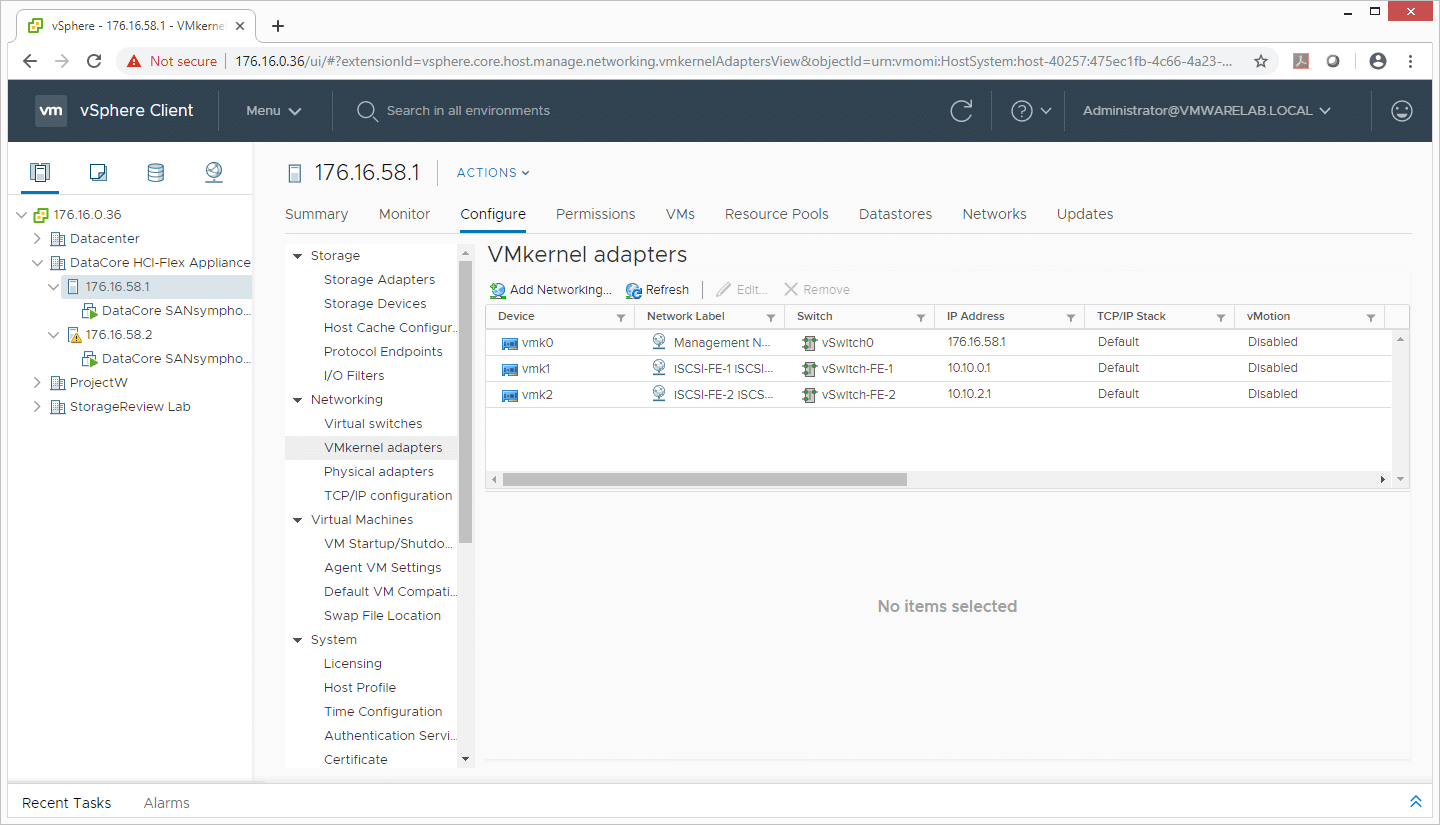
While the UI has all the bells and whistles one would need, there are many that would rather just keep using vSphere for their management needs, and this is easy to do as well. Here, users can view everything they need from the DataCore unit using the familiar interface.
Admins can drill down into hosts and configure VMkernel adapters. Here we can see the two front-end VMkernels used for serving out storage.
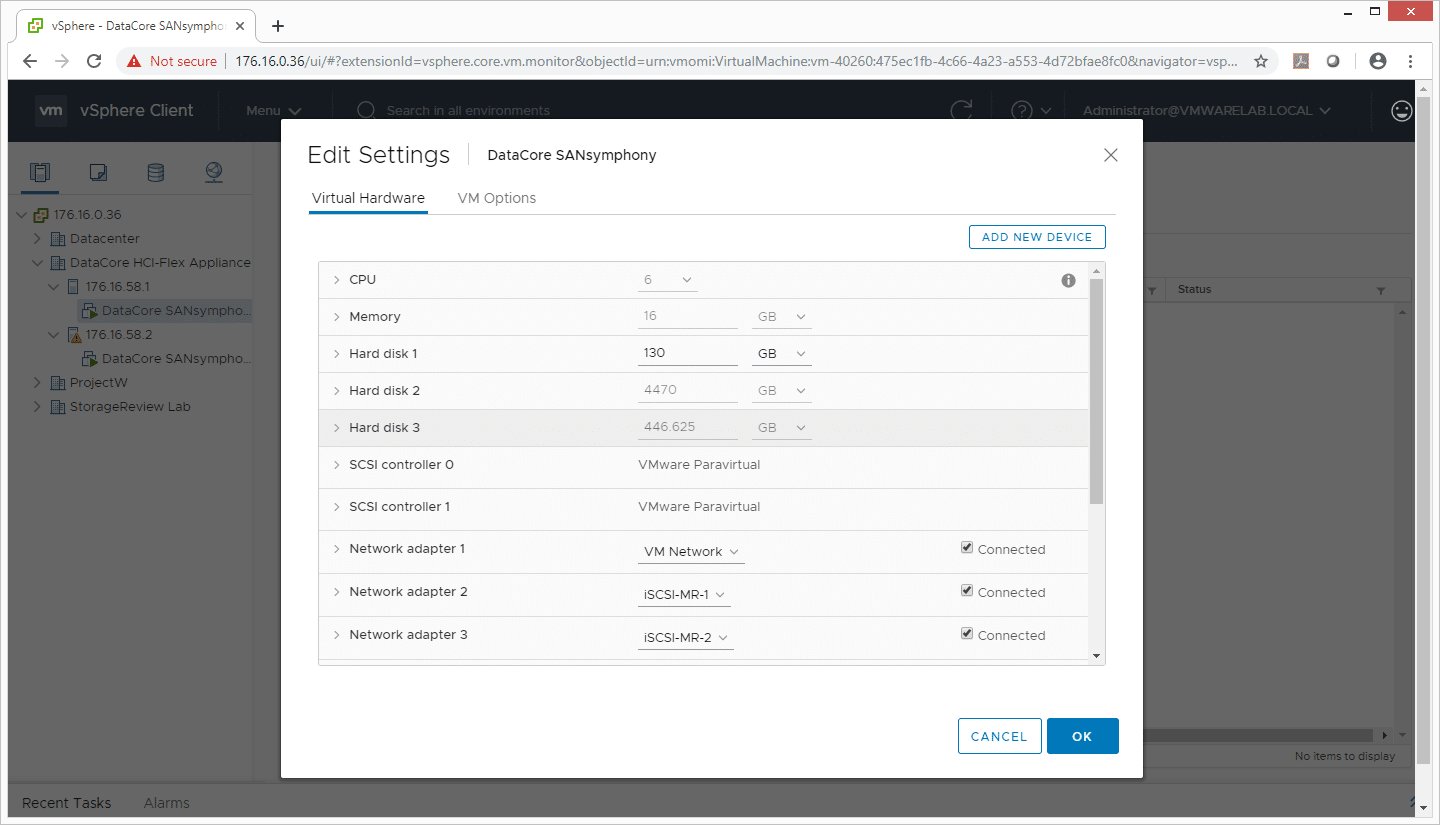
The footprint of the Datacore SANsymphony VMs is pretty lightweight, with 6 vCPUs provisioned and 16GB of memory. The 4,470GB hard disk 2 and 446GB hard disk 3 in this shot are the hard drives and SSDs shared up through the Dell servers to the Datacore platform.
DataCore HCI-Flex Appliance Configuration
Our Datacore HCI-Flex Appliance as shipped included three 2.4TB 7K HDDs as well as two 480GB SATA SSDs per node, giving us 5TB of capacity per node. With our two-node deployment in a mirrored configuration, this offered 5TB of usable capacity, 480GB of which is flash. For our benchmarks we adjusted the size of our VDbench workload to fit fully inside of flash. We attached 32 12GB vdisks to 16 VMs, giving us a total workload footprint of 384GB.
Performance
VDBench Workload Analysis
When it comes to benchmarking storage arrays, application testing is best, and synthetic testing comes in second place. While not a perfect representation of actual workloads, synthetic tests do help to baseline storage devices with a repeatability factor that makes it easy to do apples-to-apples comparison between competing solutions. These workloads offer a range of different testing profiles ranging from “four corners” tests, common database transfer size tests, as well as trace captures from different VDI environments. All of these tests leverage the common vdBench workload generator, with a scripting engine to automate and capture results over a large compute testing cluster. This allows us to repeat the same workloads across a wide range of storage devices, including flash arrays and individual storage devices.
Profiles:
- 4K Random Read: 100% Read, 128 threads, 0-120% iorate
- 4K Random Write: 100% Write, 64 threads, 0-120% iorate
- 64K Sequential Read: 100% Read, 16 threads, 0-120% iorate
- 64K Sequential Write: 100% Write, 8 threads, 0-120% iorate
- Synthetic Database: SQL and Oracle
- VDI Full Clone and Linked Clone Traces
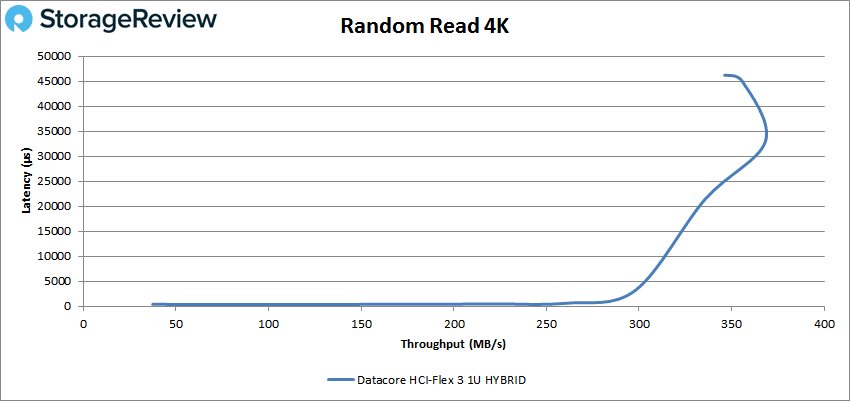
Starting with peak random 4K read performance, the DataCore HCI-Flex Appliance started at 9,591 IOPS with a latency of 412μs and went on to peak at 91,091 IOPS at a latency of 44.9ms.
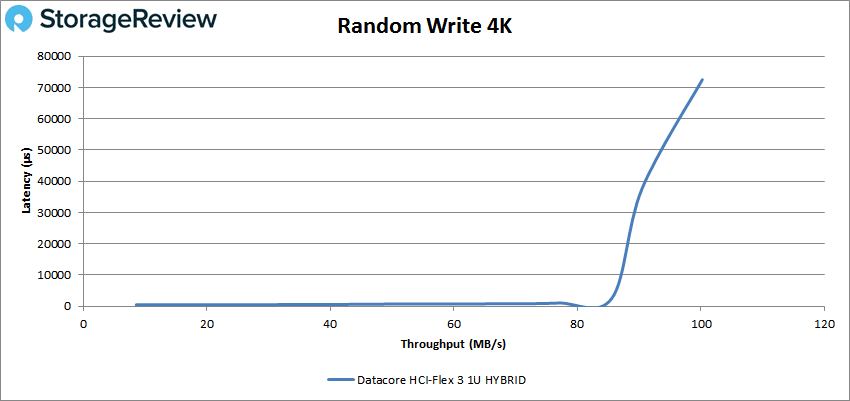
Looking at 4K write performance, the HCI-Flex Appliance started at 2,199 IOPS with a latency of 468μs; it peaked at 25,663 IOPS with a latency of 72.5ms.
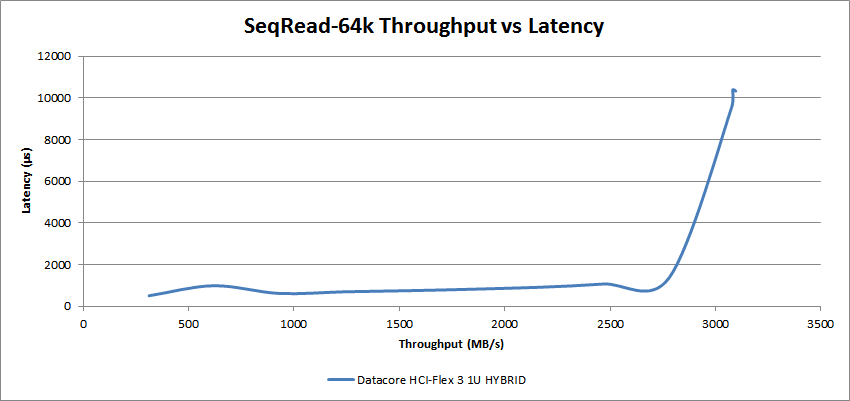
Switching over to sequential workloads, we look at peak 64K read performance, and here the HCI-Flex Appliance started at 5,001 IOPS or 312MB/s with a latency of 509μs. The appliance went on to peak at 49,536 IOPS or 3.1GB/s at a latency of 10.32ms.
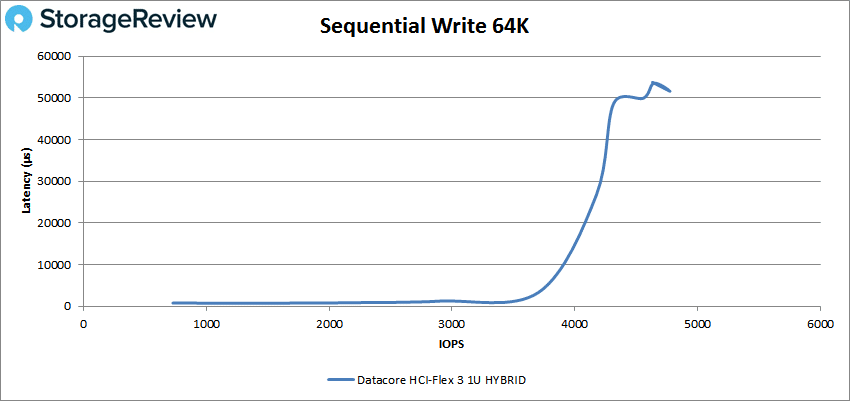
In 64K sequential write, the DataCore HCI-Flex Appliance started at 730 IOPS or 46MB/s with a latency of 783μs. The appliance later peaked at 4,772 IOPS or 298MB/s with a latency of 51.6ms.
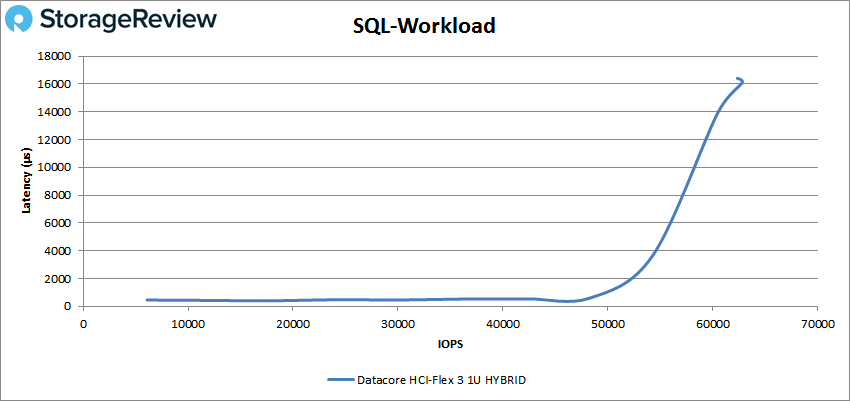
Our next set of tests are our SQL workloads: SQL, SQL 90-10, and SQL 80-20. For SQL the HCI-Flex Appliance started at 6,086 IOPS with a latency of 452μs and went on to peak at 62,819 IOPS with a latency of 16ms.
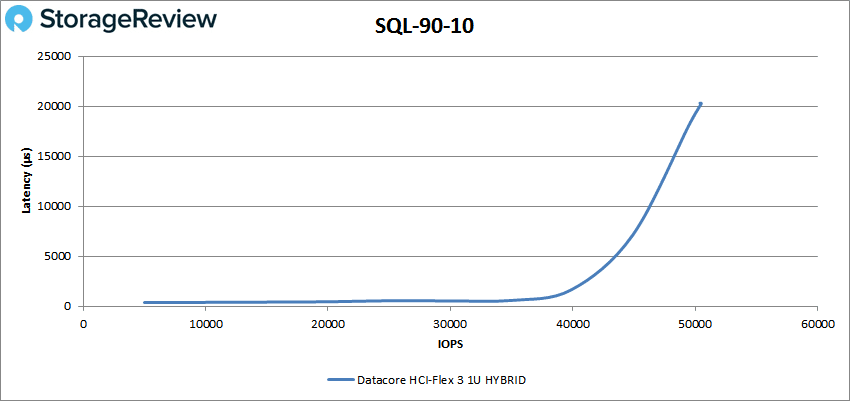
For SQL 90-10 the HCI-Flex Appliance started at 5,003 IOPS with a latency of 379μs and it had a peak performance of 50,500 IOPS with a latency of 20.1ms.
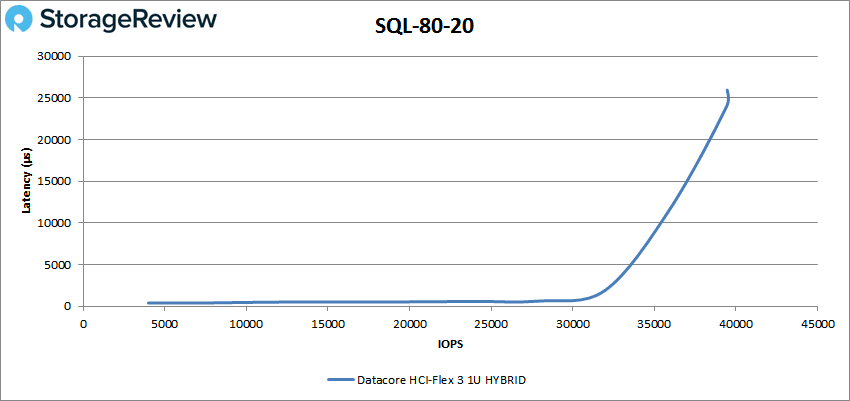
Our last SQL test, the 80-20, saw the DataCore appliance started at 3,996 IOPS with a latency of 396μs and later hitting a peak performance of 39,465 IOPS with a latency of 26ms.
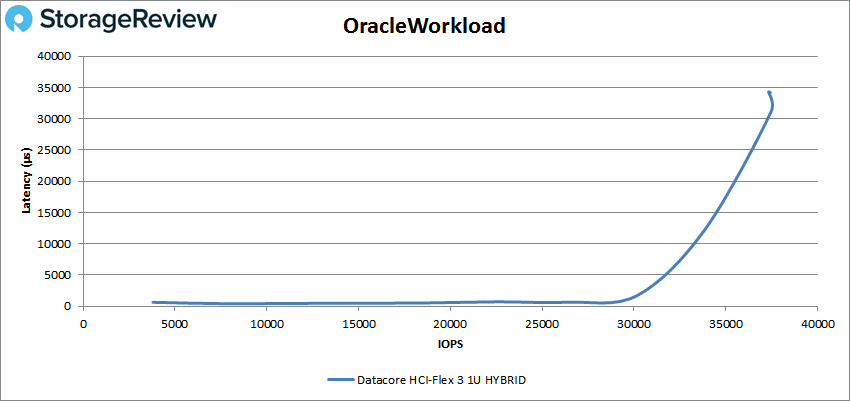
Next up are our Oracle workloads: Oracle, Oracle 90-10, and Oracle 80-20. With Oracle, the DataCore HCI-Flex Appliance started at 3,799 IOPS with 650μs latency and peaked at 37,473 IOPS with a latency of 31ms.
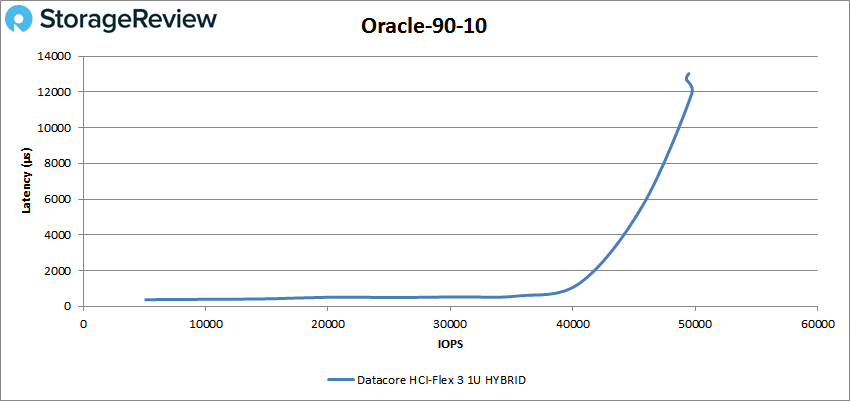
In Oracle 90-10, the appliance started at 172,788 IOPS at a latency of 161μs. The HCI-Flex Appliance went on a peak at 49,736 with a latency of 12ms.
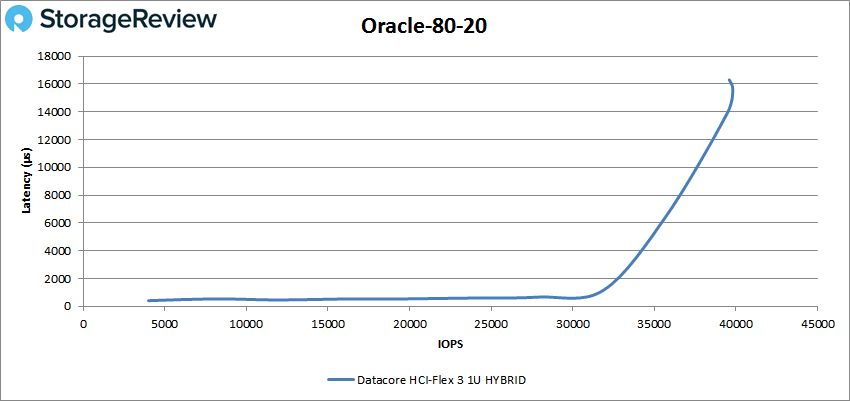
For Oracle 80-20, the DataCore appliance started at 4,000 IOPS at a latency of 409μs and went on to peak at 39,808 IOPS with a latency of 15.5ms
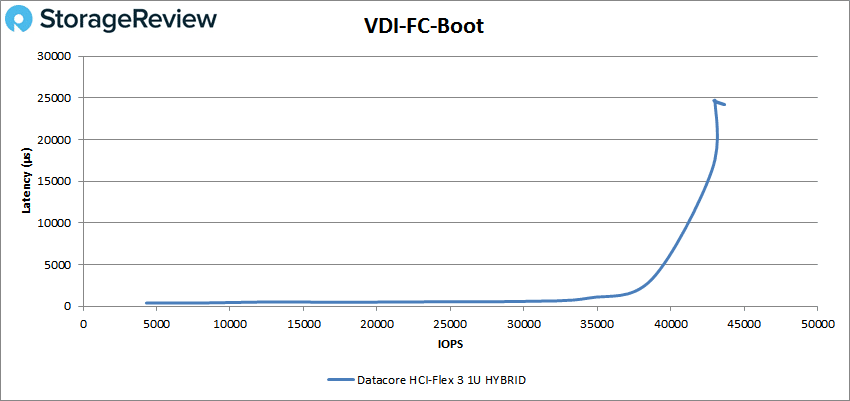
Next, we switched over to our VDI clone test, Full and Linked. For VDI Full Clone (FC) boot, the DataCore appliance started at 4,303 IOPS at a latency of 398μs and had a peak performance of 43,660 IOPS at a latency of 24ms.
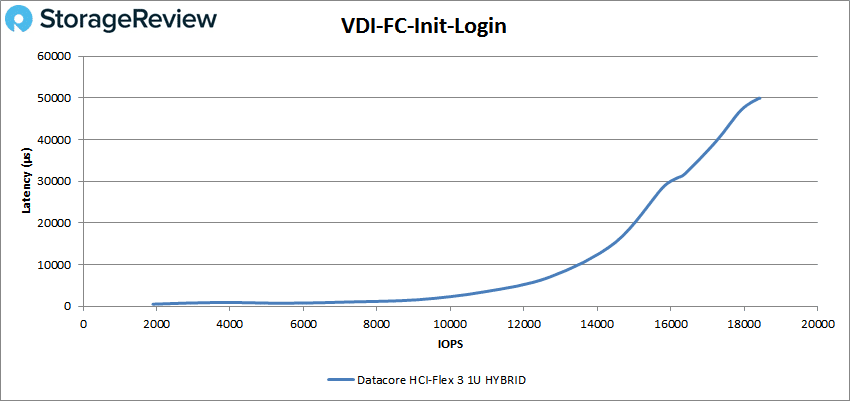
With the VDI Full Clone Initial Login, the DataCore appliance started at 1,901 IOPS at a latency of 520μs and peaked at 18,429 IOPS with 49.9ms latency.
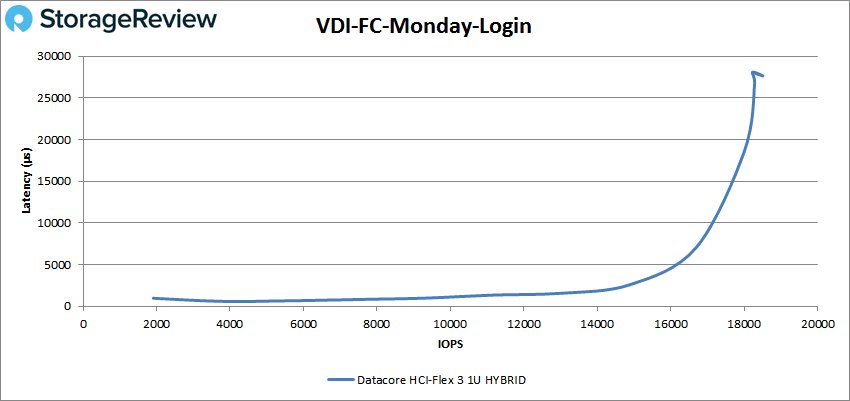
For VDI FC Monday Login the appliance started at 1,908 IOPS at a latency of 972.5µs and peaked at 18,512 IOPS with a latency of 28ms.
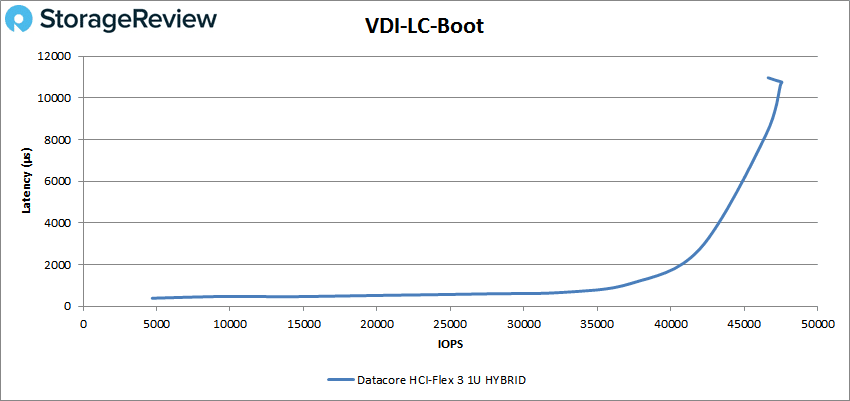
Switching over to the VDI Linked Clone (LC), in the boot test, the DataCore HCI-Flex Appliance started with a performance of 4,703 IOPS at a latency of 388µs and hit a peak of 47,578 IOPS with a latency of 10.7ms.
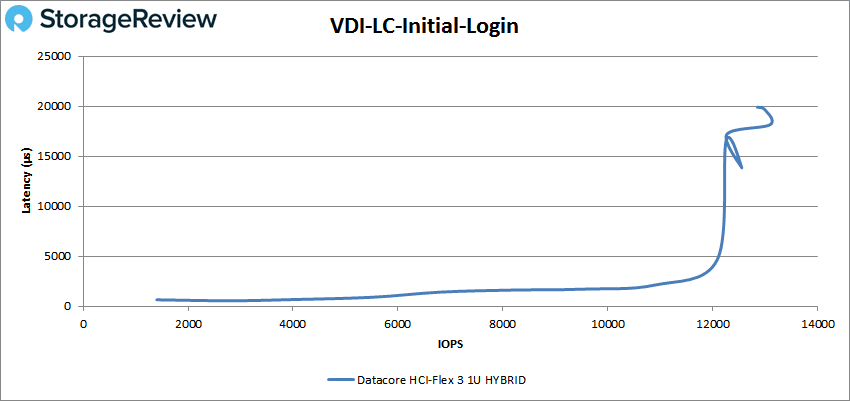
With VDI LC Initial Login the DataCore appliance started 1,403 IOPS with 655µs latency and it peaked at 13,097 IOPS at 18ms latency.
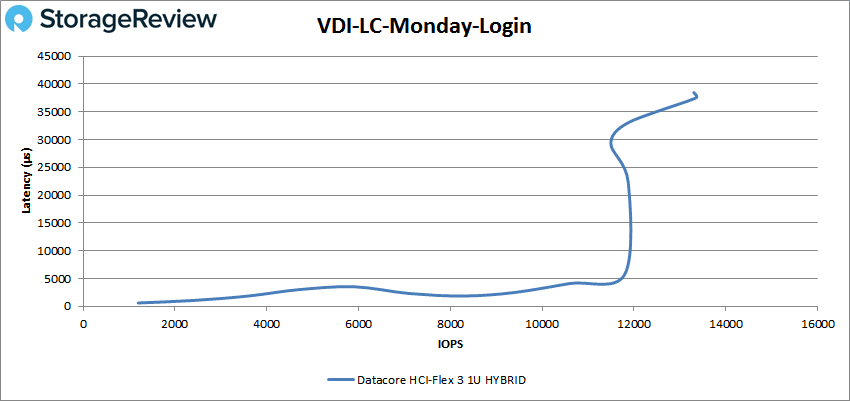
Finally, we look at VDI LC Monday Login where the appliance started at 1,199 IOPS at a latency of 610μs and hit a peak of 13,351 IOPS with a latency of 37.5ms.
Conclusion
DataCore is an industry veteran at 21 years of operation. While more known for its SANsymphony storage virtualization software, the company is growing and changing with the times and is now releasing HCI appliances with its DataCore HCI-Flex Appliance. HCI-Flex Appliance combines DataCore’s SDS with HCI to give users the full promise of their hyperconverged infrastructure. DataCore HCI-Flex comes pre-installed with either VMware vSphere or Microsoft Hyper-V that they claim will result in deployment in under an hour, though there are automation elements to this to speed the process. The appliances come in either 1U or 2U form factors and can scale up and out to 64 nodes.
Looking at performance of the smaller hybrid configuration with two SATA SSDs per node, we put the DataCore HCI-Flex Appliance through the paces in our VDBench tests. In our 4K random tests the appliance hit a peak of 91K IOPS read and 25.7K IOPS write. For sequential workloads we saw 3.1GB/s read 298MB/s write in our 64K tests. For SQL the HCI-Flex Appliance had peak scores of 63K IOPS, 50.5K IOPS SQL 90-10, and 39K IOPS for SQL 80-20. For our Oracle tests the HCI hit a peak of 37K IOPS, 50K IOPS in 90-10, and 40K IOPS in 80-20. Looking at our VDI the HCI appliance hit peaked of 44K IOPS, 18K IOPS, and 18.5K IOPS in our FC Boot, Initial Login, and Monday Login respectively. For LC we saw 48K IOPS boot, 13K IOPS Initial Login, and 13K IOPS Monday Login.
DataCore’s HCI-Flex Appliance is the marriage of HCI and SDS to give users more flexibility when leveraging HCI. The appliance also comes with DataCore Insight Services (DIS), a predictive analytics platform that helps issues get corrected before they begin, which highlights many of the software improvements DataCore has made over the years. Additionally, the redesigned UI is easy to use with enough depth to monitor every aspect needed. The performance we saw was good for the build we were given, however users should expect to see much higher performance on models like the HCI-Flex-7 SSD with the higher RAM count; this review is of an entry-level system. Even so, the cluster did well to harness the little bit of flash it had, we’re talking SATA SSDs here. As such, small businesses and other remote outposts that are budget or operationally limited may find a lot to like from this small HCI-Flex build.
Sign up for the StorageReview newsletter