

The Dell PowerEdge T560 Tower Server is purpose-built for on-premise IT, virtualization, database management, AI inferencing, private cloud, and more. It’s powered by fourth-generation Intel Xeon Scalable CPUs and supports 24 storage drives.
Dell PowerEdge T560 Tower Server Specifications
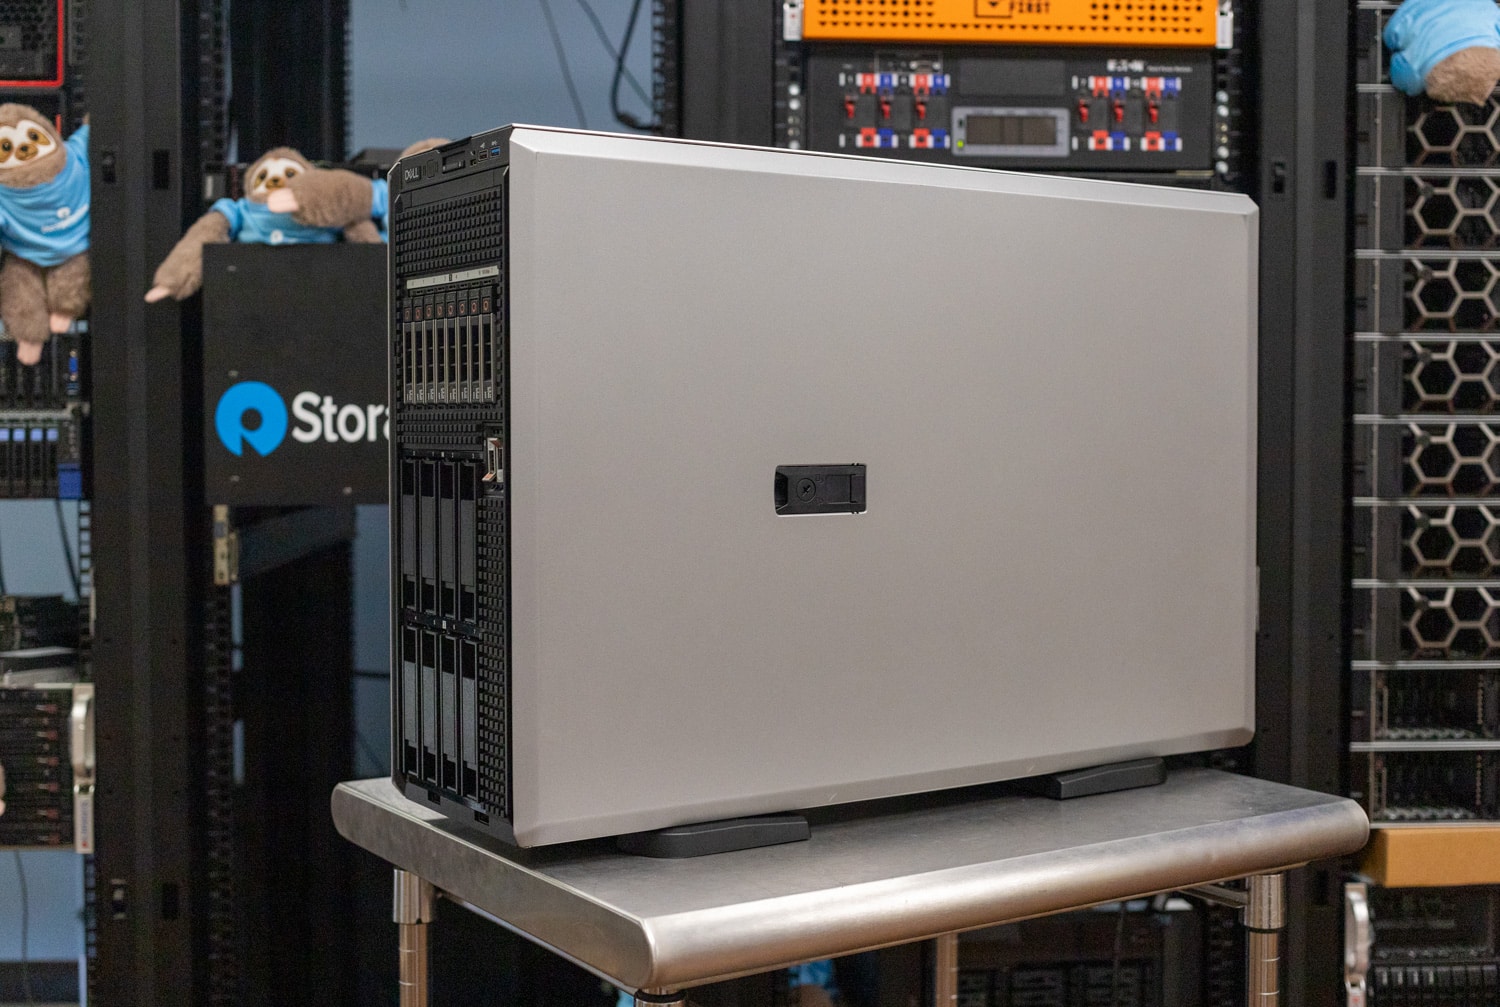
Rack servers aren’t practical for every business, especially if you don’t have a data center. This is doubly true at the edge where the notion of a traditional server room is non-existent. That’s where the PowerEdge T560 Tower Server comes in, with an office-friendly (low noise) design. The larger chassis also allows some unique configurations that aren’t possible on rack-mount servers, such as mixing 2.5″ bays with 3.5″ bays on the front backplane.
The T560 supports two 32-core fourth-generation Intel Xeon Scalable processors (“Sapphire Rapids”), 1TB of memory (16 RDIMM slots), and many possible combinations of drives. It’s no small tower in that sense, equating to 4.5U in a rack, and supporting eight cooling fans.
This tower also has tons of expansion with six PCIe slots, two of which are x16 Gen5. It fits two double-wide 300-watt GPUs or six single-slot 75-watt GPUs.
The PowerEdge T560’s full specifications are as follows:
| Processor | Up to two 4th generation Intel Xeon Scalable processors, up to 32 cores per socket |
| Memory |
|
| Storage Controllers |
|
| Drive Bays | Front Bays:
|
| Power Supplies |
|
| Fans | Up to eight Standard (STD) fans or High performance (HPR) fans |
| Dimensions | Height — 464.0 mm (18.26 inches) (with feet)
Width — 200.0 mm (7.87 inches)
|
| Form Factor | 4.5U tower server |
| Embedded Management |
|
| OpenManage Software |
|
| Mobility | OpenManage Mobile |
| OpenManage Integrations |
|
| Security |
|
| Embedded NIC | 2 x 1GbE LOM on Planar |
| Network Options | 1 x OCP x8 card 3.0
Note: The system allows both LOM on planar and OCP card to be installed on the system |
| GPU Options | Up to 2 x 300 W DW or 6 x 75 W SW |
| Ports | Front:
Rear:
Internal:
|
| PCIe | Up to six PCIe slots:
|
| Operating System and Hypervisors |
|
Dell PowerEdge T560 Tower Server Build and Design
Tower servers are rarely small and the PowerEdge T560 certainly isn’t, at 18.3 by 7.9 by 26.7 inches (HWD). This 4.5U tower is impressive from every angle, starting on the front with its hot-swap drive bays. Ours has eight 2.5- and eight 3.5-inch bays, with two M.2 RAID-able redundant BOSS drives on the right.
Front ports include one USB 2.0, one USB 3.0, and an iDRAC Direct (Micro-AB USB) port.
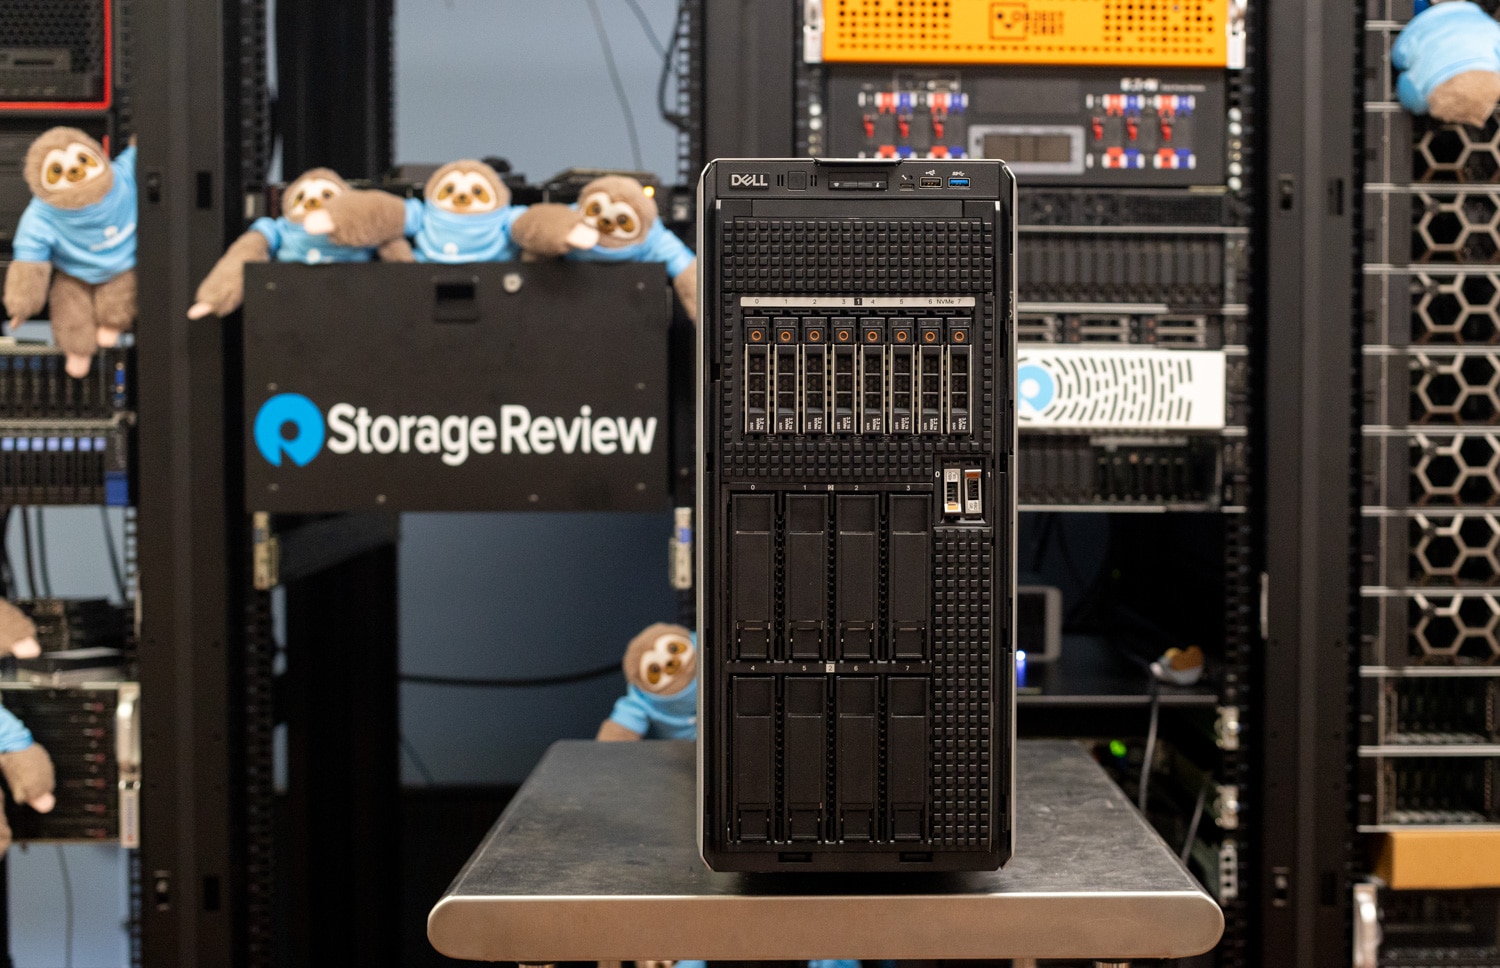
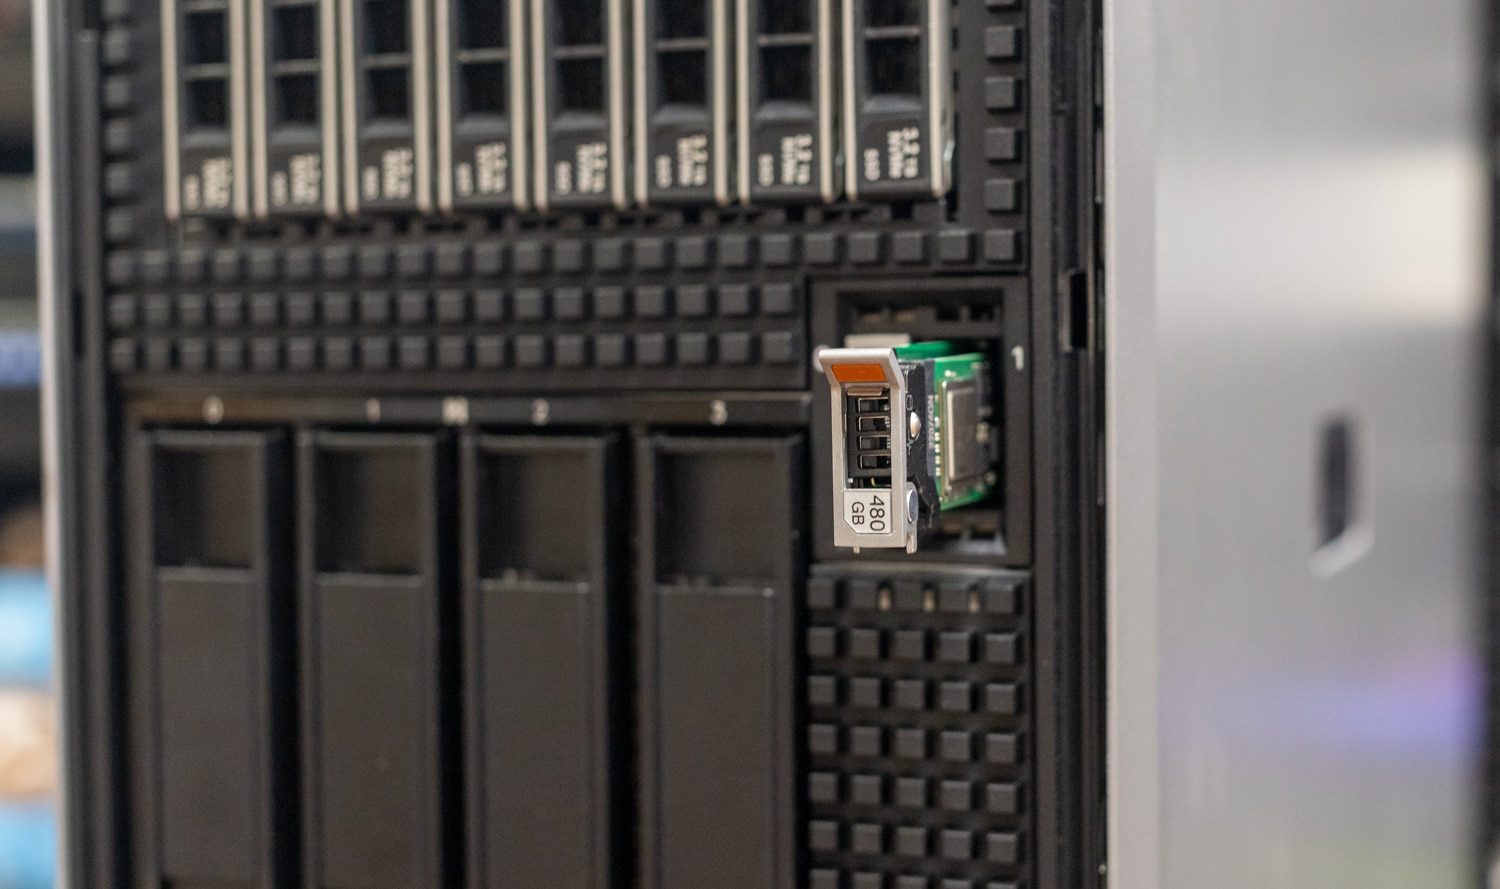
To the right of the 3.5-inch drive bays are the NVMe M.2 boot drives.
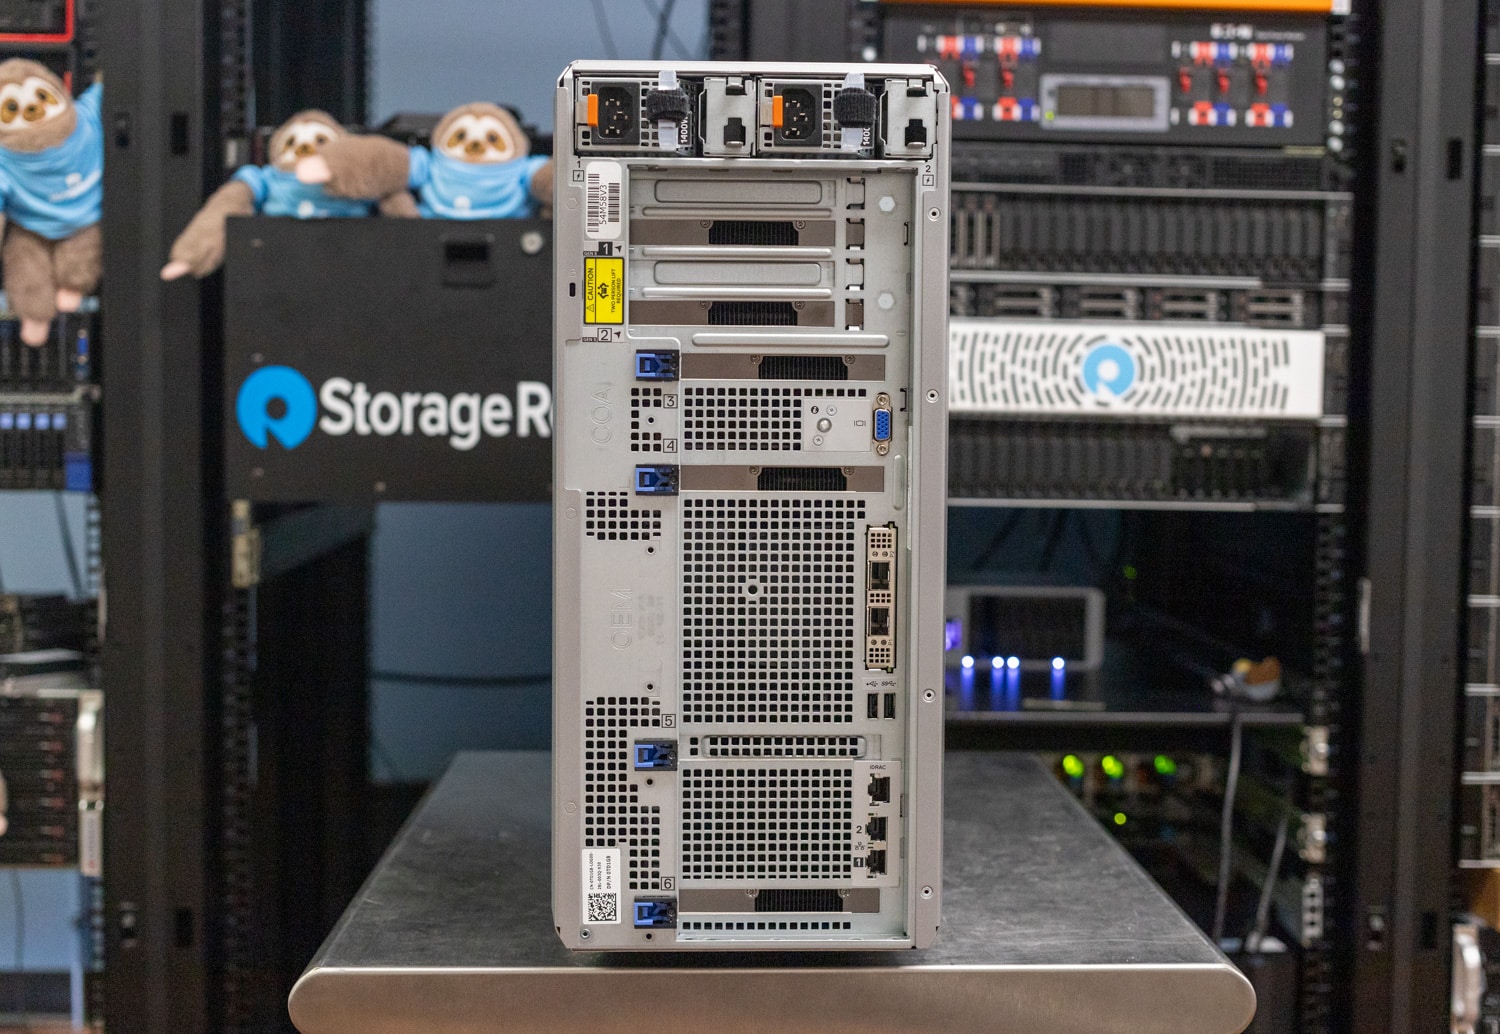
On the rear, the tower has one USB 2.0, one USB 3.0, an optional serial port, 1GbE for iDRAC, one VGA, and two Ethernet ports and OCP slot. Another USB 3.0 port is optional.
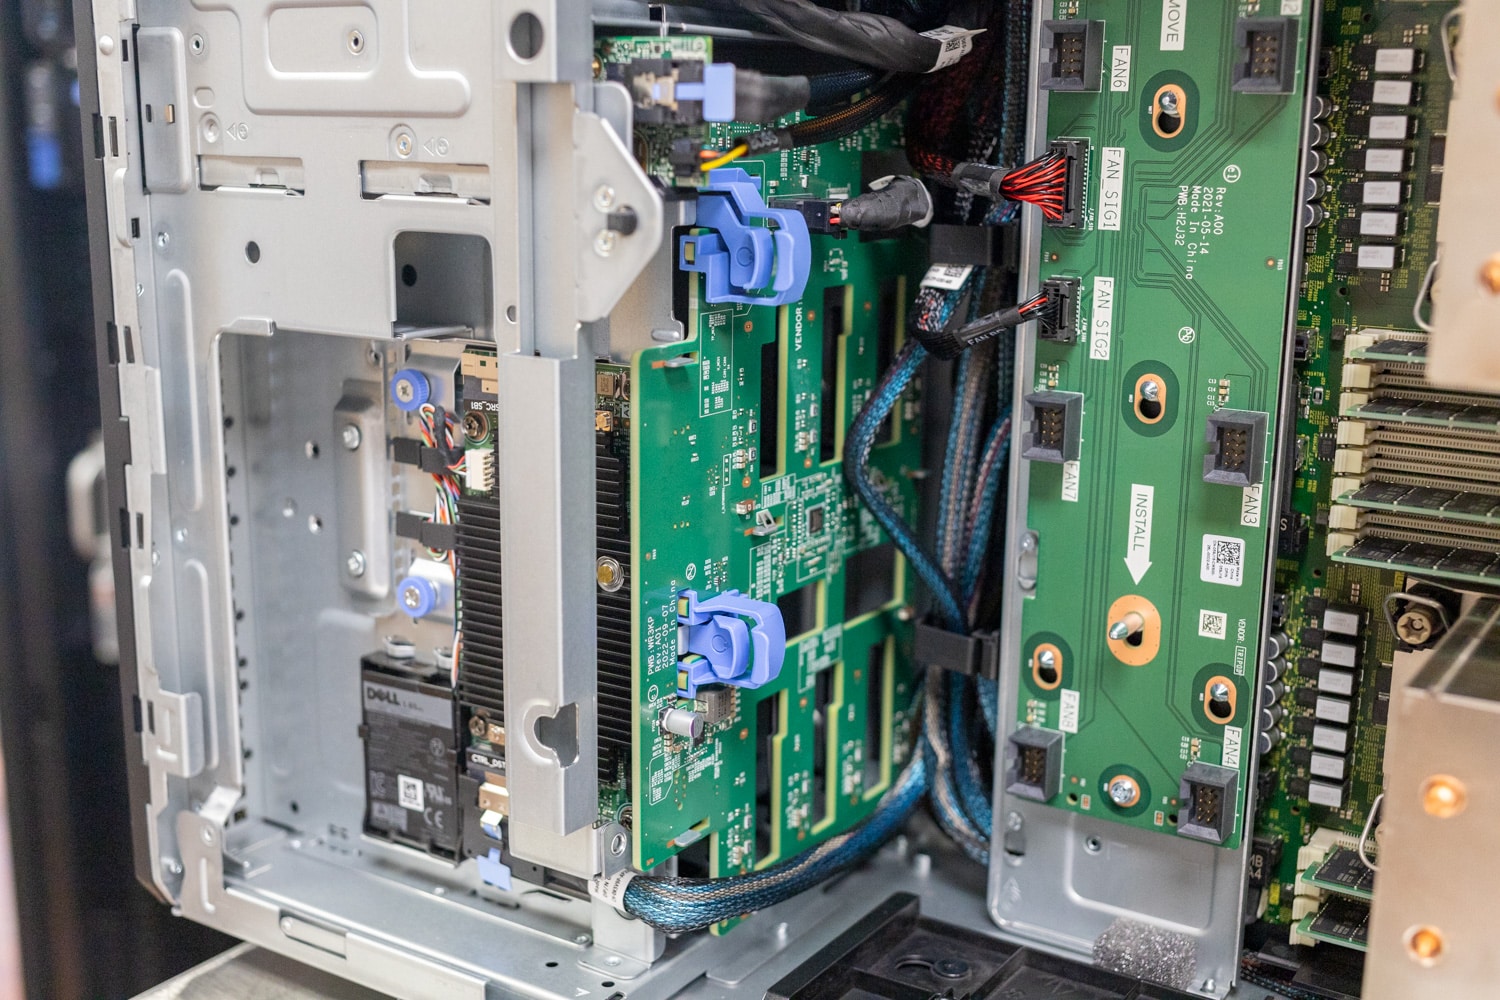
The tower’s side door is removed for interior access; the layout looks much like a standard server turned on its side. Most of the interior is covered with a massive airflow guide.
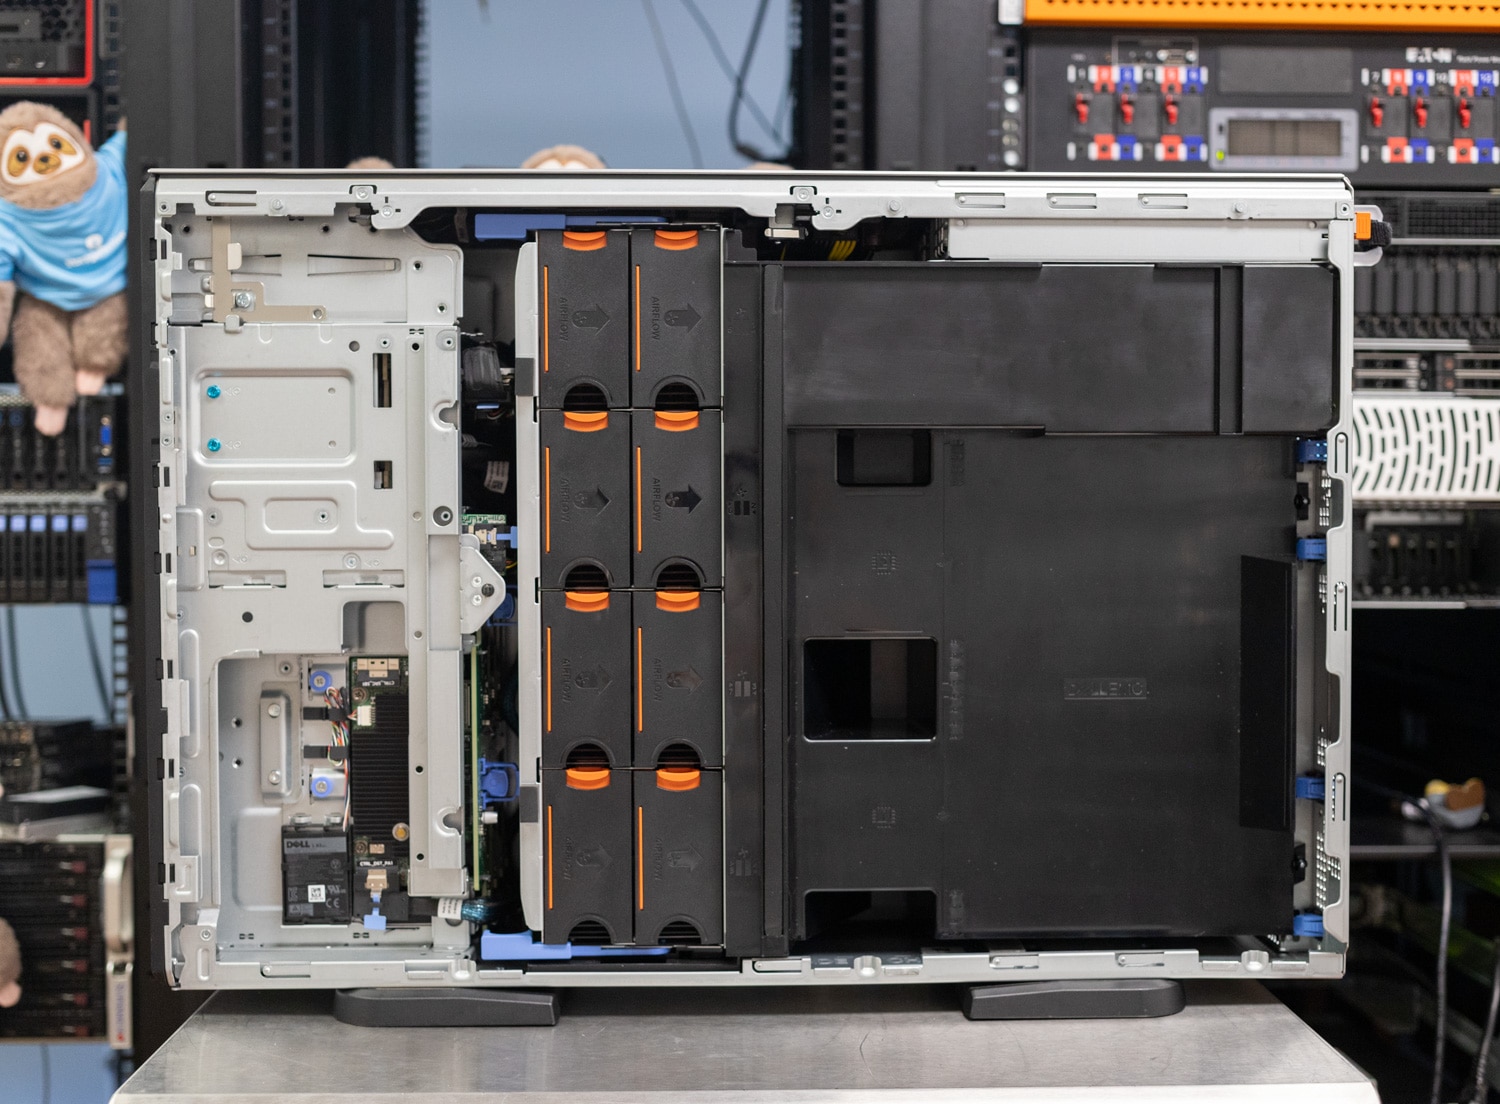
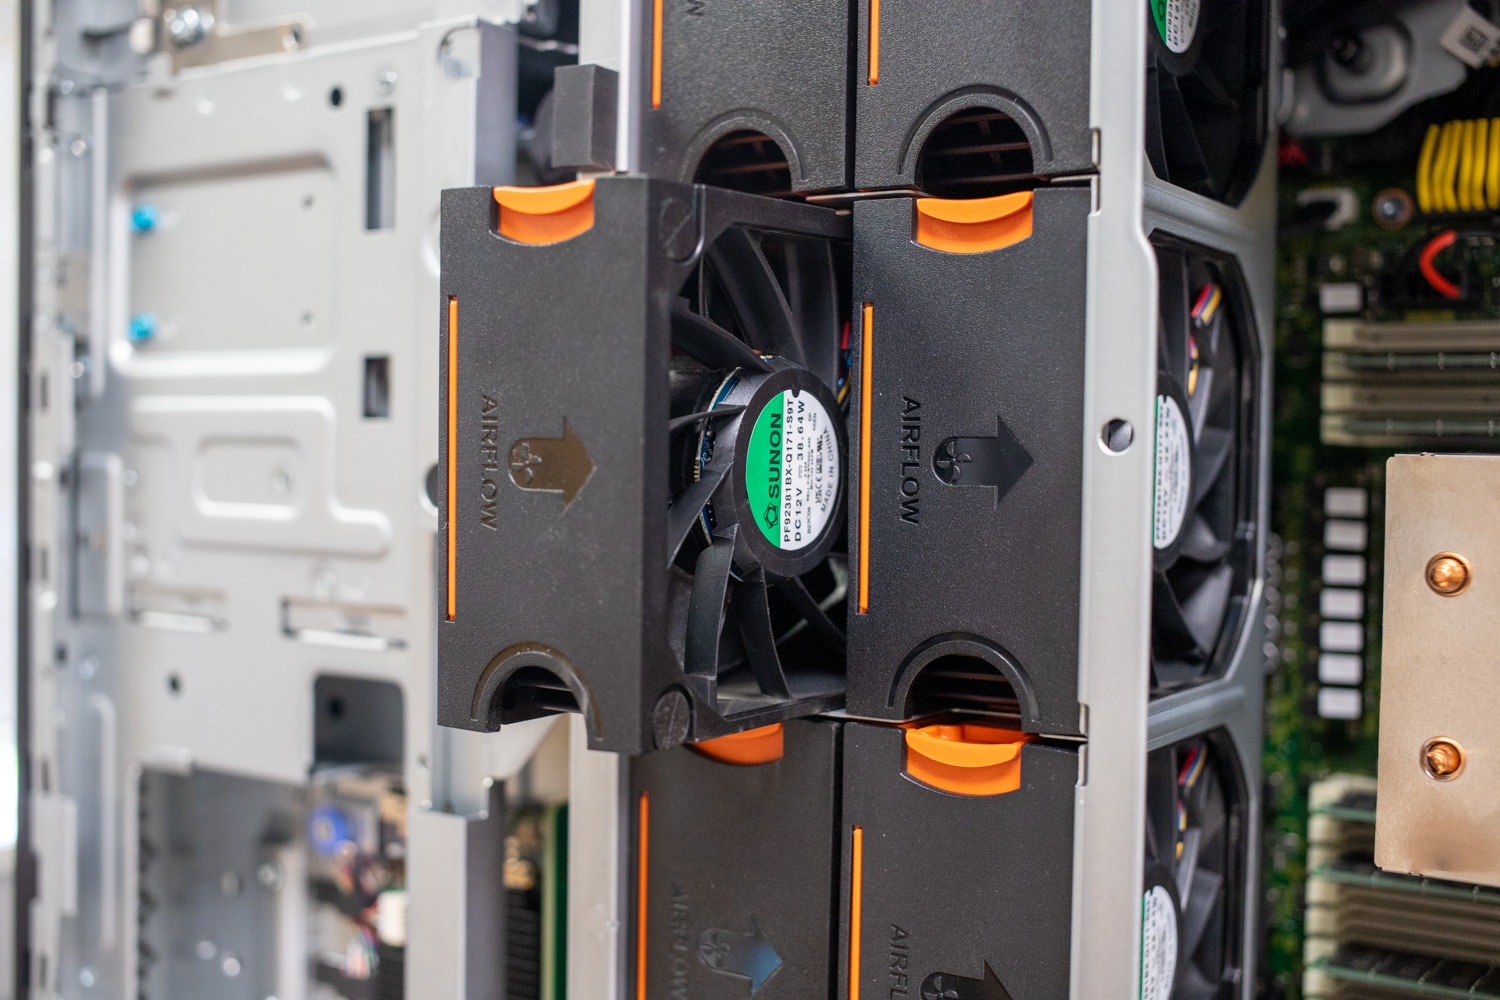
Eight hot-swap fans go down the centerline; squeezing the orange tabs allows them to come free.
Each Xeon CPU has a huge tower-style heatsink and is flanked by eight DIMM slots. The T560 supports up to 1TB of total RAM.
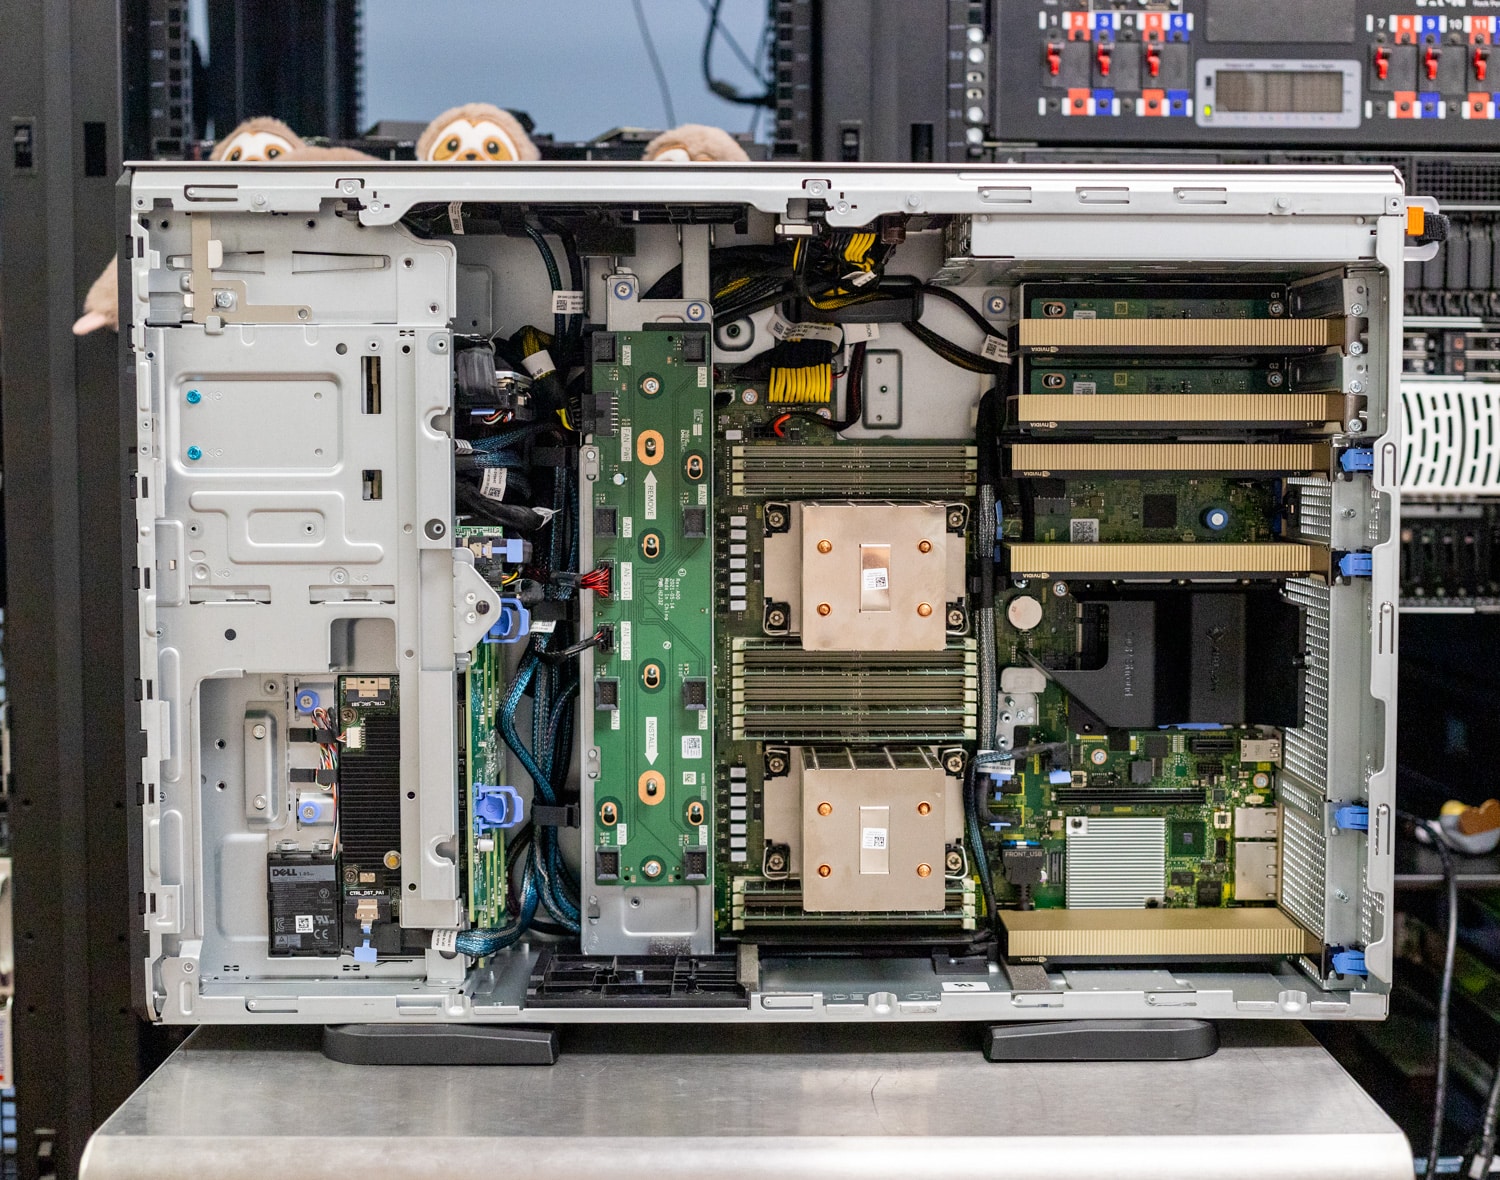
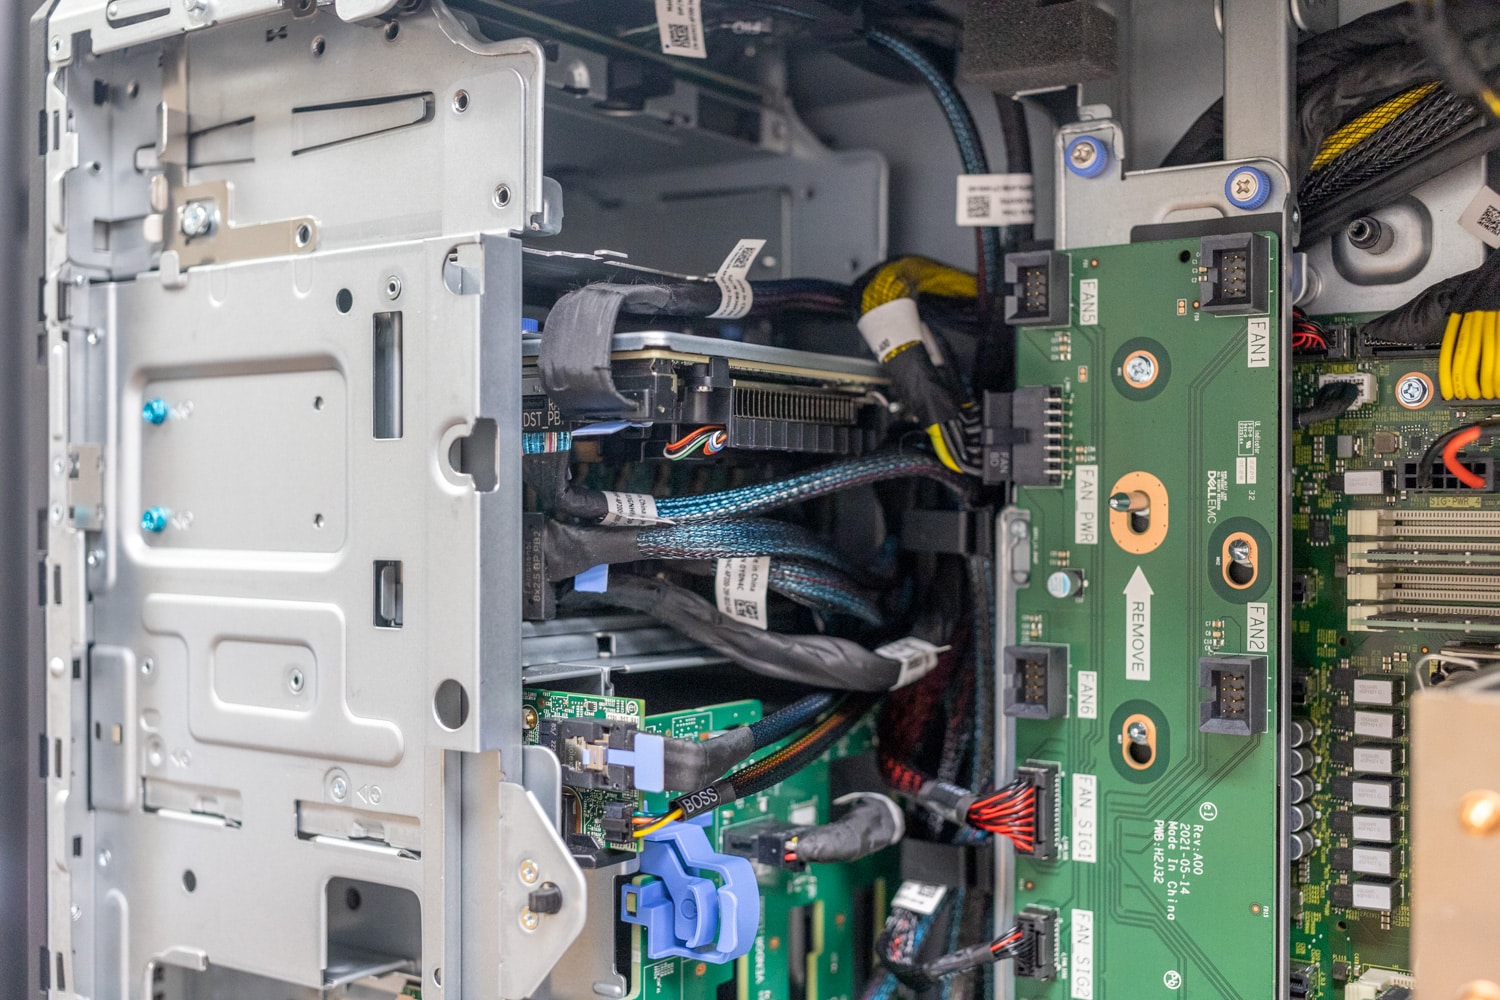
Here are views behind the drive bays, including the NVMe RAID card, there’s a second card in this build for the HDDs.
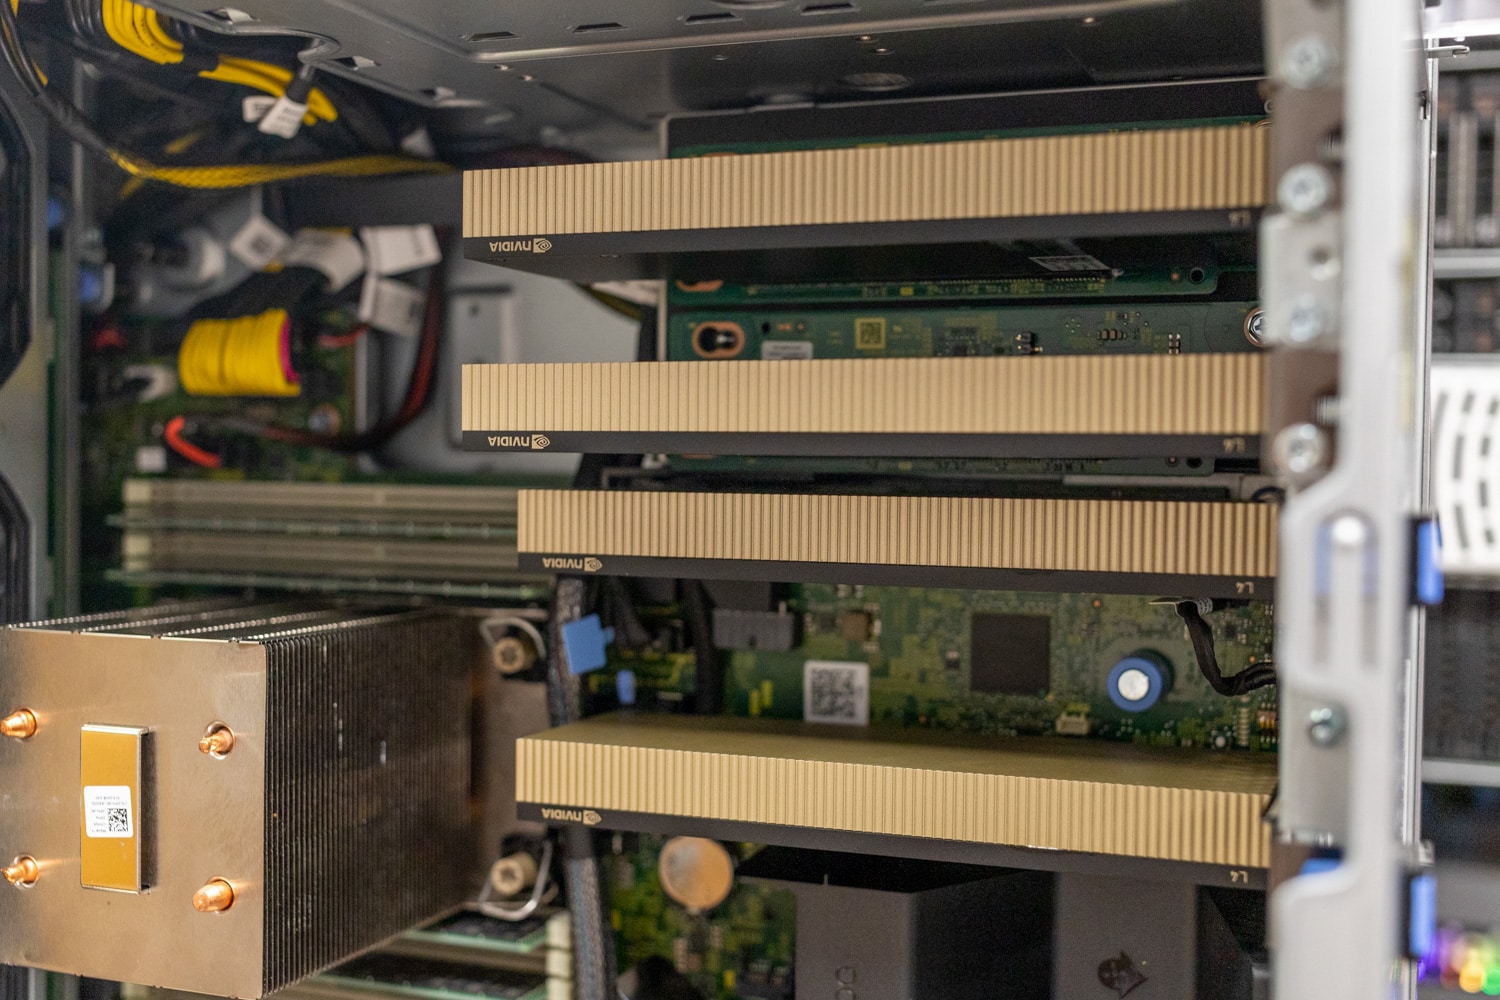
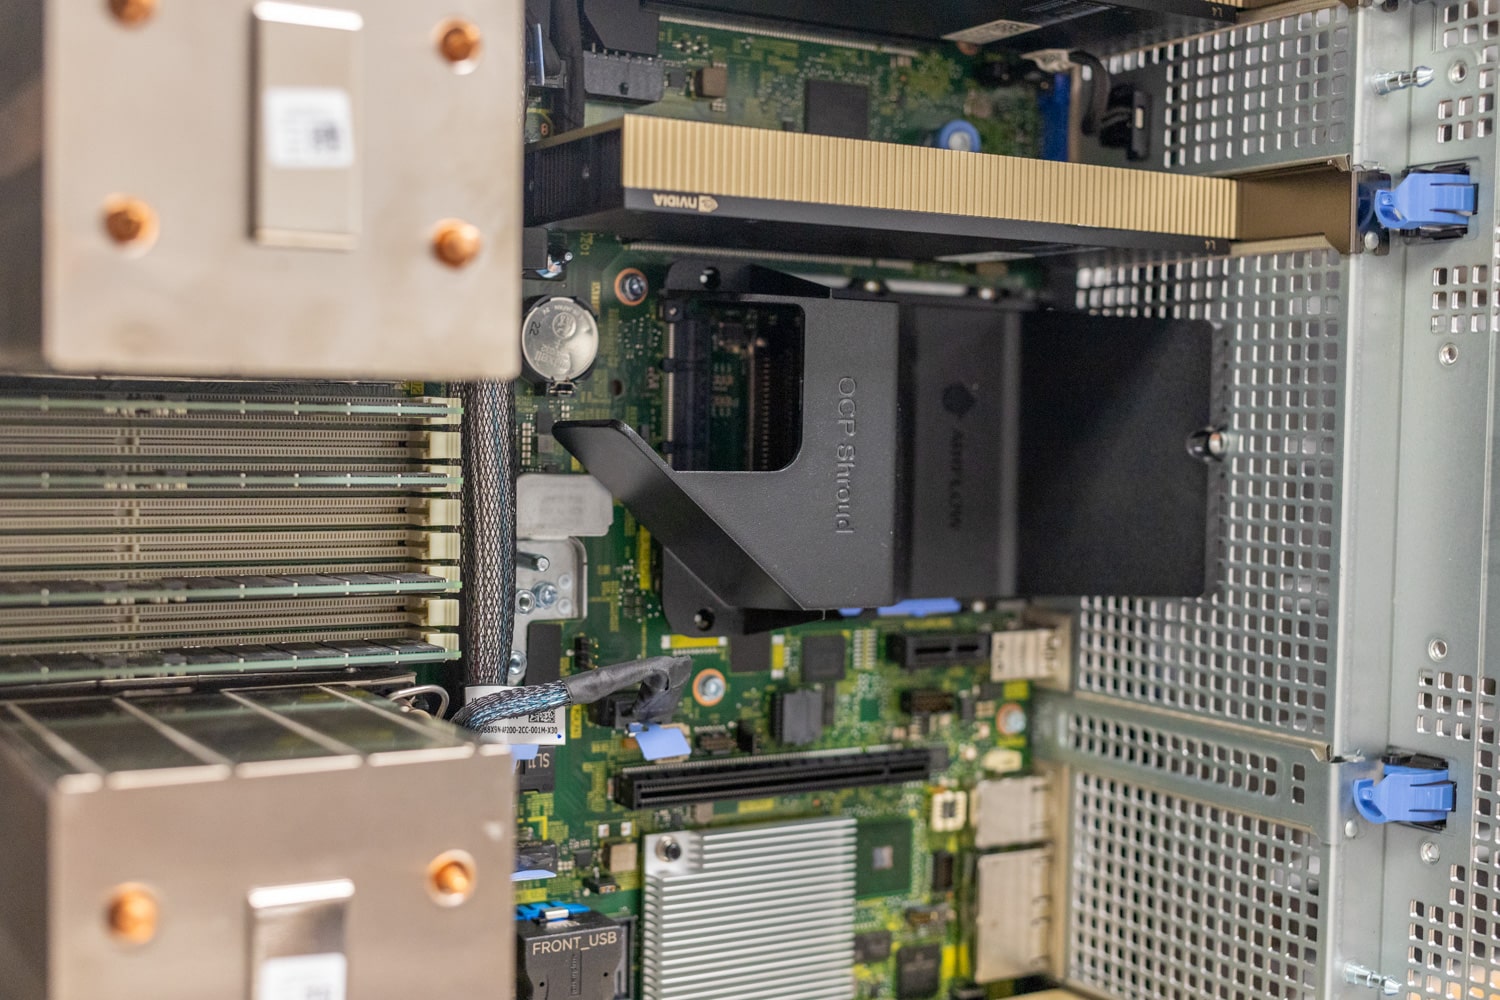
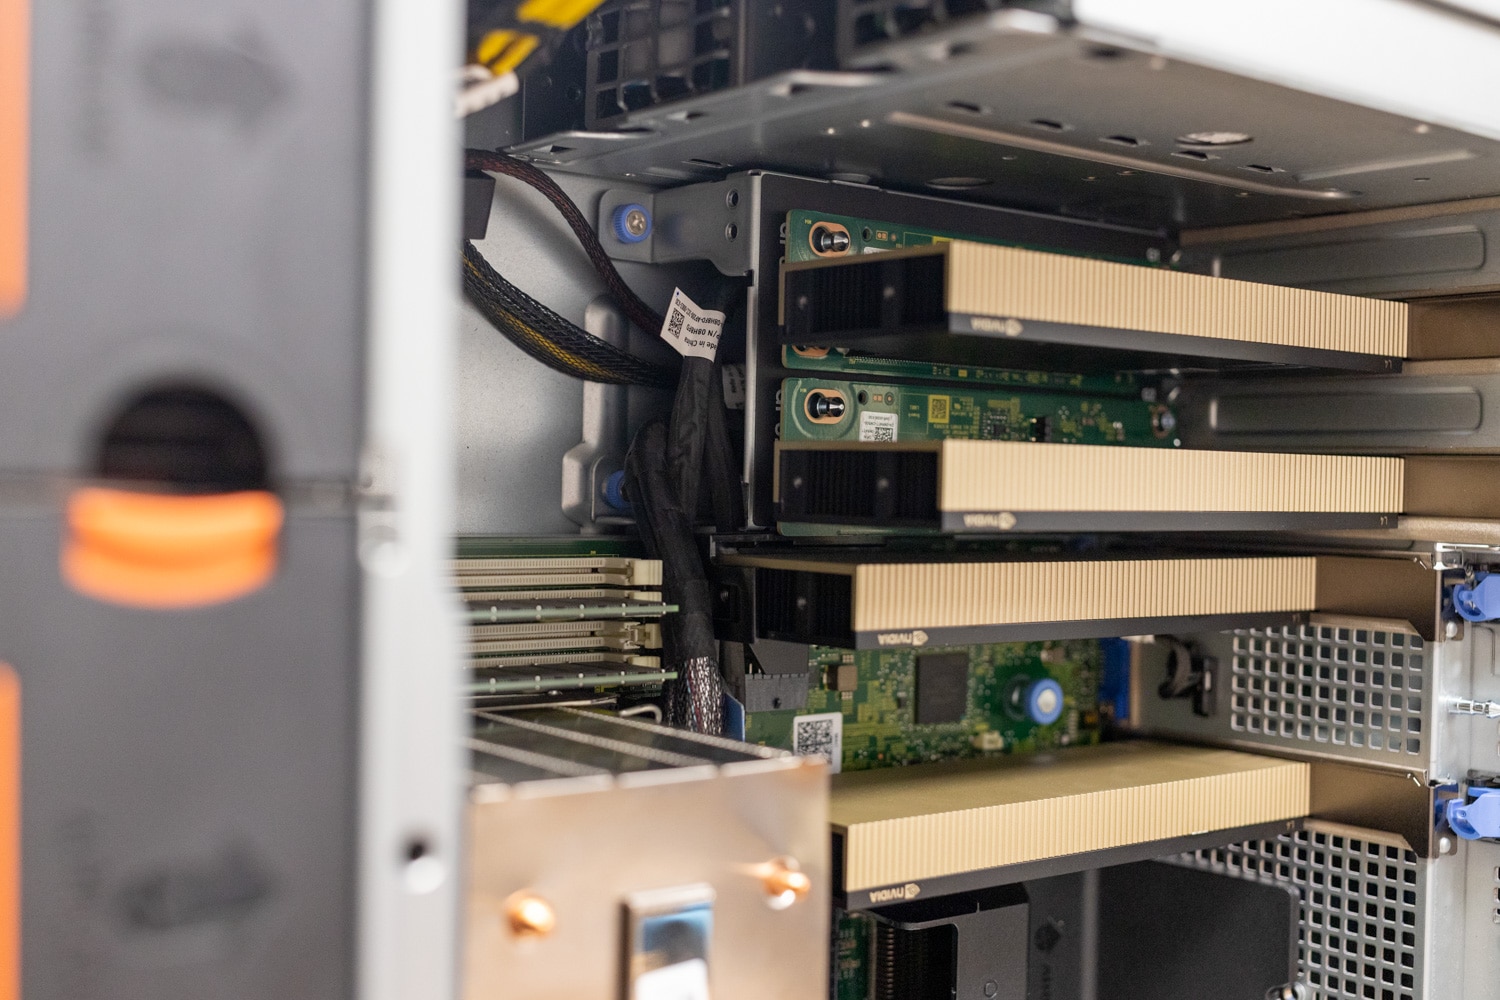
We have an exceptional configuration with five NVIDIA L4 GPUs, making it an ideal inferencing platform.
Sandwiched between the GPUs is another small airflow shield for the OCP NIC.
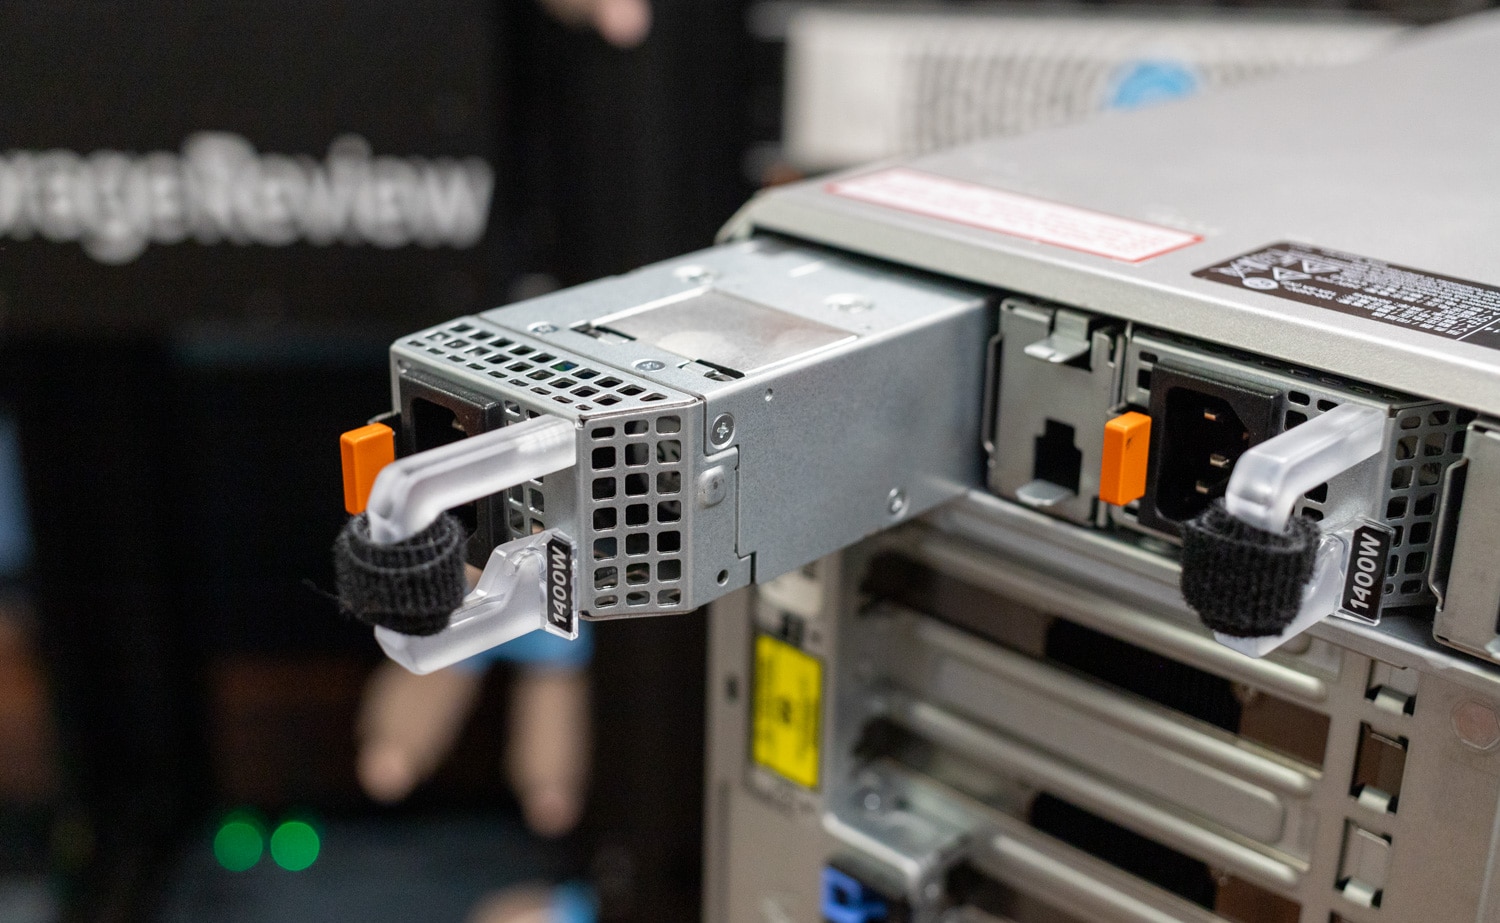
The dual hot-swap power supplies are at the top.
See our walkaround video on Instagram.
Dell PowerEdge T560 Tower Server Performance
Our review unit has the following configuration:
- 2x Intel Xeon Gold 6448Y (32-core/64-thread each, 225-watt TDP, 2.1-4.1GHz)
- 8x 1.6TB Solidigm P5520 SSDs w/ PERC 12 RAID card
- 5x NVIDIA L4 GPUs
- 8x 64GB RDIMMs
For storage testing, we leveraged the SSDs connected to the PERC 12 RAID card in a JBOD and RAID 6 configurations. This is different than using native NVMe, where each SSD would have its own x4 connection to the motherboard.
VDBench Workload Analysis
When it comes to benchmarking storage devices, application testing is best, and synthetic testing comes in second place. While not a perfect representation of actual workloads, synthetic tests help baseline storage devices with a repeatability factor that makes it easy to make apples-to-apples comparisons between competing solutions. These workloads offer a range of testing profiles ranging from “four corners” tests and common database transfer size tests to trace captures from different VDI environments.
All of these tests leverage the common vdBench workload generator, with a scripting engine to automate and capture results over a large compute testing cluster. This allows us to repeat the same workloads across a wide range of storage devices, including flash arrays and individual storage devices. Our testing process for these benchmarks fills the entire drive surface with data and then partitions a drive section equal to 25% of the drive capacity to simulate how the drive might respond to application workloads. This differs from full entropy tests, which use 100 percent of the drive and take them into a steady state. As a result, these figures will reflect higher-sustained write speeds.
Profiles:
- 4K Random Read: 100% Read, 128 threads, 0-120% iorate
- 4K Random Write: 100% Write, 128 threads, 0-120% iorate
- 64K Sequential Read: 100% Read, 32 threads, 0-120% iorate
- 64K Sequential Write: 100% Write, 16 threads, 0-120% iorate
- 64K Random Read: 100% Read, 32 threads, 0-120% iorate
- 64K Random Write: 100% Write, 16 threads, 0-120% iorate
- Synthetic Database: SQL and Oracle
- VDI Full Clone and Linked Clone Traces
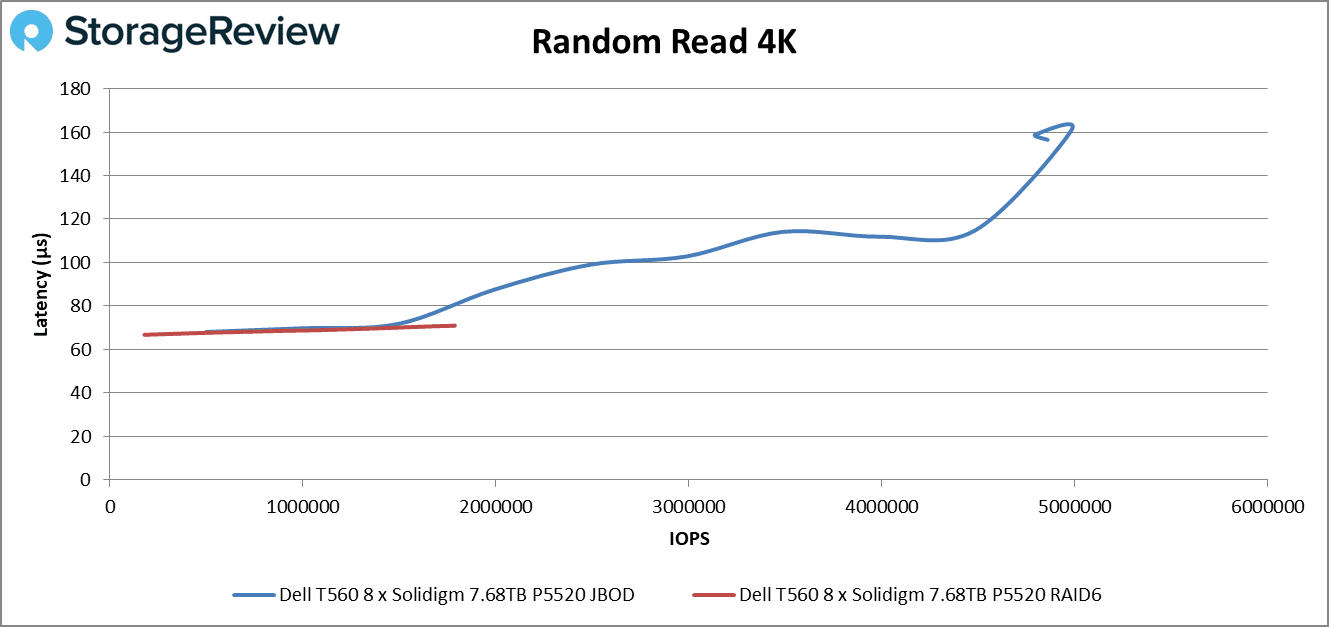
Starting with 4K random read, we saw the T560 reach 1.79 million IOPS in RAID6 and 4.86 million IOPS in JBOD. The latency was well controlled except for the end of the JBOD results, where we saw a minor spike.
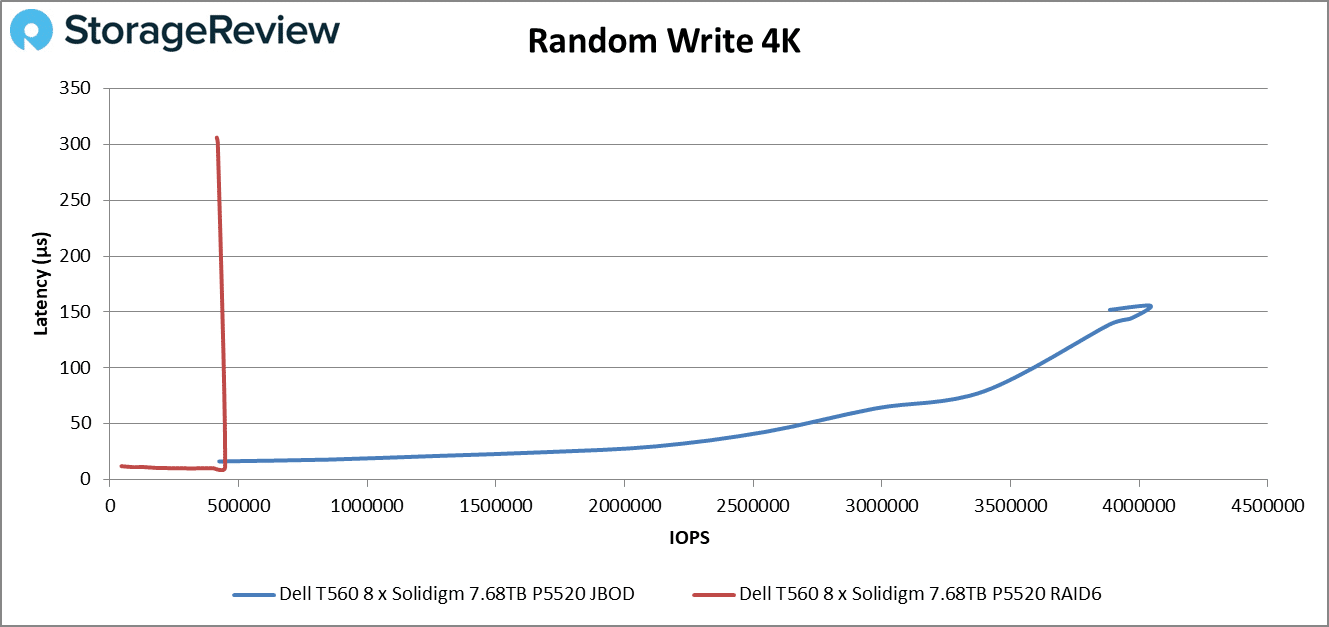
Random write 4K saw a sharp spike for the RAID6 array; it didn’t go past 415,000 IOPS. The JBOD configuration, on the other hand, reached 3.9 million IOPS before showing minor instability. Again, though, we see relatively stable latency until the spikes.
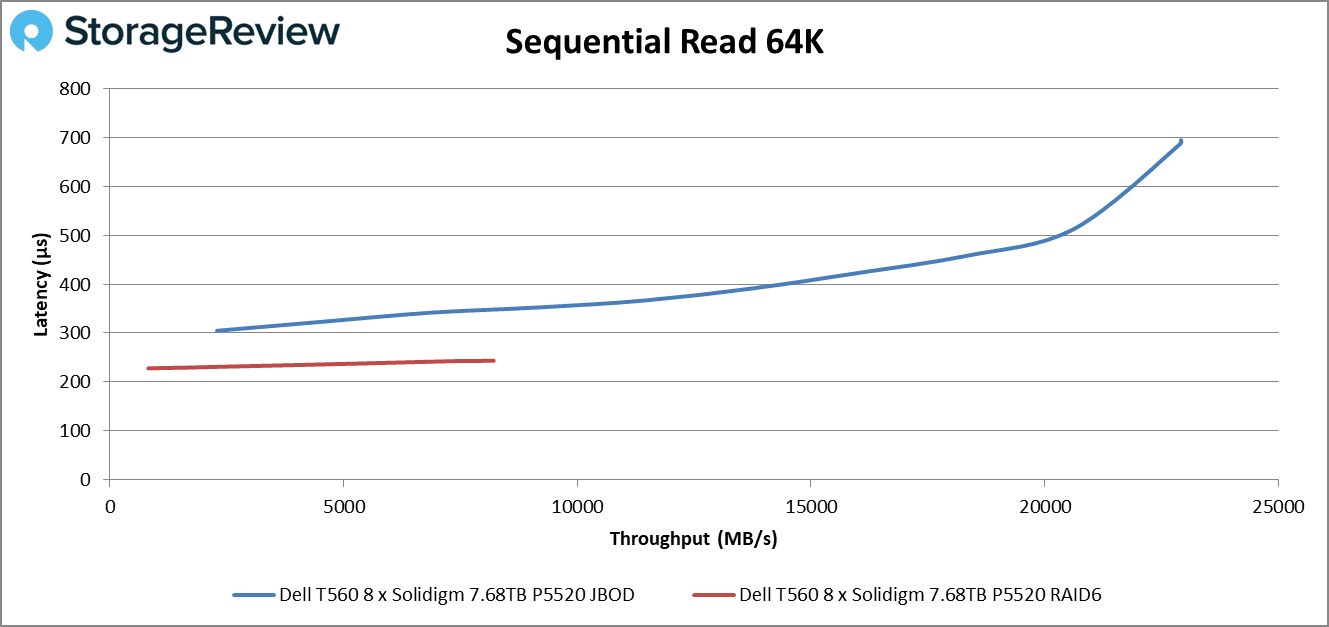
Next up is sequential read 64k; the T560’s RAID6 array achieved 8.2GB/s while the JBOD configuration reached nearly 23GB/s. The lines show no instability.
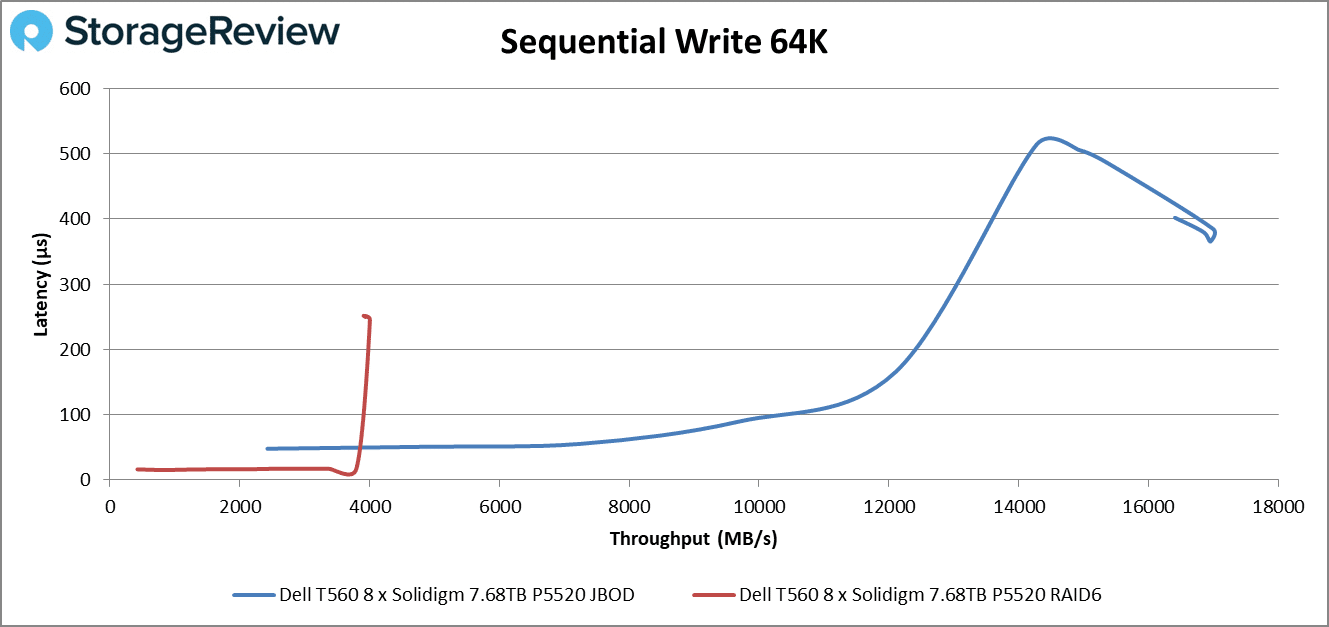
 We saw another sharp spike for the T560’s RAID6 array in the sequential write 64k test, where it hit a wall at about 4GB/s. The JBOD configuration went up to about 16.5GB/s, with some instability past 14GB/s.
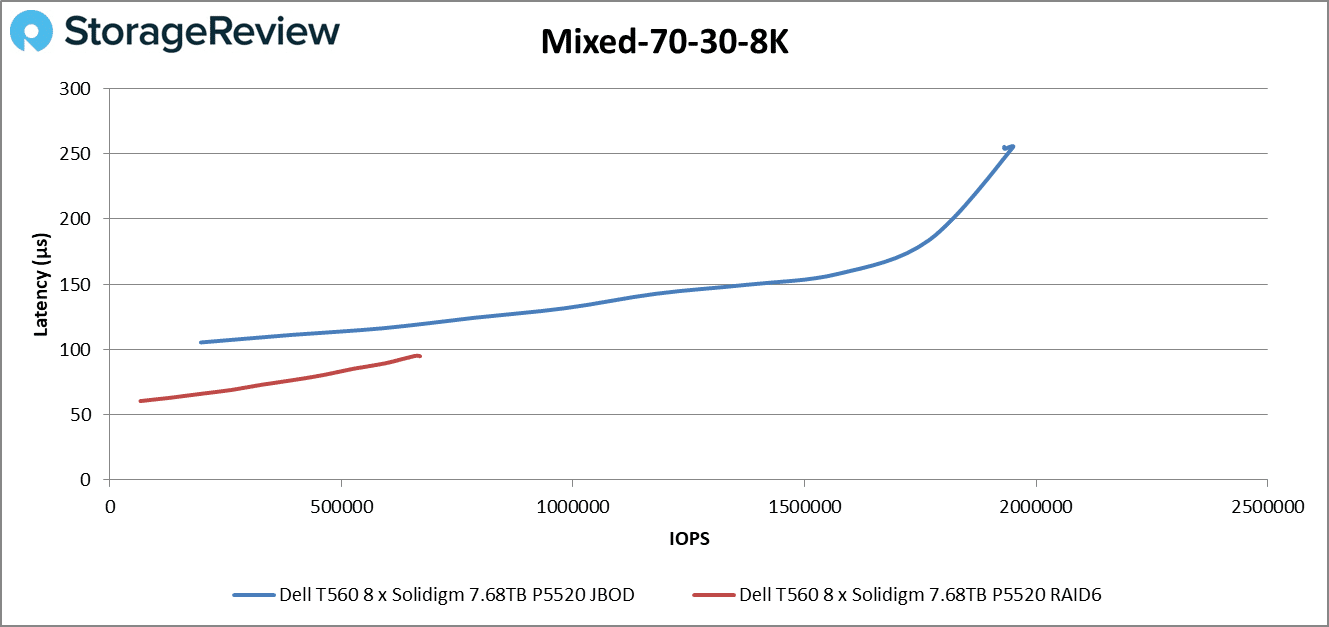
Our mixed 70/30 8K test showed relatively smooth lines; the RAID6 array reached about 670,000 IOPS and the JBOD array 1.93 million IOPS. Latencies in both cases remained controlled.
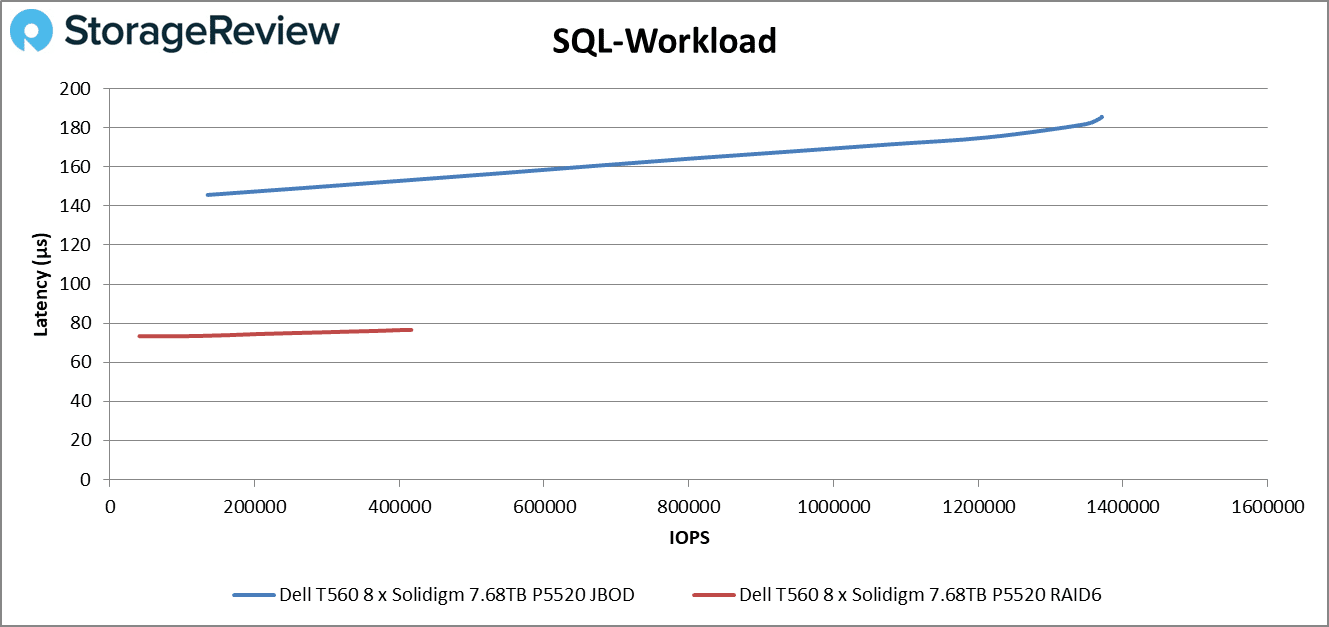
The next tests are our SQL workloads. We continue to see stable latency, and here there are no spikes. The RAID6 array peaked just past 4 million IOPS while the JBOD configuration topped 14 million IOPS.
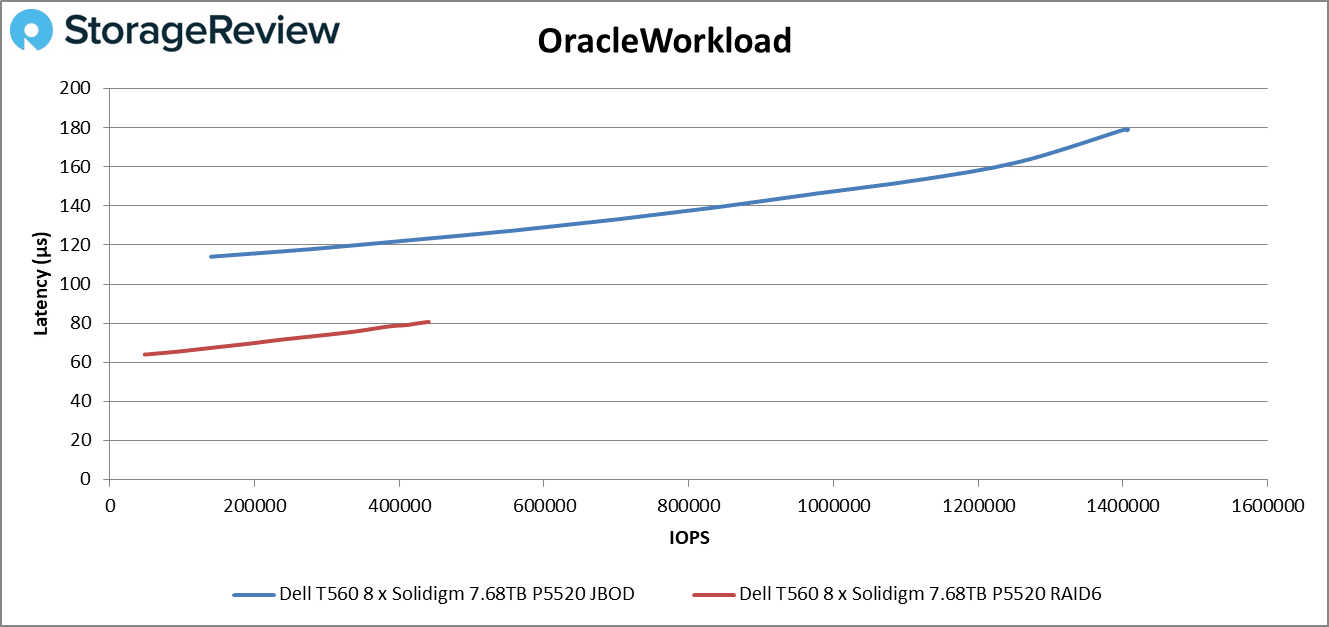
We also run an Oracle SQL workload test where the results were similar, the RAID6 array this time going further past 4 million IOPS and the JBOD configuration creeping slightly over 14 million IOPS.
Windows Server 2022 Performance Benchmarks
For our comparison, we selected the previously tested R760. Here is the comparison between the CPU’s. Both have the same number of cores, although the Xeon 6448Y CPUs inside the T560 have an edge on overall clockspeed compared to the Xeon 6430s inside the R760.
| Dell PowerEdge T560 – Intel Xeon 6448Y | Dell PowerEdge R760 – Intel Xeon 6430 | |
|---|---|---|
| Total Cores | 32 | 32 |
| Total Threads | 64 | 64 |
| Max Turbo Frequency | 4.10 GHz | 3.40 GHz |
| Processor Base Frequency | 2.10 GHz | 2.10 GHz |
Cinebench R23 and R24
Maxon’s Cinebench R23 is a CPU rendering benchmark that utilizes all CPU cores and threads. We ran it for both multi- and single-core tests. Higher scores are better.
With the recent release of the 24 version, it introduced a new scoring system and the ability to run on multiple GPU’s.
| Test | Dell PowerEdge T560 (2x Xeon Gold 6448Y) |
|---|---|
| Cinebench R23 Multi | 73,622 |
| Cinebench R23 Single | 1186 |
| Cinebench R24 GPU | 97,984 |
| Cinebench R24 CPU Multi | 3,976 |
| Cinebench R24 CPU Single | 3,976 |
Blender CLI
Blender benchmark measures the 3D rendering performance of a CPU or GPU by rendering a 3D scene in the Blender software. It provides a score that can be used to compare the performance of different systems and components. The numbers are in samples per minute.
| Test | Dell PowerEdge T560 (2x Xeon Gold 6448Y, 5x NVIDIA L4) | Dell PowerEdge R760 (2x Xeon Gold 6430, 1x NVIDIA A2) |
|---|---|---|
| CPU Blender CLI – Monster | 582.085675 | 576.928413 |
| CPU Blender CLI – Junkshop | 383.546707 | 376.557690 |
| CPU Blender CLI – Classroom | 275.857847 | 281.536442 |
| GPU Blender CLI – Monster | 2,547.287378 | 479.238127 |
| GPU Blender CLI – Junkshop | 1,348.087892 | 302.355378 |
| GPU Blender CLI – Classroom | 1,229.122455 | 248.540754 |
Geekbench 6
Geekbench is a cross-platform benchmark. We use the CPU benchmark, which has multiple workloads to model real-world tasks and applications.
| Test | Dell PowerEdge T560 (2x Xeon Gold 6448Y) | Dell PowerEdge R760 (2x Xeon Gold 6430) |
|---|---|---|
| Geekbench 6 CPU Multi Score | 18,572 | 12,971 |
| Geekbench 6 CPU Single Score | 1,734 | 12,971 |
| Geekbench 6 GPU dGPU Score – OpenCL | 157,380 | Untested |
y-cruncher
y-cruncher is a multi-threaded and scalable program that can compute Pi and other mathematical constants to trillions of digits. Since its launch in 2009, it has become a popular benchmarking and stress-testing application for overclockers and hardware enthusiasts. Here again we see that the PowerEdge R760’s Xeon Gold chips have a slight performance advantage.
| Test | Dell PowerEdge T560 (2x Xeon Gold 6448Y) | Dell PowerEdge R760 (2x Xeon Gold 6430) |
|---|---|---|
| y-cruncher 1b Compute Time | 7.332 | 7.306 |
| y-cruncher 2.5b Compute Time | 20.102 | |
| y-cruncher 10b Compute Time | 97.32 | 91.435 |
GPUPI
GPUPI 3.3.3 is a version of the lightweight benchmarking utility designed to calculate π (pi) to billions of decimals using hardware acceleration through GPUs and CPUs. It leverages the computing power of OpenCL and CUDA which includes both central and graphic processing units. We ran CUDA on the 5x L4’s.
| Application | Dell PowerEdge T560 (2x Xeon Gold 6448Y) with 5X NVIDIA L4 |
|---|---|
| GPUPI v3.3 – 1B | 0sec 850ms |
| GPUPI v3.3 – 32B | 50sec 361ms |
UL Procyon AI Inference (CPU)
UL’s Procyon AI Inference benchmark suite tests how various AI inference engines perform using state-of-the-art neural networks. We run these tests on the CPU only. The numbers below are average inference times; the overall score is the last row.
| Test | Dell PowerEdge T560 (2x Xeon Gold 6448Y) | Dell PowerEdge R760 (2x Xeon Gold 6430) |
|---|---|---|
| MobileNet V3 | 2.60 | 3.05 |
| ResNet 50 | 6.12 | 6.79 |
| Inception V4 | 19.59 | 20.55 |
| DeepLab V3 | 23.68 | 31.27 |
| YOLO V3 | 29.63 | 32.58 |
| REAL-ESRGAN | 1468.64 | 1498.36 |
| Overall Score | 191 | 169 |
GROMACS CUDA on the Dell T560 Tower Server
To unlock the full potential of the Dell T560 tower server equipped with 5 NVIDIA L4 GPUs, we source compiled GROMACS, a molecular dynamics software, specifically for CUDA. This bespoke compilation was to leverage the parallel processing capabilities of the 5 NVIDIA L4 GPUs, essential for accelerating computational simulations.
The process involved the utilization of nvcc, NVIDIA’s CUDA compiler, along with many iterations of the appropriate optimization flags to ensure that the binaries were properly tuned to the server’s architecture. The inclusion of CUDA support in the GROMACS compilation allows the software to directly interface with the GPU hardware, which can drastically improve computation times for complex simulations.
The Test: Custom Protein Interaction in Gromacs
Leveraging a community-provided input file from our diverse Discord, which contained parameters and structures tailored for a specific protein interaction study, we initiated a molecular dynamics simulation. The results were remarkable— the system achieved a simulation rate of 170.268 nanoseconds per day.
| GPU | System | ns/day | core time (s) |
|---|---|---|---|
| NVIDIA A4000 | Whitebox AMD Ryzen 5950x | 84.415 | 163,763 |
| RTX NVIDIA 4070 | Whitebox AMD Ryzen 7950x3d | 131.85 | 209,692.3 |
| 5x NVIDIA L4 | Dell T560 w/ 2x Intel Xeon Gold 6448Y | 170.268 | 608,912.7 |
Significance of the Simulation Speed
The speed at which molecular simulations can be run is critical in various industries. For instance, in pharmaceuticals, rapid simulation capabilities can significantly accelerate drug discovery by enabling researchers to quickly iterate through molecular designs and interactions.
In material sciences, it can expedite the development of new materials with desired properties. The rate of 170.268 ns/day implies that simulations that would take nearly two weeks on much older servers can now be completed in just a single day on the Dell T560 equipped with the modest NVIDIA L4. This not only enhances productivity but also opens new frontiers in real-time data analysis and decision-making.
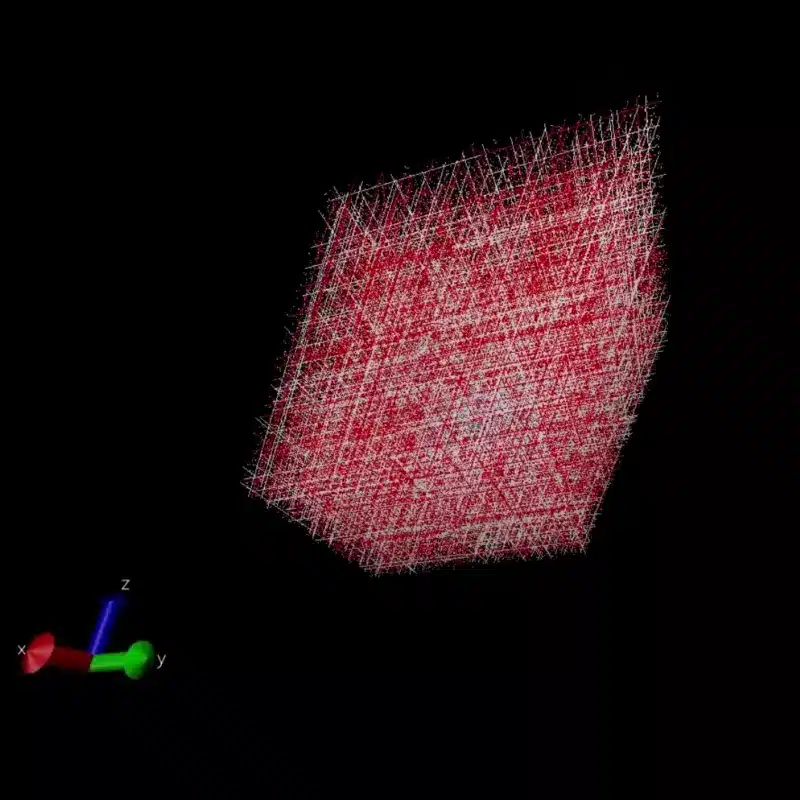
The GROMACS simulation output form the T560
Impact on Scientific Research
An interaction with a laboratory that is currently running similar simulations on 10-year-old hardware provided a stark contrast. Their existing setup takes 24 hours to complete what the Dell T560 can achieve in mere minutes. This comparison not only highlights the advancements in modern processors but also showcases the value that current hardware can bring to scientific research.
With the Dell T560 tower server, researchers could conduct more experiments in a shorter timeframe, improving the iterative cycle of hypothesis and testing that is central to scientific advancement. It means computational experiments that were once considered too resource-intensive for routine exploration are now feasible.
AI Applications of Compute Performance
The compute performance demonstrated by the Dell T560 has wide-reaching implications in the field of research. It’s not just about speed but also about the complexity and size of the problems that can now be tackled. Large-scale simulations that model entire biological systems, complex chemical reactions, or even ecological models become more viable with this kind of computational power.
With the advent of AI and machine learning, the high throughput of molecular dynamics simulations enables the generation of massive datasets necessary for training sophisticated models. These models can lead to breakthroughs in predictive biology, novel materials, and next-generation computational chemistry.
Conclusion
The Dell PowerEdge T560 Tower brings remarkable flexibility for general server usage and advanced or specialized tasks, including GPU, compute, and data science. It matches, and in some ways exceeds, rack servers in expansion and power, with two Intel “Sapphire Rapids” Xeon scalable processors, 1TB of RAM, many storage drive configurations, and multiple GPU support, yet its tower form factor doesn’t require a data center. Though clearly not silent depending on workload, its fans are quiet enough that it can be used in an office environment.
Our testing touched all areas of the PowerEdge T560’s capabilities; it showed solid numbers in our storage and CPU testing and flexed its muscle in GPU testing with our exceptional configuration of five NVIDIA L4 GPUs. We also appreciated the tower’s simple serviceability. For commendable expansion and adaptability to even the most demanding AI workloads, the PowerEdge T560 Tower gets our strong recommendation and recognition as a “Best of 2023” winner.


 Amazon