

|
 With its outstanding 10,000 RPM MAP3147, Fujitsu has demonstrated that it is a force to be reckoned with. Though marginally outperformed by Maxtor’s Atlas 10k IV, the MAP similarly outperforms Seagate’s Cheetah 10k.6 in all areas. Further, the MAP hit general availability quite a bit earlier than the Atlas.
Now Fujitsu is taking aim at the Cheetah 15k.3 and the Atlas 15k with the MAS3735, their second entry into the high-performance, 15,000 RPM market. Like the Cheetah and Atlas, the MAS combines up to four 18-gigabyte platters to yield a flagship capacity of 73 GB. The firm claims an average read access time of just 3.3 milliseconds. An industry-standard eight-megabyte buffer rounds out the offering.
Interestingly, instead of sticking with the 2.58 inch platters standardized by the Cheetah (65 mm; also used in the Atlas 15k), Fujitsu has chosen to incorporate 2.78 inch (70 mm) media into the MAS. The increased radius affords the manufacturer a chance to incorporate more linear density into the product, albeit at the potential expenses of power consumption (heat) and flutter (noise).
 With such formidable specs, the MAS guns for ultra-high-end applications such as heavy-duty file servers, high I/O transaction servers, and workstations that feature unusually heavy disk access. In short, a market in which the leading drive lays claim as “the fastest drive on earth.”
Does the MAS deliver? Let’s turn to the numbers!
Low-Level ResultsFor diagnostic purposes only, StorageReview measures the following low-level parameters: Average Read Access Time– An average of 25,000 random accesses of a single sector each conducted through IPEAK SPT’s AnalyzeDisk suite. The high sample size permits a much more accurate reading than most typical benchmarks deliver and provides an excellent figure with which one may contrast the claimed access time (claimed seek time + the drive spindle speed’s average rotational latency) provided by manufacturers. WB99 Disk/Read Transfer Rate – Begin– The sequential transfer rate attained by the outermost zones in the hard disk. The figure typically represents the highest sustained transfer rate a drive delivers. WB99 Disk/Read Transfer Rate – End– The sequential transfer rate attained by the innermost zones in the hard disk. The figure typically represents the lowest sustained transfer rate a drive delivers. |
For more information, please click here.
|
Note: Scores on top are better. |
|
|||||||||||||||||||||||||||
|
|
||||||||||||||||||||||||||
MAS3735 Average Read Service Time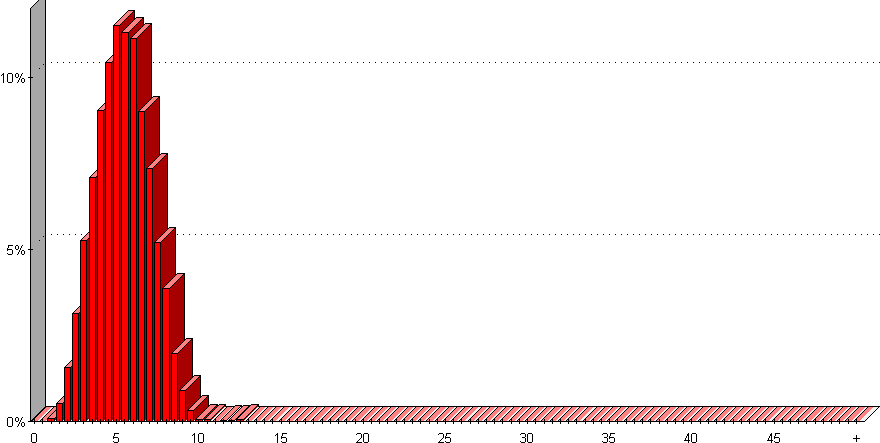 |
MAS3735 Average Write Service Time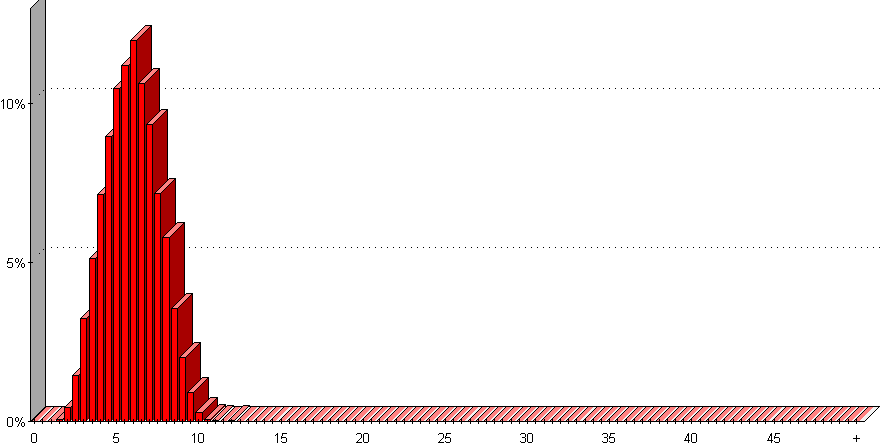
|
||||||||||||||||||||||||||
The MAS3735’s random read access time slides in at just a hair under 5.6 milliseconds. Subtracting 2 milliseconds to account for the rotational latency of a 15,000 RPM spindle speed yields a measured seek time of 3.6 ms. While this figure remains a bit off of Fujitsu’s 3.3 ms claim, it nonetheless sets a new absolute record. Write accesses weigh in at 6.1 milliseconds, tying the mark set by Maxtor’s Atlas 15k.
|
Note: Scores on top are better. |
|
|||||||||||||||||||||||||||
|
|
||||||||||||||||||||||||||
MAS3735 Transfer Rate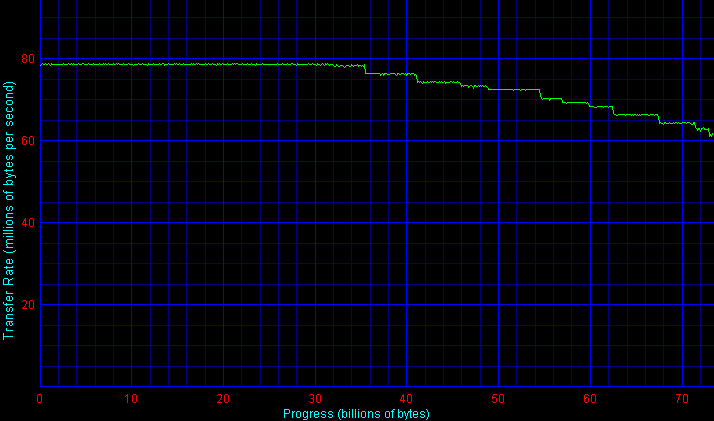
|
|||||||||||||||||||||||||||
Fujitsu’s drive turns in an outer-zone sequential transfer rate of 78.6 MB/sec, breaking yet another record. Interestingly, the MAS maintains this rate for over half its capacity. Transfers decay down to a 64.1 MB/sec rate on the inner zone, a score well above what we have ever seen in the past.
Single-User PerformanceStorageReview uses the following tests to assess non-server use: StorageReview.com Office DriveMark 2002– A capture of 30 minutes of actual computer productivity use that exactingly recreates a typical office-style multitasking environment. The applications include: Outlook XP, Word XP, Excel XP, PowerPoint XP, Calypso (a freeware e-mail client), SecureCRT v3.3 (a telnet/SSH client), CuteFTP Pro v1.0 (an FTP/SSH client), ICQ 2000b), Palm Hotsync 4.0, Gravity 2.3 (a Usenet/newsgroups client), PaintShop Pro v7.0, Media Player v8 for the occasional MP3, and Internet Explorer 6.0. StorageReview.com High-End DriveMark 2002– A capture of VeriTest’s Content Creation Winstone 2001 suite. Applications include Adobe Photoshop v5.5, Adobe Premiere v5.1, Macromedia Director v8.0, Macromedia Dreamweaver v3.0, Netscape Navigator v4.73, and Sonic Foundry Sound Forge v4.5. Unlike typical productivity applications, high-end audio- and video- editing programs are run in a more serial and less multitasked manner. The High-End DriveMark includes significantly more sequential transfers and write (as opposed to read) operations. |
StorageReview.com Bootup DriveMark 2002– A capture of the rather unusual Windows XP bootup process. Windows XP’s boot procedure involves significantly different access patterns and queue depths than those found in other disk accesses. This test recreates Windows XP’s bootup from the initial bootstrap load all the way to initialization and loading of the following memory-resident utilities: Dimension4 (a time synchronizer), Norton Antivirus 2002 AutoProtect, Palm Hotsync v4.0, and ICQ 2000b.
StorageReview.com Gaming DriveMark 2002– A weighted average of the disk accesses featured in five popular PC games: Lionhead’s Black & White v1.1, Valve’s Half-Life: Counterstrike v1.3, Blizzard’s Diablo 2: Lord of Destruction v1.09b, Maxis’s The Sims: House Party v1.0, and Epic’s Unreal Tournament v4.36. Games, of course, are not multitasked- all five titles were run in a serial fashion featuring approximately half an hour of play time per game.
For more information, please click here.
|
Note: Scores on top are better. |
|
|||||||||||||||||||||||||||
|
|
||||||||||||||||||||||||||
|
|
||||||||||||||||||||||||||
It is a close race to the finish in the StorageReview.com Office DriveMark 2002. At 610 I/Os per second, however, the MAS3735 falls ever so slightly behind the Atlas 15k.
The MAS, however, strikes back in the High-End DriveMark, setting a new height by narrowly besting the Atlas and the former record holder, the SATA Western Digital Raptor WD360GD (not shown; visit StorageReview.com’s Performance Database to create your own custom comparisons).
Optimizing for Windows XP’s bootup process is one of Fujitsu’s current strong points, as evidenced by its current-generation 10,000 RPM drive, the MAP3147. The MAS likewise handily outperforms all other comers in this measure.
Finally, for those who insist on outfitting their gaming rigs with the latest and greatest 15,000 RPM SCSI units, the MAS falls a bit short in the Gaming DriveMark, a normalized performance average of five popular PC games.
Multi-User PerformanceStorageReview uses the following tests to assess server performance: StorageReview.com File Server DriveMark 2002– A mix of synthetically-created reads and writes through IOMeter that attempts to model the heavily random access that a dedicated file server experiences. Individual tests are run under loads with 1 I/O, 4 I/Os, 16 I/Os, and 64 I/Os outstanding. The Server DriveMark is a convenient at-a-glance figure derived from the weighted average of results obtained from the four different loads. StorageReview.com Web Server DriveMark 2002– A mix of synthetically-created reads through IOMeter that attempts to model the heavily random access that a dedicated web server experiences. Individual tests are run under loads with 1 I/O, 4 I/Os, 16 I/Os, and 64 I/Os outstanding. The Server DriveMark is a convenient at-a-glance figure derived from the weighted average of results obtained from the four different loads. For more information click here. |
|
Note: Scores on top are better. |
|
|||||||||||||||||||||||||||
|
|
||||||||||||||||||||||||||
The raison d’etre of SCSI drives, of course, is to service multiple users. When it comes to such grueling tasks, the MAS3735, whether the load is heavy or light, in both file and web server scenarios, tops all other contenders.
Legacy PerformanceeTesting Lab’s WinBench 99 Disk WinMark tests are benchmarks that attempt to measure desktop performance through a rather dated recording of high-level applications. Despite their age, the Disk WinMarks are somewhat of an industry standard. The following results serve only as a reference; SR does not factor them into final judgments and recommends that readers do the same. |
|
Note: Scores on top are better. |
|
|||||||||||||||||||||||||||
|
|
||||||||||||||||||||||||||
Heat and NoiseIdle Noise– The sound pressure emitted from a drive measured at a distance of 18 millimeters. The close-field measurement allows for increased resolution between drive sound pressures and eliminates interactions from outside environmental noise. Note that while the measurement is an A-weighted decibel score that weighs frequencies in proportion to human ear sensitivity, a low score does not necessarily predict whether or not a drive will exhibit a high-pitch whine that some may find intrusive. Conversely, a high score does not necessarily indicate that the drive exhibits an intrusive noise envelope. Net Drive Temperature– The highest temperature recorded from a 16-point sample of a drive’s top plate after it has been under heavy load for 80 minutes. The figures provided are net temperatures representing the difference between the measured drive temperature and ambient temperature. For more information, please click here. |
|
Note: Scores on top are better. |
|
|||||||||||||||||||||||||||
|
|
||||||||||||||||||||||||||
As a four-platter hard drive featuring 15k operation, the MAS generates some noise. Its objective noise reading of 50.7 dB/A is among the higher scores we have seen. This is, however, an opportunity to point out that objective noise measurements do not necessarily correlate to subjective perceptions. Several drives with significantly lower noise floors (though not necessarily the Cheetah and Atlas listed in the above table) feature a faint but noticeable high-pitched whine that may be more intrusive than the more “neutral” low-midrange sound that the MAS produces. Subjectively, while the Fujitsu is not as quiet as today’s ATA drives, the noise it produces is in line with most other contemporary SCSI drives.
ReliabilityThe StorageReview.com Reliability Survey aims to amalgamate individual reader experiences with various hard disks into a comprehensive warehouse of information from which meaningful results may be extracted. A multiple-layer filter sifts through collected data, silently omitting questionable results or results from questionable participants. A proprietary analysis engine then processes the qualified dataset. SR presents results to readers through a percentile ranking system. According to filtered and analyzed data collected from participating StorageReview.com readers, the |
According to filtered and analyzed data collected from participating StorageReview.com readers, a predecessor of the
Fujitsu MAS3735, the
Fujitsu MAM3367
, is more reliable than the other drives in the survey that meet a certain minimum floor of participation.
Note that the percentages in bold above may change as more information continues to be collected and analyzed. For more information, to input your experience with these and/or other drives, and to view comprehensive results, please visit the SR Drive Reliability Survey.
ConclusionThe Fujitsu MAS3735 turns in record-breaking low-level scores- a magnificent physical achievement. Though Maxtor’s Atlas 15k manages to meet and even exceed the MAS by some slight margins in a handful of desktop benchmarks, Fujitsu’s drive easily delivers the top marks in all our server measures. It even unseats the Serial ATA WD Raptor, a drive which, quirkily enough, managed to seize the High-End and Bootup DriveMark title from all other SCSI drives. In the end, there’s no question about it: those seeking the fastest hard drive around should get the MAS3735. |


 Amazon