

Note: Since the publication of this review, this drive has been retested under Testbed4, a newer hardware/software/benchmark platform. Please see this article for updated results. This review remains for reference purposes only.
|
Higher densities have been a long time in coming; it seems that increasing capacity while maintaining the rock-solid reliability that enterprise-class applications demand has become an increasingly tenacious balancing act. Packing tracks nearly twice as close to each other demands significantly more precision in head placement and settling. When one considers the microscopic precision involved in today’s hard disks, it is amazing that 73 gigabytes of data can reliably be placed on a three inch platter at all!
 Fujitsu’s MAT3300NP is the latest 10,000 RPM workhorse from the Japanese conglomerate. Like the Seagate Cheetah 10K.7 and the Maxtor Atlas 10K V, the MAT packs 75 GB/platter across four disks to achieve its flagship 300 gigabyte capacity. The drive sports a specified 4.5 millisecond seek time and features a standard 8-megabyte buffer.
Like rival Maxtor Corp., Fujitsu with this generation has moved its product to fluid dynamic bearing (FDB) motors. Through reduced metal-metal contact and a better-isolated spindle shaft, FDB motor drives boast increased reliability while also reducing noise floors. An enterprise-standard 5-year warranty backs the drive.
Fujitsu has initially shipped the MAT equipped with either a standard Ultra320 parallel SCSI or 2 GB fibre channel interface. Serial Attached SCSI (SAS)’s time is almost upon us however- it is not unreasonable to expect an SAS version of the drive once controllers and other support infrastructures hit the market.
The MAT targets applications where performance combined with high capacity is paramount. In the following performance tests, the MAT3300NP will be contrasted against the following units for the following reasons:
Fujitsu MAP3147 (147 GB) | Manufacturer’s previous-generation unit |
Hitachi/IBM Ultrastar 146Z10 (147 GB) | Previous-generation competing unit |
Maxtor Atlas 10K V (300 GB) | Current-generation competing unit |
Seagate Savvio 10K.1 (73 GB) | Current-generation competing 2.5″ unit |
Western Digital Raptor WD740GD (73 GB) | Competing Enterprise-oriented SATA unit |
Low-Level ResultsFor diagnostic purposes only, StorageReview measures the following low-level parameters: Average Read Access Time– An average of 25,000 random accesses of a single sector each conducted through IPEAK SPT’s AnalyzeDisk suite. The high sample size permits a much more accurate reading than most typical benchmarks deliver and provides an excellent figure with which one may contrast the claimed access time (claimed seek time + the drive spindle speed’s average rotational latency) provided by manufacturers. WB99 Disk/Read Transfer Rate – Begin– The sequential transfer rate attained by the outermost zones in the hard disk. The figure typically represents the highest sustained transfer rate a drive delivers. WB99 Disk/Read Transfer Rate – End– The sequential transfer rate attained by the innermost zones in the hard disk. The figure typically represents the lowest sustained transfer rate a drive delivers. |
For more information, please click here.
|
Note: Scores on top are better. |
|
|||||||||||||||||||||||
|
MAT3300NP Average Read Service Time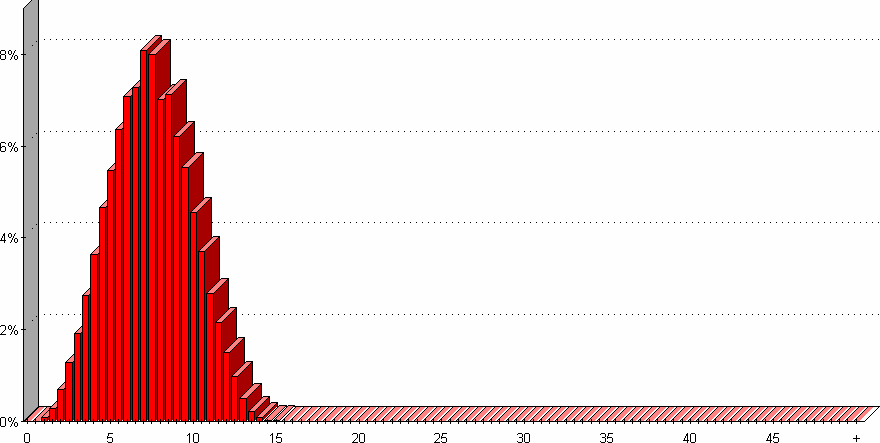
|
||||||||||||||||||||||
|---|---|---|---|---|---|---|---|---|---|---|---|---|---|---|---|---|---|---|---|---|---|---|---|
The Fujitsu MAT3300NP delivers a very respectable average read access time of 7.6 milliseconds. This score nets the drive an average seek time of 4.6 ms after taking into account the 3.0 ms latency of a 10,000 RPM spindle- the drive misses the manufacturer’s claim by a negligible 0.1 ms. A score of 7.6 ms ties the MAT with Maxtor’s Atlas 10K V as the fastest-seeking 3.5″ form-factor 10K RPM unit. Only Seagate’s Savvio 10K.1, with its reduced-diameter platters, remains out of reach.
|
Note: Scores on top are better. |
|
|||||||||||||||||||||||||||||||||||||||||||||
|
|
||||||||||||||||||||||||||||||||||||||||||||
MAT3300NP Transfer Rate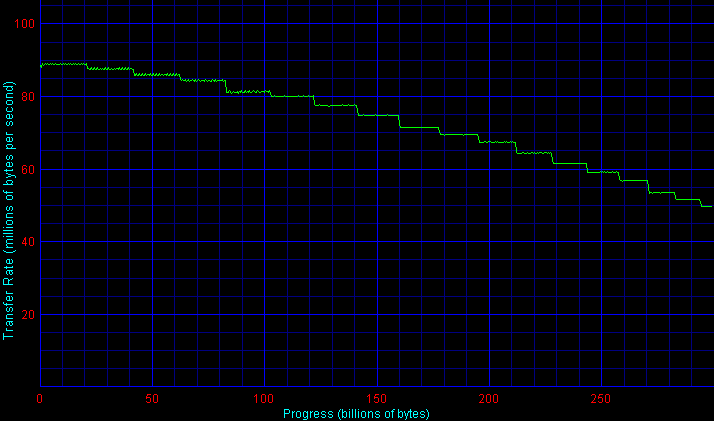
|
|||||||||||||||||||||||||||||||||||||||||||||
Like the Atlas 10K V, the MAT features an aggressive zoning scheme that pumps outer-zone transfer rates just short of 90 MB/sec. Rates decay gracefully and bottom at 52.1 MB/sec and permit the MAT to deliver consistently better transfer rates than the Seagate Cheetah 10K.7.
Single-User PerformanceStorageReview uses the following tests to assess non-server use: StorageReview.com Office DriveMark 2002– A capture of 30 minutes of actual computer productivity use that exactingly recreates a typical office-style multitasking environment. The applications include: Outlook XP, Word XP, Excel XP, PowerPoint XP, Calypso (a freeware e-mail client), SecureCRT v3.3 (a telnet/SSH client), CuteFTP Pro v1.0 (an FTP/SSH client), ICQ 2000b), Palm Hotsync 4.0, Gravity 2.3 (a Usenet/newsgroups client), PaintShop Pro v7.0, Media Player v8 for the occasional MP3, and Internet Explorer 6.0. StorageReview.com High-End DriveMark 2002– A capture of VeriTest’s Content Creation Winstone 2001 suite. Applications include Adobe Photoshop v5.5, Adobe Premiere v5.1, Macromedia Director v8.0, Macromedia Dreamweaver v3.0, Netscape Navigator v4.73, and Sonic Foundry Sound Forge v4.5. Unlike typical productivity applications, high-end audio- and video- editing programs are run in a more serial and less multitasked manner. The High-End DriveMark includes significantly more sequential transfers and write (as opposed to read) operations. |
StorageReview.com Bootup DriveMark 2002– A capture of the rather unusual Windows XP bootup process. Windows XP’s boot procedure involves significantly different access patterns and queue depths than those found in other disk accesses. This test recreates Windows XP’s bootup from the initial bootstrap load all the way to initialization and loading of the following memory-resident utilities: Dimension4 (a time synchronizer), Norton Antivirus 2002 AutoProtect, Palm Hotsync v4.0, and ICQ 2000b.
StorageReview.com Gaming DriveMark 2002– A weighted average of the disk accesses featured in five popular PC games: Lionhead’s Black & White v1.1, Valve’s Half-Life: Counterstrike v1.3, Blizzard’s Diablo 2: Lord of Destruction v1.09b, Maxis’s The Sims: House Party v1.0, and Epic’s Unreal Tournament v4.36. Games, of course, are not multitasked- all five titles were run in a serial fashion featuring approximately half an hour of play time per game.
For more information, please click here.
|
Note: Scores on top are better. |
Fujitsu’s MAT3300NP achieves an SR Office DriveMark of 568 I/Os per second. The MAT thus enjoys a healthy 16% improvement over its predecessor but nonethleless trails the category-leading Maxtor Atlas 10K V by about 9%.
The gap closes a bit in the High-End DriveMark, a test that emphasizes more writes and larger block sizes than the Office trace. Here the MAT’s score of 541 I/Os per second reaches within 4% of the Atlas’s top mark.
Fujitsu’s drives have traditionally excelled in the SR Bootup DriveMark, a rather unusual pattern that captures the requests of a machine loading Microsoft’s Windows XP from a cold start. The MAT continues the trend and bests the Atlas by 12%.
Finally, in the SR Gaming DriveMark, a weighted average of 5 popular PC entertainment titles, the MAT once again comes up second to the Atlas, lagging by a relatively small 3% margin.
Multi-User PerformanceStorageReview uses the following tests to assess server performance: StorageReview.com File Server DriveMark 2002– A mix of synthetically-created reads and writes through IOMeter that attempts to model the heavily random access that a dedicated file server experiences. Individual tests are run under loads with 1 I/O, 4 I/Os, 16 I/Os, and 64 I/Os outstanding. The Server DriveMark is a convenient at-a-glance figure derived from the weighted average of results obtained from the four different loads. StorageReview.com Web Server DriveMark 2002– A mix of synthetically-created reads through IOMeter that attempts to model the heavily random access that a dedicated web server experiences. Individual tests are run under loads with 1 I/O, 4 I/Os, 16 I/Os, and 64 I/Os outstanding. The Server DriveMark is a convenient at-a-glance figure derived from the weighted average of results obtained from the four different loads. For more information click here. |
|
Note: Scores on top are better. |
|
|||||||||||||||||||||||||||||||||||||||||||||
|
|
||||||||||||||||||||||||||||||||||||||||||||
The MAT3300NP thankfully bucks a recent trend and delivers meaningful improvements over its predecessor in the highly-random access patterns found on a typical server. Though the MAT’s SR Server DriveMark of 269 sits just 4% higher than the MAP’s score of 259, readers should remember than the Server DriveMarks, unlike their desktop counterparts, utilize the entire span of a tested drive and thus do not effectively short stroke the test disk. A 147 GB MAT, featuring just two rather than four arms, would likely deliver and even better improvement over the 147 GB MAP.
In the end, though, the scores above indicate that the MAT trails the Atlas V slightly in the File Server DriveMark as well as, of course, Seagate’s inherently short-stroked Savvio 10K.1. Fujitsu’s drive, however, does very well in the all-read (and thus, perhaps less realistic) Web Server DriveMark and manages to capture the top spot.
Legacy PerformanceeTesting Lab’s WinBench 99 Disk WinMark tests are benchmarks that attempt to measure desktop performance through a rather dated recording of high-level applications. Despite their age, the Disk WinMarks are somewhat of an industry standard. The following results serve only as a reference; SR does not factor them into final judgments and recommends that readers do the same. |
|
Note: Scores on top are better. |
|
|||||||||||||||||||||||||||||||||||||||||||||
|
|
||||||||||||||||||||||||||||||||||||||||||||
Heat and NoiseIdle Noise– The sound pressure emitted from a drive measured at a distance of 18 millimeters. The close-field measurement allows for increased resolution between drive sound pressures and eliminates interactions from outside environmental noise. Note that while the measurement is an A-weighted decibel score that weighs frequencies in proportion to human ear sensitivity, a low score does not necessarily predict whether or not a drive will exhibit a high-pitch whine that some may find intrusive. Conversely, a high score does not necessarily indicate that the drive exhibits an intrusive noise envelope. Net Drive Temperature– The highest temperature recorded from a 16-point sample of a drive’s top plate after it has been under heavy load for 80 minutes. The figures provided are net temperatures representing the difference between the measured drive temperature and ambient temperature. For more information, please click here. |
|
Note: Scores on top are better. |
|
|||||||||||||||||||||||||||||||||||||||||||||
|
|
||||||||||||||||||||||||||||||||||||||||||||
Fujitsu has improved the MAT’s overall noise profile. The newer drive manages to shave about 1.5 db/A off of the objective idle noise sound pressure measurement turned in by the older MAP3147. As a result, the drive emits significantly less of an audible hum than Maxtor’s Atlas 10K V but fails to match the whisper-quiet noise floor of Seagate’s Cheetah 10K.7. The drive’s seek noise is not the heavy rumble characteristic of fast-seeking drives, but a lighter grinding sound is definitely there in highly random operation.
The MAT’s operating temperature of 26.8 degrees above ambient remains cooler than the Atlas and approaches that of the Cheetah. There should be no problems integrating the drive into a well-ventilated chassis.
ReliabilityThe StorageReview.com Reliability Survey aims to amalgamate individual reader experiences with various hard disks into a comprehensive warehouse of information from which meaningful results may be extracted. A multiple-layer filter sifts through collected data, silently omitting questionable results or results from questionable participants. A proprietary analysis engine then processes the qualified dataset. SR presents results to readers through a percentile ranking system. According to filtered and analyzed data collected from participating StorageReview.com readers, the |
According to filtered and analyzed data collected from participating StorageReview.com readers, a predecessor of the
Fujitsu MAT3300NP, the
Fujitsu MAP3147
, is more reliable than
of the other drives in the survey that meet a certain minimum floor of participation.
Note that the percentages in bold above may change as more information continues to be collected and analyzed. For more information, to input your experience with these and/or other drives, and to view comprehensive results, please visit the SR Drive Reliability Survey.
ConclusionUnlike many of its contemporaries, Fujitsu’s MAT3300NP succeeds in delivering across-the-board improvements over its predecessor. Single-user, multi-user, and thermal/acoustic performance figures all progress when contrasted with last generation’s MAP3147. As usual, it is Fujitsu and Maxtor that joust for the top slot when it comes to sheer performance. This time around, the Atlas 10K V gets the nod. Maxtor’s drive beats Fujitsu’s latest in most performance measures by small but significant margins. Fujitsu, however, has better succeeded in lowering heat and noise levels. Should acoustics and cool operation be important in a given application, the MAT is worth considering. |


 Amazon