

When we originally reviewed the HGST Ultrastar SSD800MM, at the time we were limited to showing SAS 6Gb/s performance in our primary enterprise testing platforms. Though we did run a synthetic data performance data at 12Gb/s using a custom cable harness, it didn't follow our standard protocol of testing on enterprise-ready platforms and hardware. The results represented more of a technology preview than an actual performance review. Now with the Supermicro SuperStorage Server AR24NV SAS3 certified platform, we’ll be able to capture real world results of this and future SAS3 drives.
To recap on the drive itself, the HGST Ultrastar SSD800MM Enterprise SSD was one of the first 12Gb/s SAS interface drives brought to market. It features a co-developed Intel/HGST controller and 25nm MLC NAND. As the name indicates, the SSD800MM offers up to 800GB of capacity. The whole SAS3 line is designed with the most demanding applications in mind: big data analytics, high-frequency trading, online banking and cloud computing. On top of that, the SSD800MM is designed to be flexible with an option to select between 9W or 11W of power consumption to leverage energy efficiency or performance.
The three drives in the 12Gb/s SAS family diverge most prominently when it comes to endurance and performance. The Ultrastar SSD800MM that we are reviewing is rated with endurance at up to 10 full drive writes per day (DW/D) for five years, while the greatest endurance model SSD800MH is rated at 25 DW/D and the lighter-duty SSD1000MR is rated at 2 DW/D. When it comes to total drive endurance, the SSD800MM is rated for as much as 14.6PB written versus 36.5PB on the SSD800MM. It's not just endurance that separates these cutting-edge SSDs from one another. Read and write IOPS for each are as follows: SSD800MH – 145,000/100,000; SSD800MM – 145,000 IOPS/70,000 write; SSD1000MR – 145,000/20,000.
HGST is also offering their Ultrastar 12Gb/s SAS SSD800MM with different flavors of encryption or none at all. Organizations will not only have the option, but they also can select Trusted Computing Group (TCG) encryption, TCG + FIPS 140 encryption, or they can elect to have crypto sanitize functionality to securely wipe the drive.
The HGST Ultrastar SSD800MM SAS3 is available now and comes with a five-year warranty.
HGST Ultrastar SSD800MM SAS3 Enterprise SSD Specifications:
- Capacities
- 200GB (HUSMM8080ASS200, HUSMM8080ASS201, HUSMM8080ASS204, HUSMM8080ASS205)
- 400GB (HUSMM8040ASS200, HUSMM8040ASS201, HUSMM8040ASS204, HUSMM8040ASS205)
- 800GB (HUSMM8020ASS200, HUSMM8020ASS201, HUSMM8020ASS204, HUSMM8020ASS205)
- The final number indicates whether the drive features Crypto sanitize (0), TCG encryption (1), No encryption (4), or TCG + FIPS Certified Encryption (5)
- NAND: 25nm MLC
- Interface: 12Gb/s
- Performance
- Sequential Read (Sustained): 1150MB/s
- Sequential Write (Sustained): 700MB/s
- Random Read 4k (IOPS): 145,000
- Random Write 4k (IOPS): 70,000
- Environmental
- Ambient Temperature: 0° to 60°C
- Shock (half-sine wave): 1000G (0.5ms); 500G (2ms)
- Vibration, random (G RMS): 2.16, all axes (5-700 Hz)
- Power
- Requirement: +5 VDC (+/-5%) +12 VDC (+/-5%)
- Low power idle (W, avg): 2.2 / 2.1 / 2.1
- Operating (W, typical): 9.0 /11.0/ 11.0
- Endurance TBW: 9.1PB (200GB), 18.3PB (400GB), 36.5PB (800GB)
- MTBF: 2 Million Hours
- Dimensions (WxDxH): 70.1mm x 100.6mm x 15.0mm
- Weight: 164g
- 5-year Limited Warranty
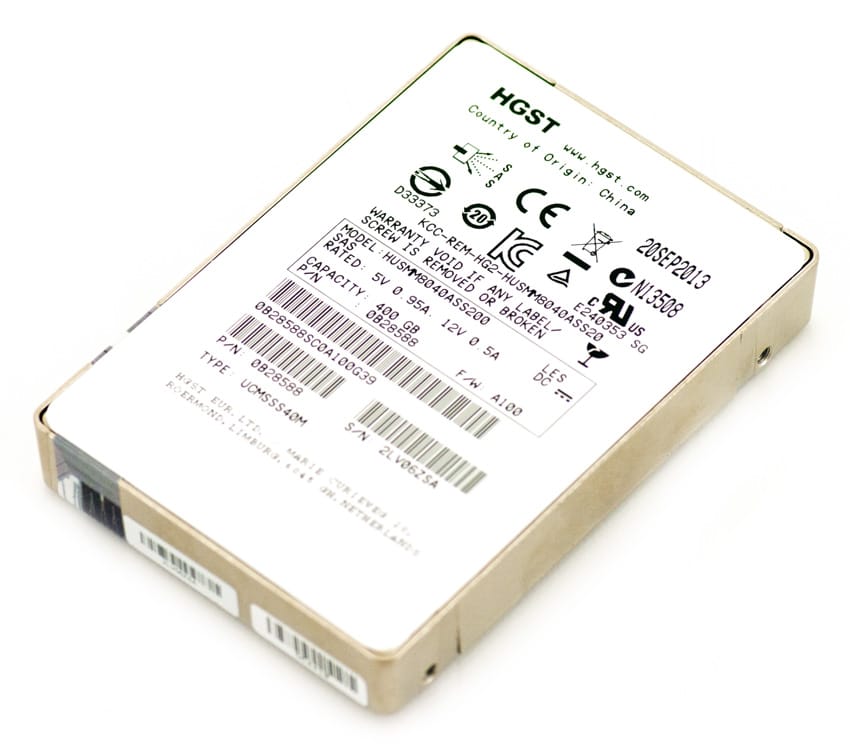
Design And Build
The Ultrastar SSD800MM is a 2.5" form factor with a 15mm height, as is a majority of high-performance enterprise SSDs. The exterior design is a solid metal build with nothing of note other than the part number.
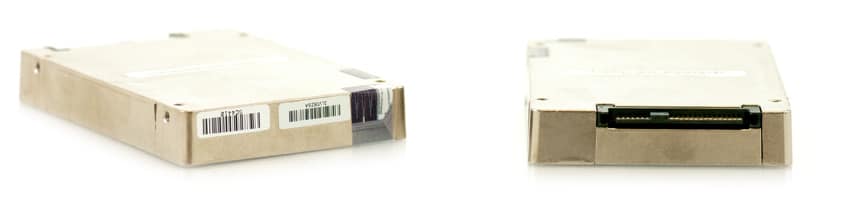
On the front of the SSD800MM is the industry-standard SAS connection for power and data, which is compatible with SAS 12Gb/s and backward-compatible with SAS 6Gb/s.
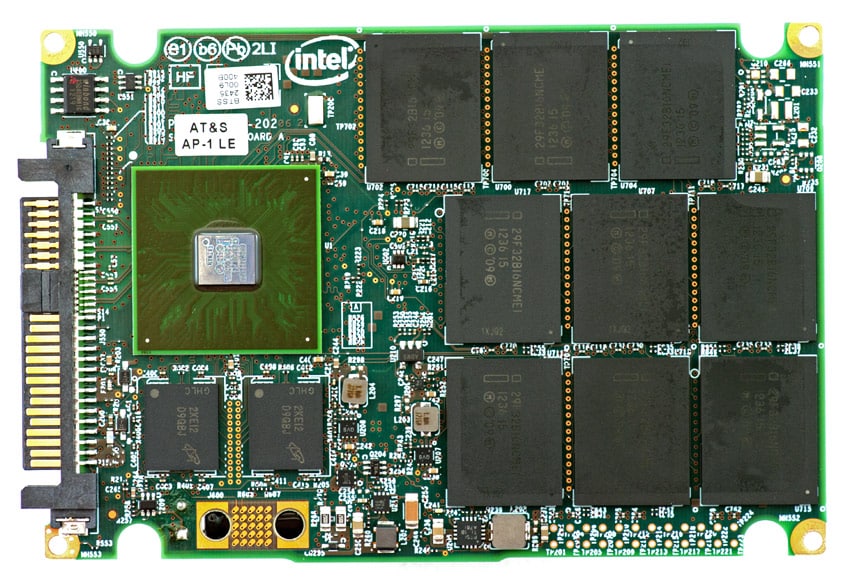
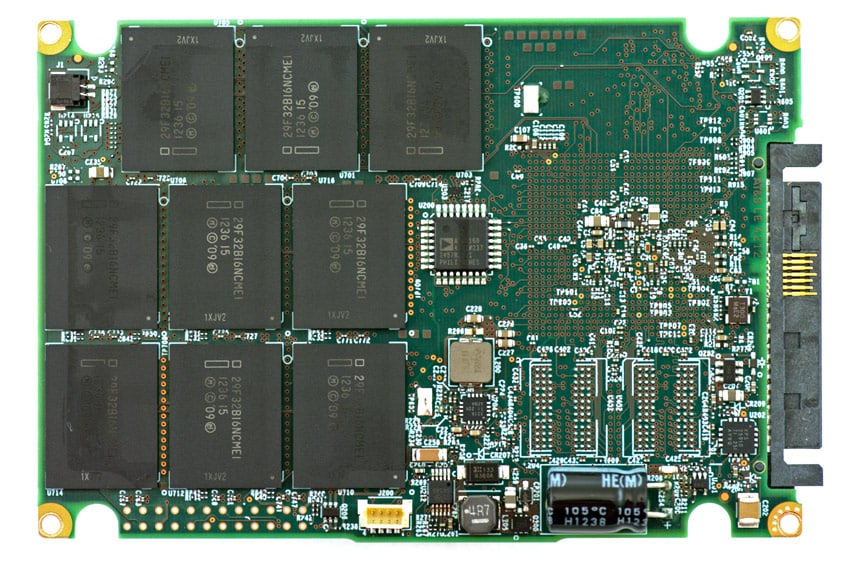
Inside, there is an Intel co-branded DB29AA11B0 SAS 12Gb/s controller. Our 400GB review model also has 18 Intel MLC NAND die packages, each with a capacity of 32GB. The drive's raw capacity is thus 576GB and its unformatted capacity is 400GB.
Testing Background and Comparables
The HGST Ultrastar SSD800MM uses an Intel co-branded DB29AA11B0 controller and 25nm MLC NAND with an interface that supports SAS 12Gb/s. In this review we show both SAS 6Gb/s and SAS 12Gb/s performance on our Supermicro SuperStorage Server AR24NV platform utilizing SAS 12Gb/s performance.
Comparables for this review:
- Toshiba PX02SM (400GB, Marvell co-branded TC58NC9036GTC controller, Toshiba 24nm eMLC NAND, 12Gb/s SAS)
- OCZ Talos 2 R (400GB, SandForce SF-2500 controller, Intel 25nm MLC NAND, 6.0Gb/s SAS)
- Hitachi SSD400M (400GB, Intel EW29AA31AA1 controller, Intel 25nm eMLC NAND, 6.0Gb/s SAS)
- Smart Optimus (400GB, third-party controller, Toshiba 34nm MLC NAND, 6.0Gb/s SAS)
- STEC s842 (s840 series) (800GB, STEC 24950-15555-XC1 controller, Toshiba MLC NAND, 6.0Gb/s SAS)
All SAS/SATA enterprise SSDs are benchmarked on our second-generation enterprise testing platform based on a Supermicro SuperStorage Server AR24NV.
- 2 x Intel Xeon E5-2687 v2 (3.4GHz, 25MB Cache, 8-cores)
- Intel C602 Chipset
- 128GB RAM (8GB x 16 Hynix DDR3, 64GB per CPU)
- 3 x Supermicro SAS3 HBAs (LSI SAS 3008 Controllers)
- 100GB Micron P400e Linux CentOS 6.3 boot
- 100GB Micron P400e Linux CentOS 6.3 boot (Sysbench) w/ Micron M500 960GB for Database storage
Application Performance Analysis
In the enterprise market there is a huge difference between how products claim to perform on paper and how they perform in a live production environment. We understand the importance of evaluating storage as a component of larger systems, most importantly how responsive storage is when interacting with key enterprise applications. To this end, we've rolled out application tests including our proprietary MarkLogic NoSQL Database Storage Benchmark and MySQL performance via SysBench.
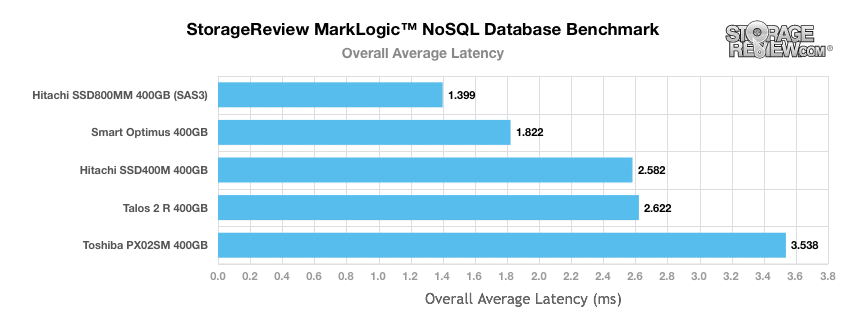
In the MarkLogic NoSQL Database environment, we test single PCIe Application Accelerators with a usable capacity greater than or equal to 700GB. Our NoSQL database requires roughly 650GB of free space to work with, evenly divided between four database nodes. In our testing environment, we use an SCST host and present each SSD in JBOD (while some PCIe SSDs leverage software RAID0), with one device or partition allocated per database node. The test repeats itself over 24 intervals, requiring between 30-36 hours total for the SSDs in this category. Measuring the internal latencies seen by the MarkLogic software, we record both total average latency, as well as interval latency for each SSD.
The HGST SSD800MM scored top marks in our MarkLogic NoSQL Database Benchmark, showing a clear lead in front of the Smart/Sandisk Optimus which previously held that top honor in the MLC SAS SSD group.
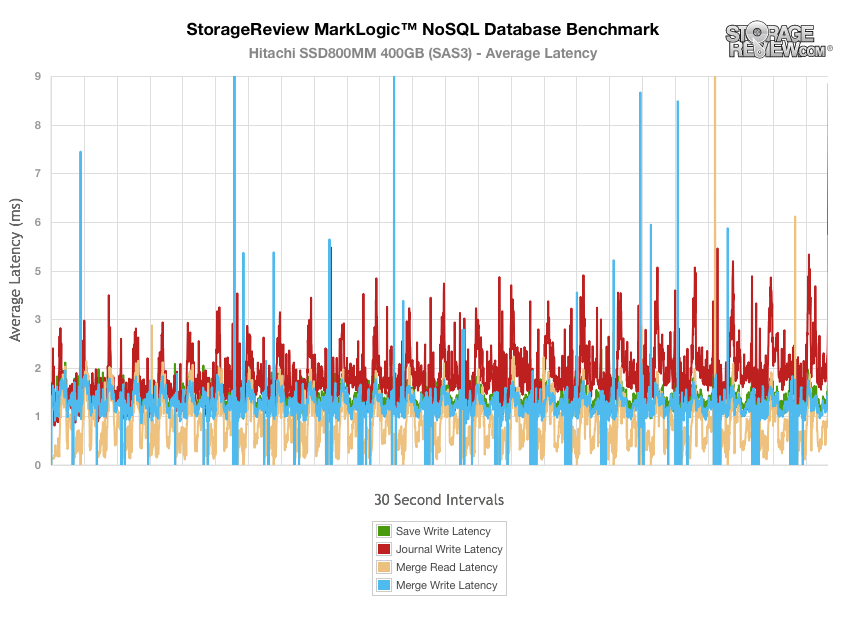
Looking at the detailed overall latency performance of the HGST SSD800MM in our NoSQL benchmark, we see the drive maintained very low latency over the duration of the test. While it did have some spikes slightly higher than the Optimus, the bulk of its latency allowed it to come in with a faster top mark.
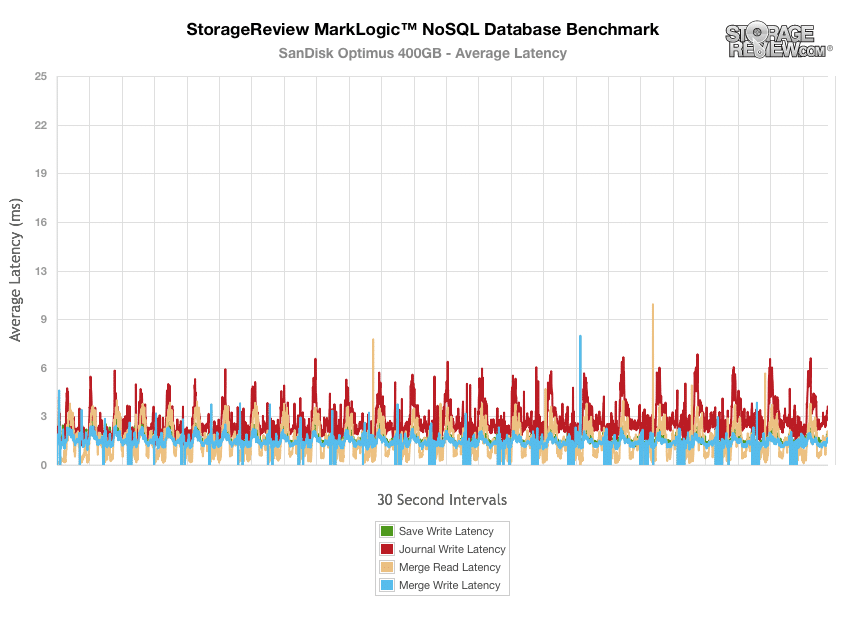
Detailed charts of the SanDisk Optimus' latency performance show most operations keeping at or below 6ms, with a handful of small spikes reaching between 7ms and 11ms.
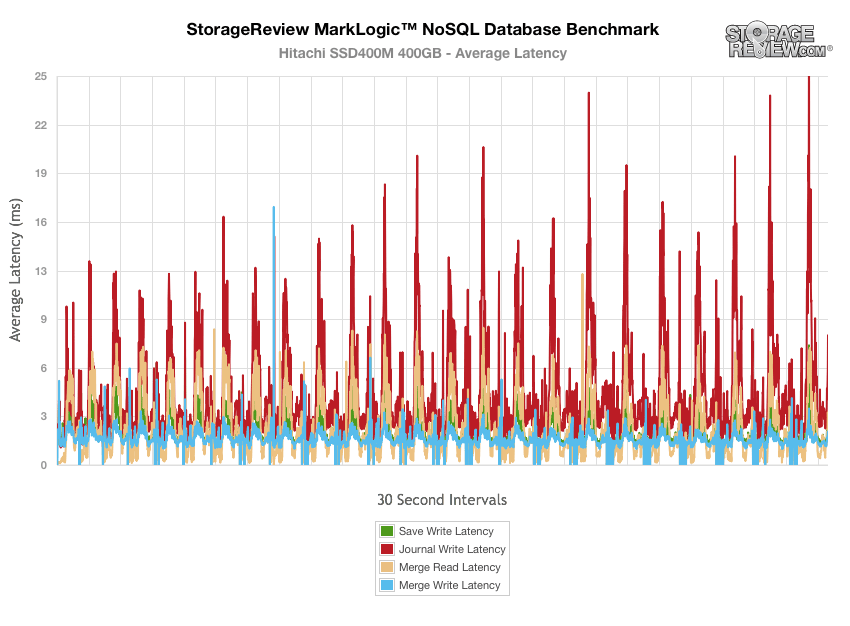
Hitachi's Ultrastar SSD400M had greater variation in latency than both SanDisk comparable, with the greatest latencies experienced during NoSQL journal write operations.
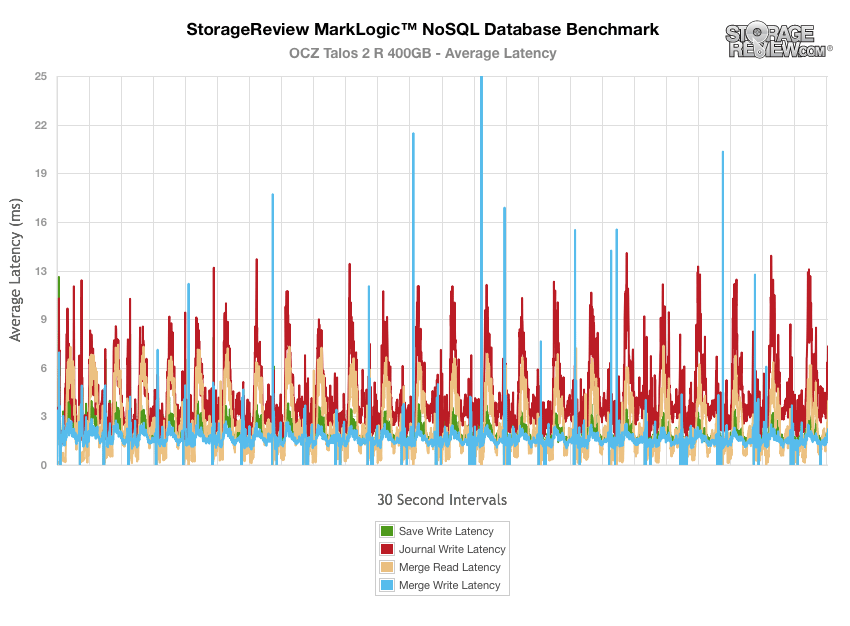
The OCZ Talos 2 R had similar overall performance to the SSD400M, with latency peaks between 9-32ms, however its highest peaks occurred during merge write operations.
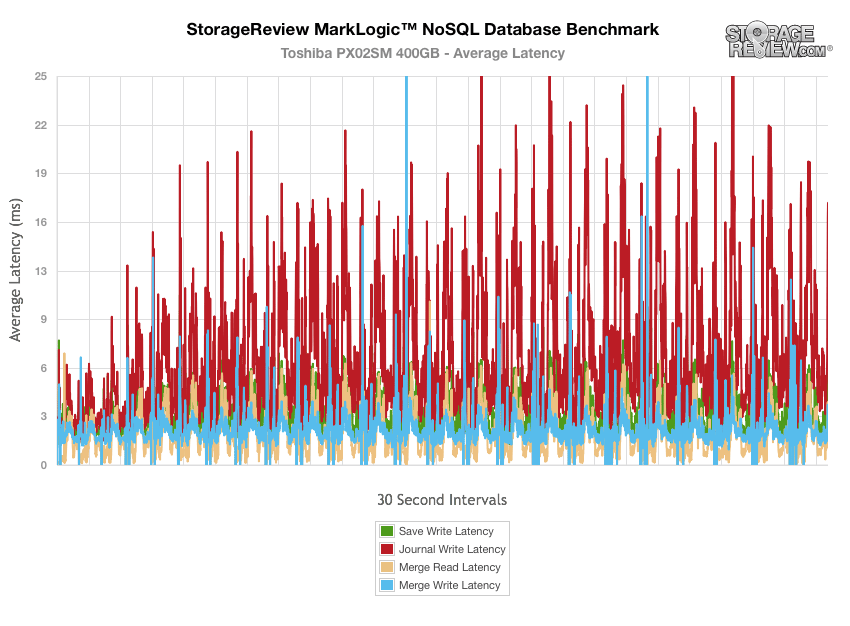
The Toshiba PX02SM had the lowest performance in the NoSQL benchmark, with journal write latencies ranging from 10-30ms
Our next application test consists of Percona MySQL database test via SysBench, which measures the performance of OLTP activity. In this testing configuration, we use a group of Lenovo ThinkServer RD630s and load a database environment onto a single SATA, SAS or PCIe drive. This test measures average TPS (Transactions Per Second), average latency, as well as average 99th percentile latency over a range of 2 to 32 threads. Percona and MariaDB are using the Fusion-io flash-aware application APIs in the most recent releases of their databases, although for the purposes of this comparison we test each device in their "legacy" block-storage modes.
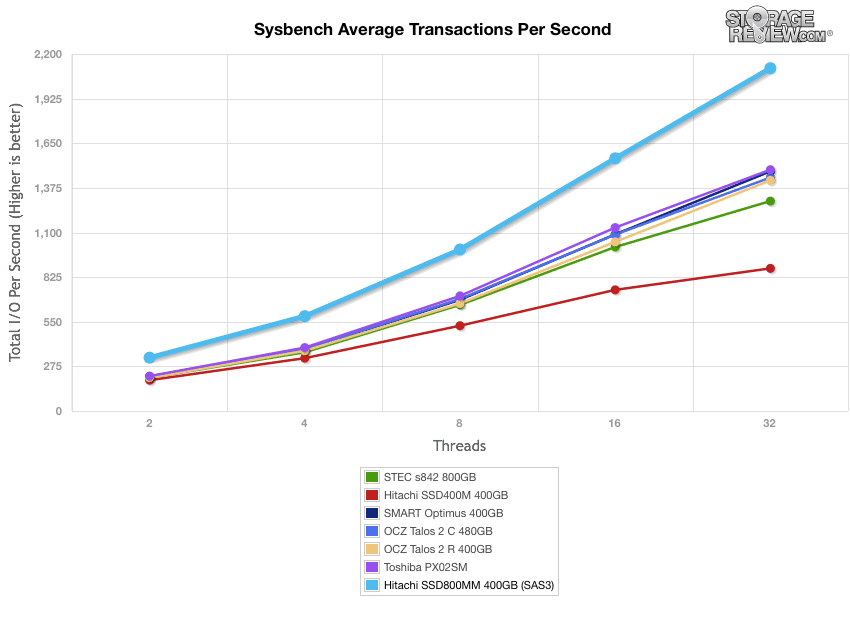
The HGST SSD800MM performed extremely well in our Sysbench MySQL test, peaking at 2,112TPS at a lead of 32-threads. This put it well above our other comparables, although those were also tested on a different platform stabilized for SAS2 benchmarks.
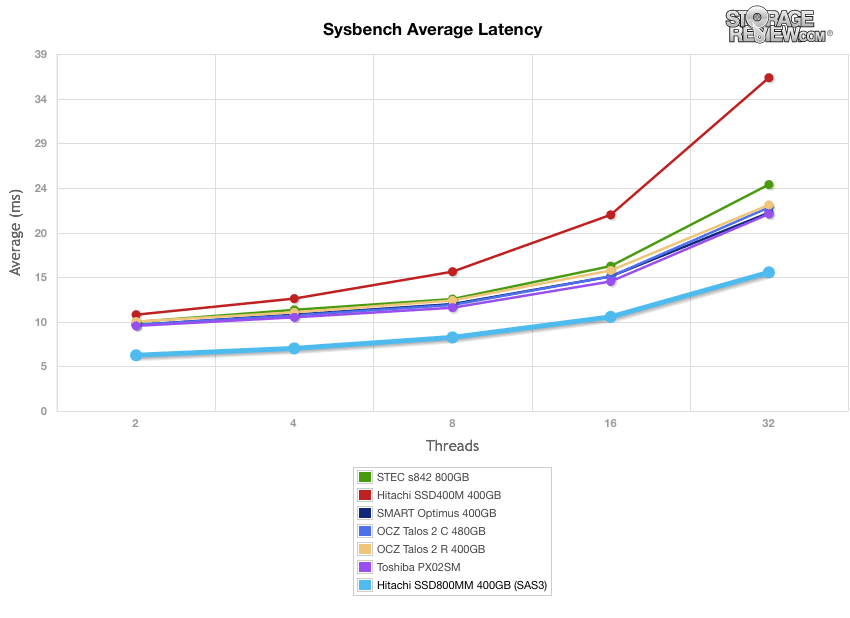
Average latency from the HGST SSD800MM was exceptional, scaling from 6.09ms at 2-threads to 15.15ms at 32-threads.
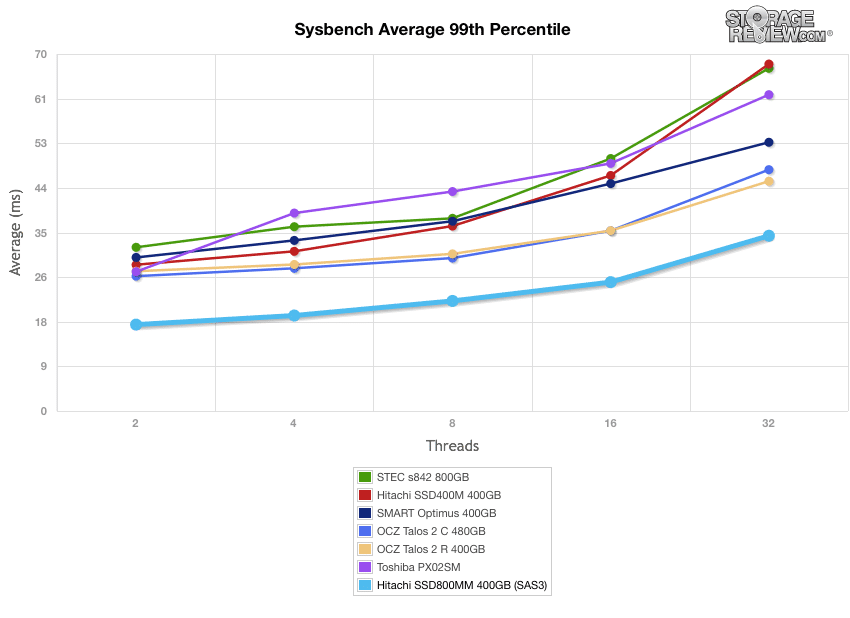
Average latency in the 99th-percentile was also very strong, ranging from 16.94ms at 2-threads and picking up to 34.46ms at 32-threads.
Enterprise Synthetic Workload Analysis
Flash performance varies throughout the preconditioning phase of each storage device. Our enterprise storage benchmark process begins with an analysis of the way the drive performs during a thorough preconditioning phase. Each of the comparable drives are secure erased using the vendor's tools, preconditioned into steady-state with the same workload the device will be tested with under a heavy load of 16 threads with an outstanding queue of 16 per thread, and then tested in set intervals in multiple thread/queue depth profiles to show performance under light and heavy usage.
Preconditioning and Primary Steady-State Tests:
- Throughput (Read+Write IOPS Aggregate)
- Average Latency (Read+Write Latency Averaged Together)
- Max Latency (Peak Read or Write Latency)
- Latency Standard Deviation (Read+Write Standard Deviation Averaged Together)
Our Enterprise Synthetic Workload Analysis includes four profiles based on real-world tasks. These profiles have been developed to make it easier to compare to our past benchmarks as well as widely-published values such as max 4k read and write speed and 8k 70/30, which is commonly used for enterprise drives.
- 4k
- 100% Read or 100% Write
- 100% 4k
- 8k 70/30
- 70% Read, 30% Write
- 100% 8k
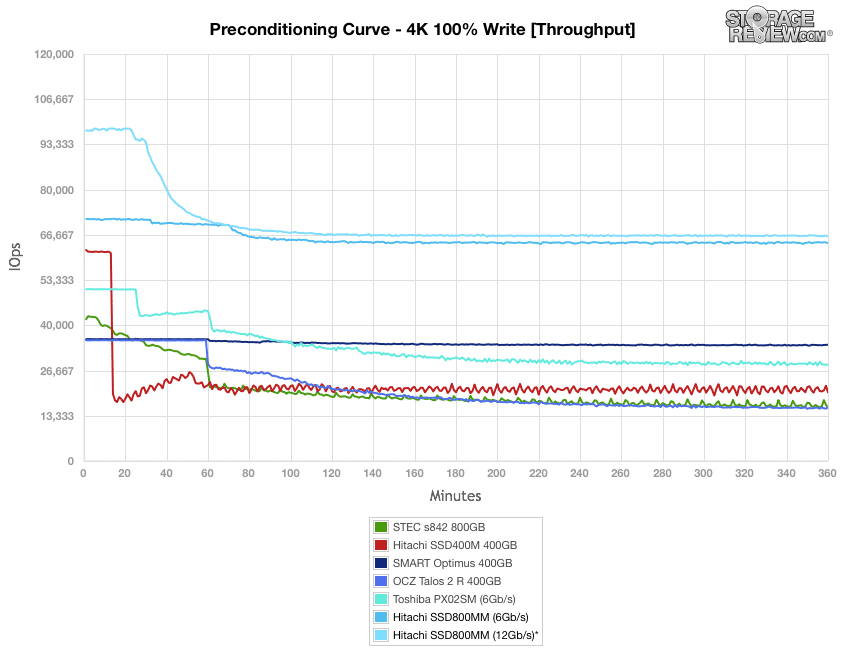
Our first test measures 100% 4k random write performance with a load of 16T/16Q. In this setting, the bursting nature of the HGST Ultrastar SSD800MM 12Gb/s tested as high as 98,024 IOPS, which then leveled off around 66,000 IOPS as the drive neared steady-state. Both figures were far ahead of the competition. The 6Gb/s interface SSD800MM, though not as high as the 12Gb/s at the start, was still quite far ahead of the competition.
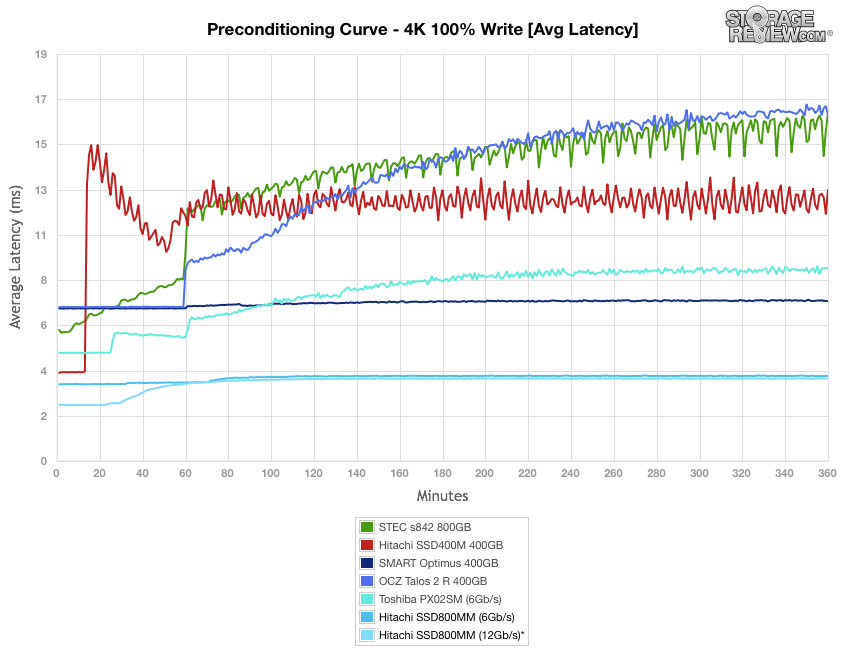
Next we took a look average latency. With a heavy 16T/16Q load, the HGST Ultrastar SSD800MM measured 2.62ms with the 12Gb/s SAS interface and 3.58ms with the 6Gb/s SAS interface in burst and both scaled up to around 3.9ms as it neared steady-state. These marks again left the competition behind.
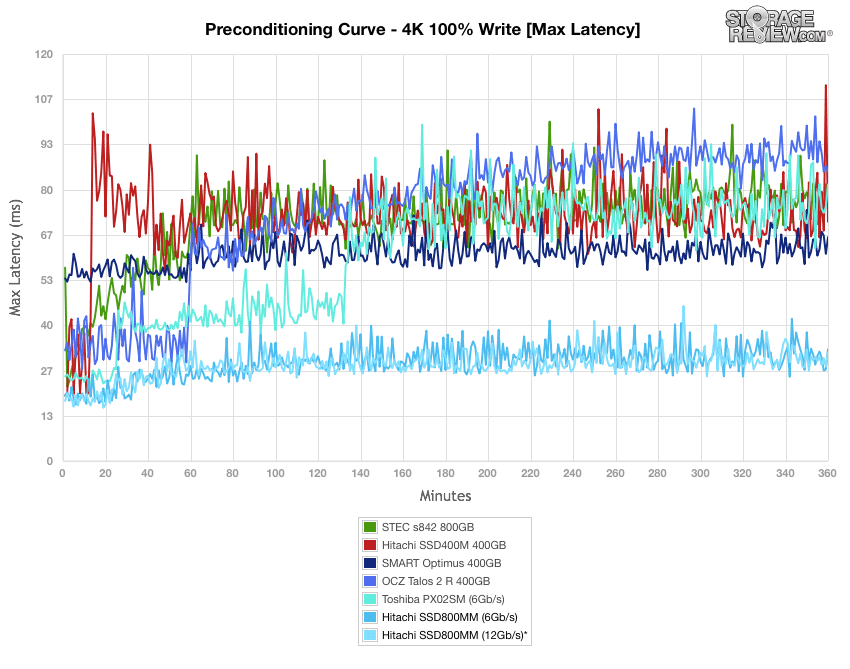
Comparing max latency between the SSDs, the HGST Ultrastar SSD800MM had max response times ranging 18-35ms in steady-state with both interfaces. That range was superior to the competition as was the steady-state range. The SSD800MM produced about half the latency of the next closest drive.
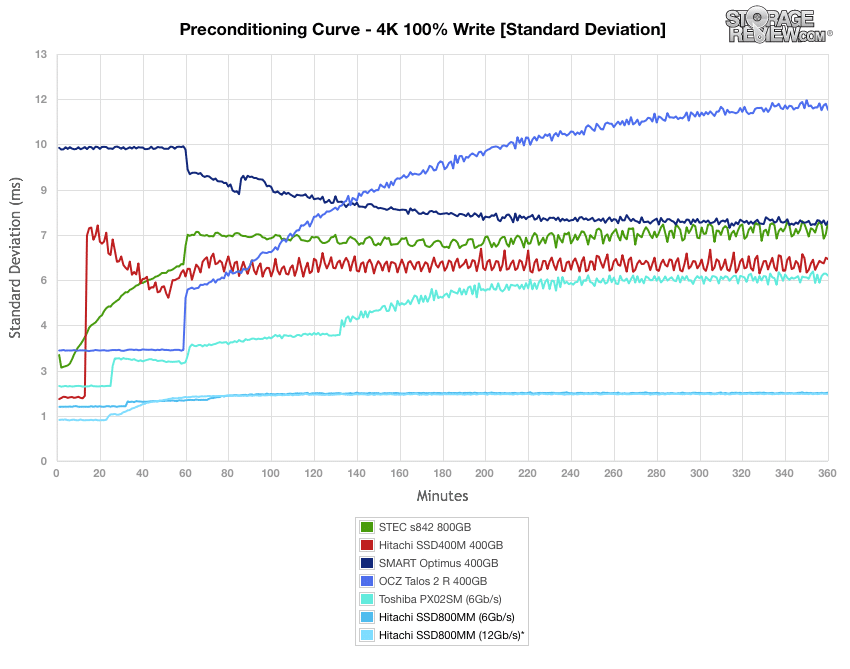
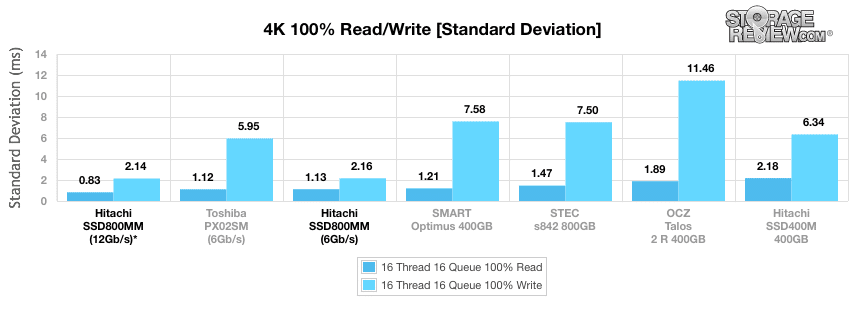
Looking even closer at the latency consistency in our 4k random write workload, the HGST Ultrastar SSD800MM 12Gb/s placed first around 2.1ms for the 12Gb/s interface and 2.2ms for the 6Gb/s interface. Again producing results that were double of the next closest drive.
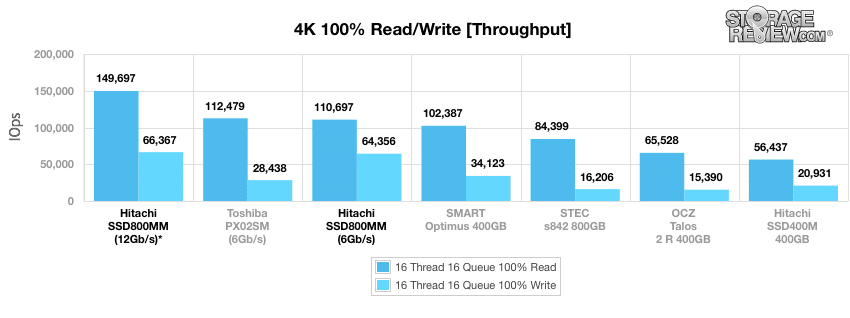
Next we measured random 4K throughput. The HGST Ultrastar SSD800MM 12Gb/s offered 4k random read performance at a class-leading 149,697 IOPS with write activity at 66,367 IOPS. The 6Gb/s interface offered read performance of 110,697 IOPS (slightly lower than the read performance of the Toshiba PX02SM, with 112,479 IOPS) and a write performance of 64,356 IOPS. Again, the SSD800MM produced the top figures. This time, the write performance was much more impressive than the read performance.
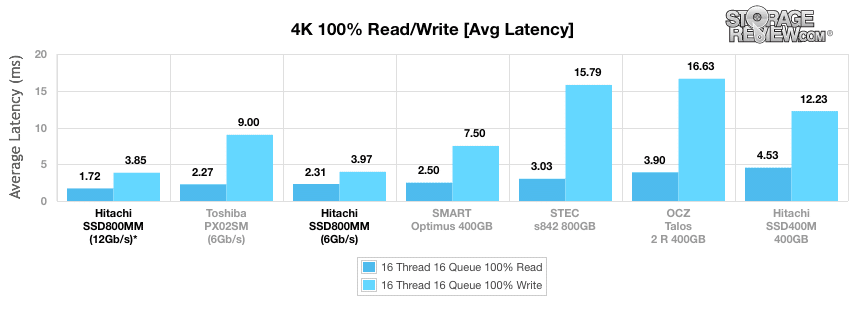
With a workload of 16T/16Q, the HGST Ultrastar SSD800MM 12Gb/s offered an average 4k random read latency of 1.72ms, with a write latency of 3.85ms. While the 6Gb/s interface had a write performance of 3.97ms, its read performance was again higher than the Toshiba PX02SM, with speeds of 2.31ms and 2.27ms respectively.
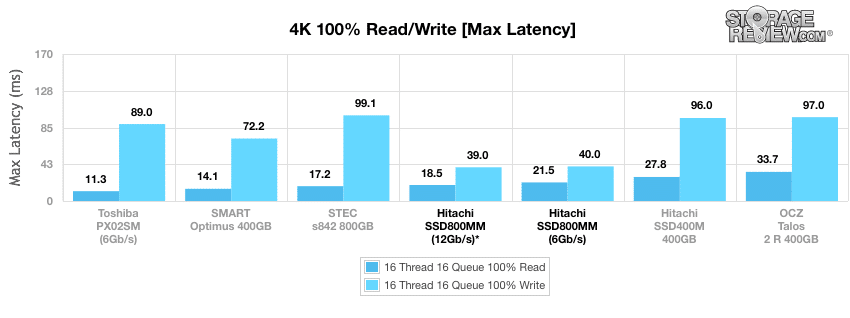
For max latency, the HGST Ultrastar SSD800MM 12Gb/s was knocked off its perch into the middle of the pack with a read speed of 18.5ms and the 6Gb/s interface fell even further with a 21.55ms read speed. However both interfaces blew by the pack easily on the write with 39ms for the 12Gb/s and 40ms for the 6Gb/s.
Comparing latency consistency, the HGST Ultrastar SSD800MM 12Gb/s interface posted the strongest figures in 4k random read and write consistency. While the 6Gb/s interface came in second with writer performance it did fall slightly behind the Toshiba PX02SM in read performance.
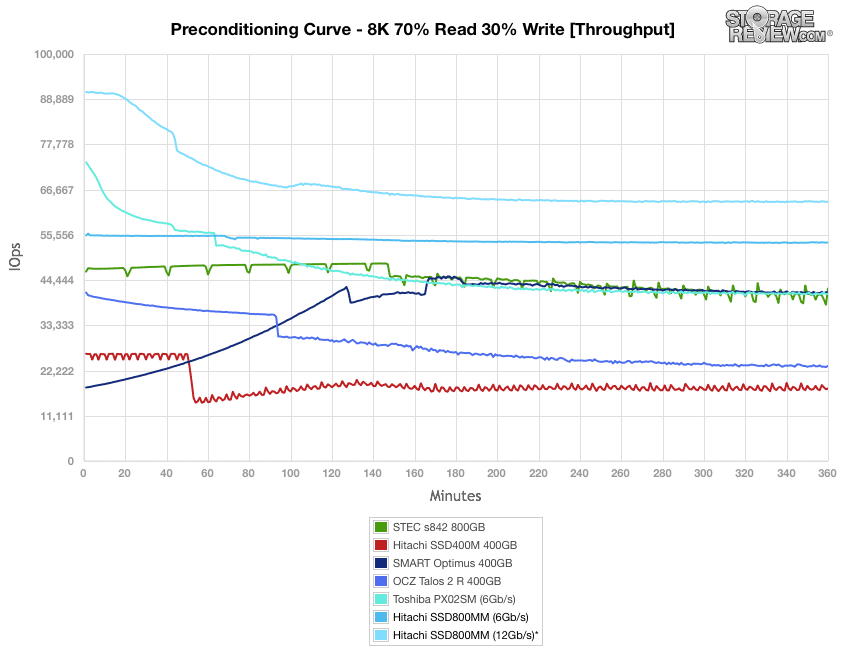
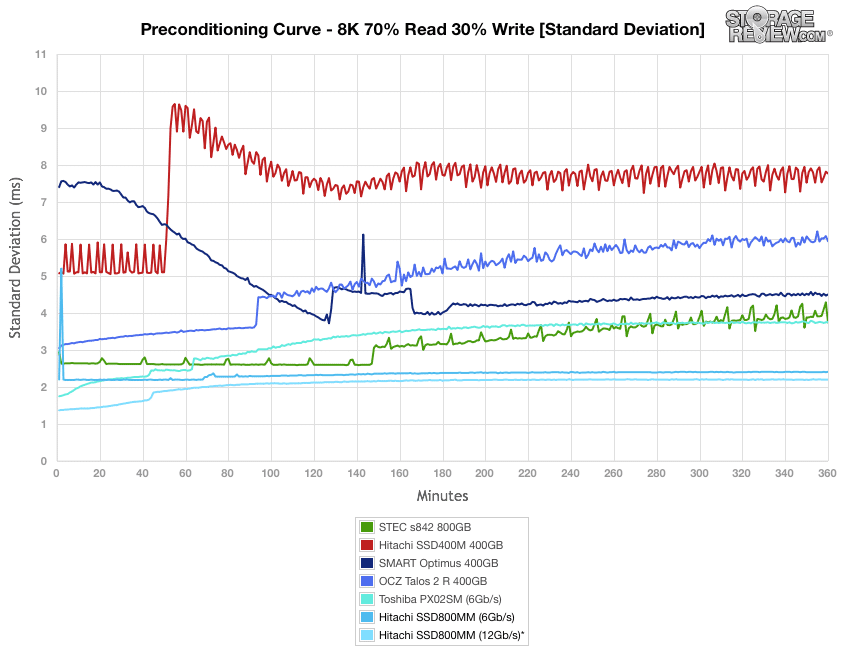
In our next workload we look at an 8k profile with a 70/30 read/write mixed ratio. In this setting, the HGST Ultrastar SSD800MM 12Gb/s produced the greatest throughput starting off around 90,000 IOPS burst which slowed to a speed around 64,000 IOPS near steady-state. The burst performance provided about 20,000 more IOPS than the Toshiba PX02SM and the difference was more or less maintained throughout.
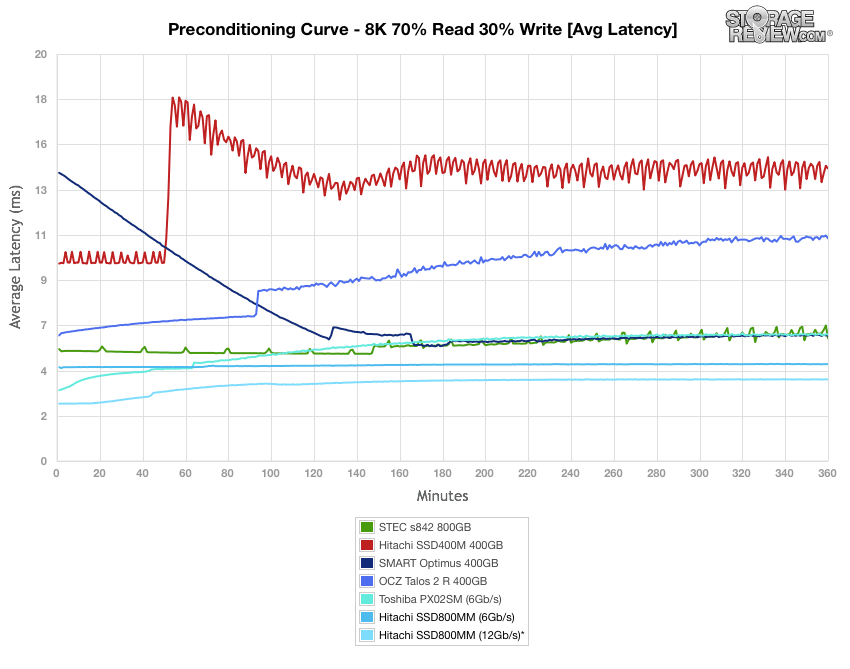
Average latency of the HGST Ultrastar SSD800MM 12Gb/s measured 2.82ms at the beginning of our 8K 70/30 preconditioning test, which increased to around 4ms as it neared steady-state. While the Toshiba PX02SM started off lower than the SSD800MM 6Gb/s (3.48ms to 4.61ms), the SSD800MM 6Gb/s dropped lower at it neared steady-state.
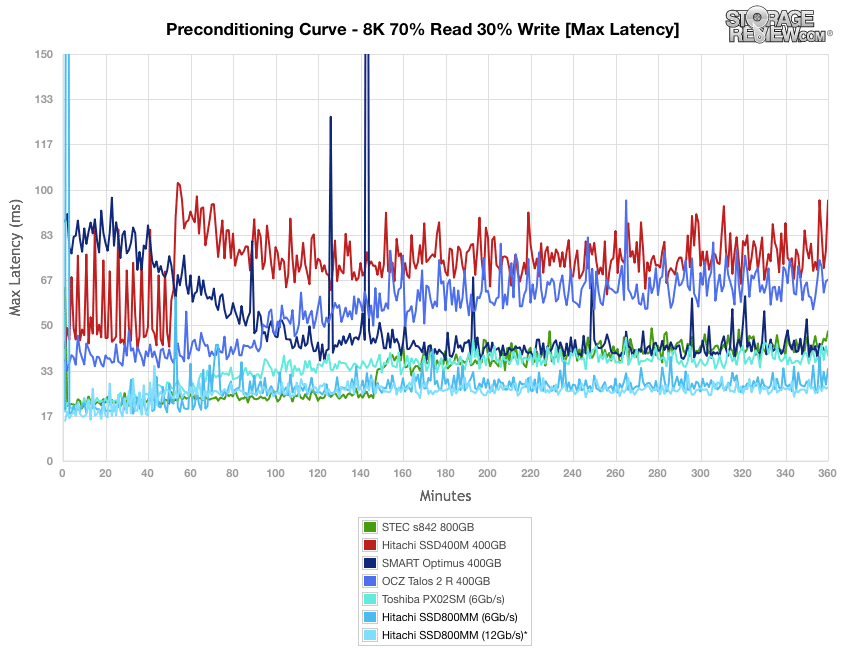
Over the duration of our 8k 70/30 test, the HGST Ultrastar SSD800MM 12Gb/s again was at the top of the pack but only as it neared steady-state. Early on the SSD800MM 12Gb/s interface was trading off the top spot with the 6Gb/s interface, the Toshiba PX02SM, and for quite a bit the STEC s842 800GB.
The HGST Ultrastar SSD800MM 12Gb/s latency consistency performed the best overall. The SSD800MM 6Gb/s started off trailing the Toshiba PX02SM but dropped to a lower latency as it near steady-state.
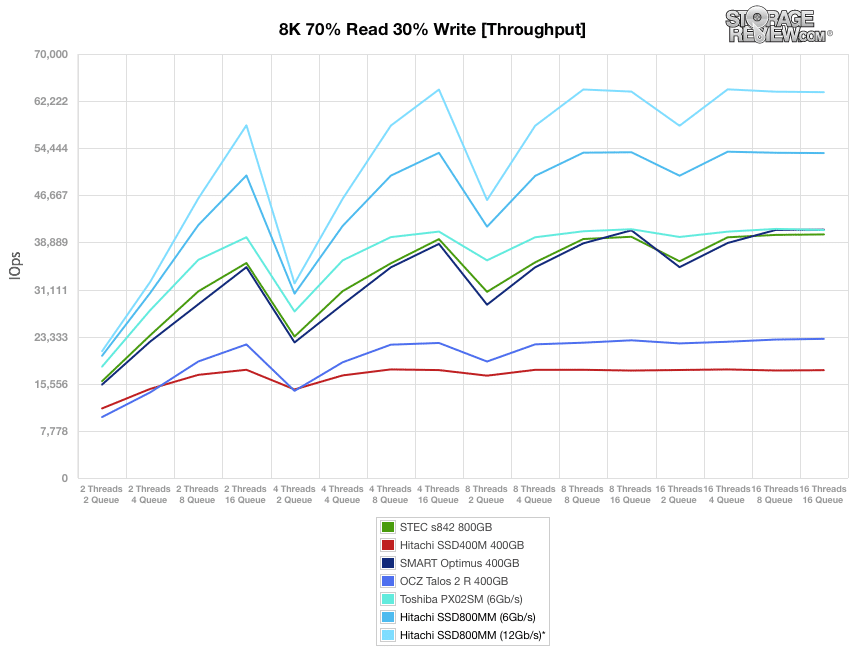
Compared to the fixed 16 thread, 16 queue max workload we performed in the 100% 4k write test, our mixed workload profiles scale the performance across a wide range of thread/queue combinations. In these tests, we span workload intensity from 2 threads and 2 queue up to 16 threads and 16 queue. In the expanded 8k 70/30 test, the HGST Ultrastar SSD800MM 12Gb/s peaked at 63,000+ IOPS which was at the top of the group by a significant margin along with the 6Gb/s which was about 10,000 IOPS lower.
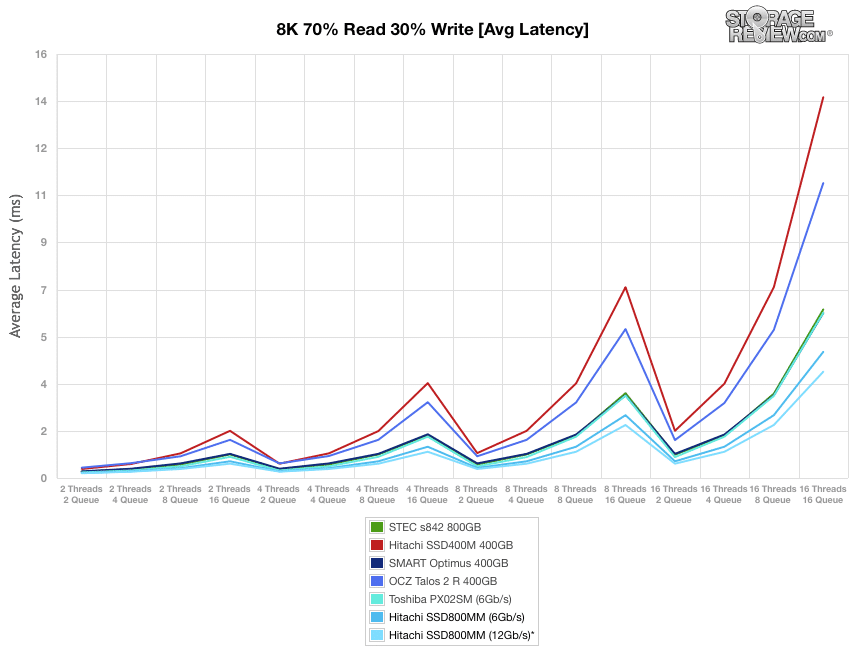
Average latency for the HGST Ultrastar SSD800MM 12Gb/s was class-best. It was trailed by the 6Gb/s interface and then the Toshiba PX02SM.
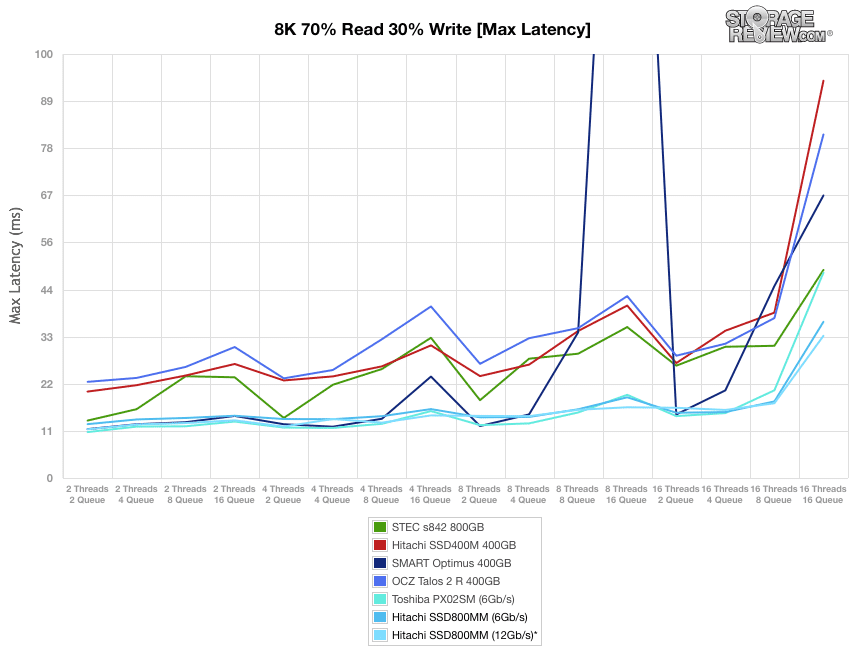
Over the duration of our varying load 8k 70/30 test, max latency stayed very low from the HGST Ultrastar SSD800MM 12Gb/s with the peak staying under 20ms for the bulk of the test until the terminal queue depth. It jumped to 33.54ms with the highest 16T/16Q load. The Toshiba PX02SM was able to edge out the HGST Ultrastar SSD800MM 12Gb/s until higher queue depths.
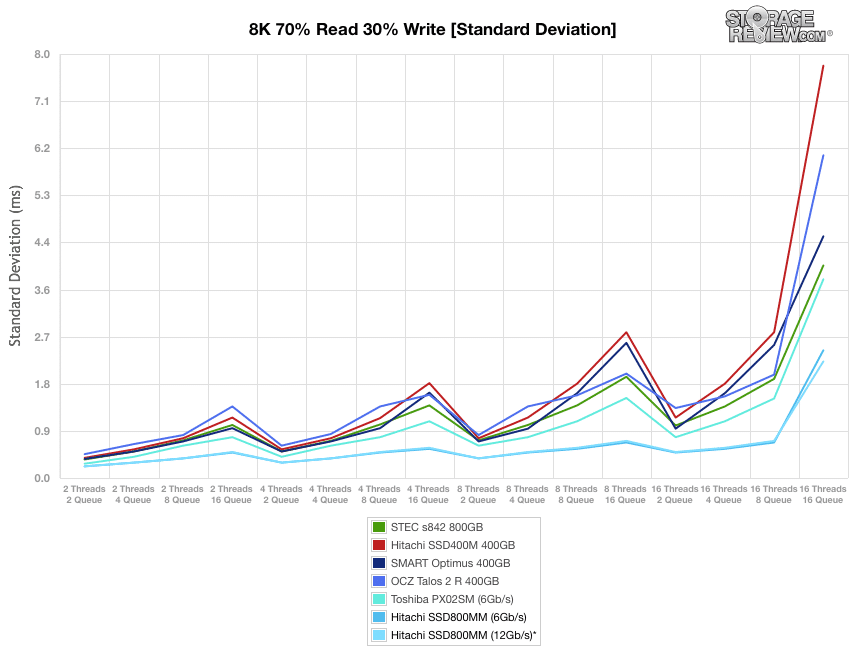
Standard deviation provided similar results to the previous average latency test with the HGST Ultrastar SSD800MM 12Gb/s again coming out on top in our test environment.
Conclusion
The HGST Ultrastar SSD800MM features a SAS3 interface, low power consumption at 11W/9W, co-developed Intel/HGST controller, 25nm MLC NAND, but is limited to a max capacity of only 800GB. The SSD800MM can handle workloads with the most performance-heavy requirements: big data analytics, high-frequency trading, online banking and cloud computing. HGST is also shipping these drives in different flavors of encryption for even greater customization of data security.
When it came time to test the HGST Ultrastar SSD800MM using our 4k and 8k synthetic benchmark tests, the SSD800MM delivered outstanding performance. With few exceptions, it provided the greatest throughput and the least latency of any comparable drive. Going a step further, its throughput was tens of thousands of IOPS ahead of the competition, and its latency was rarely matched. The HGST Ultrastar SSD800MM completely dominated the competition, leveraging its SAS3 interface to push transfer speeds even in random workloads above the ~550MB/s barrier.
In our application tests the SSD800MM didn't give an inch to competing models, setting a new record in both our MarkLogic NoSQL database benchmark with a huge drop in overall average latency as well as a huge boost in transactional performance in our Sysbench MySQL test. To sum it up, there is currently no equal to the HGST Ultrastar SSD800MM in SAS SSD space that we've seen to date.
Pros
- Out performs all of the competition across all synthetic and application benchmarks
- High endurance leveraging 25nm MLC flash
- Builds on the trusted HGST Enterprise SSD lineup
Cons
- Max capacity limited to 800GB
The Bottom Line
The HGST Ultrastar SSD800MM is defined by its performance, in both tremendous throughput and low latency, which sets a new standard for all high-performance enterprise SSDs.


 Amazon