

The Huawei ES3000 V2 PCIe SSD cards are designed to address server storage IO bottlenecks, accelerate business applications and improve overall resource utilization. The ES3000 family offers both full-height, half-length and low profile form factors, with capacity options ranging from 600GB to a maximum of 3.2TB.
As such, the ES3000 cards are equipped with 19/20 nm NAND flash and are quoted to boast upwards of 770,000 in stable read IOPS performance while its maximum read BW is set at 3,100MB/s for the 3.2TB capacity. The ES3000 line also comes with embedded ECC and dynamic RAID5 engine, which helps to ensure data reliability. In addition, its dynamic RAID algorithm allows for resource sharing between channels to help eliminate the loss of data because of channel failure. This single-chip failure protection removes the defective memory chip while the RAID algorithm restores data and automatically rebuilds a RAID group to ensure that the ES3000 continues to be up and running.
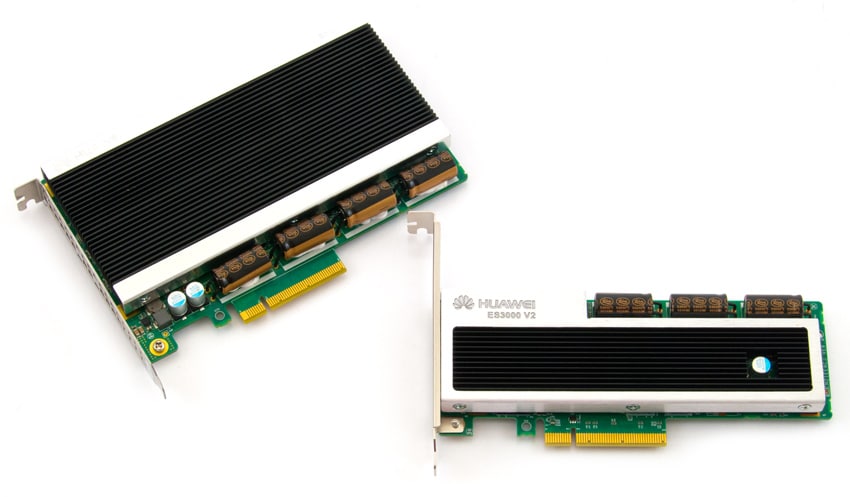
The Huawei ES3000 ships in plethora of capacities: 600GB, 800GB, 1.2TB, 1.6TB, 2.4TB and 3.2TB. For this review, we will be looking at the 1.6TB low-profile and 3.2TB FHHL cards, the latter which is equipped with two controllers. This is essentially two 1.6TB drives combined; however, the storage is all resides in a single pool. In the past, it was quite common for multi-controller cards to leverage two different pools of storage that had to be combined at the host (server) level.All drives are backed by a 5-year warranty.
Huawei ES3000 V2 PCIe SSD Specifications
- Usable Capacity:
- 600GB
- 800GB
- 1.2TB
- 1.6TB
- 2.4TB
- 3.2TB
- NAND Type: 19/20nm MLC
- Bus Interface: PCIe 2.0 x8
- Performance:
- Max Read BW (GB/s): 3.1 (3.2TB), 1.55 (1.6TB)
- Stable Read IOPS (4 KB): 770,000 (3.2TB), 395,000 (1.6TB)
- Max. Write BW (GB/s):
- 1.1 (1.6TB)
- 2.2 (3.2TB)
- Max. Write IOPS (4 KB):
- 270,000 (1.6TB)
- 540,000 (3.2TB)
- Stable Write IOPS (4 KB):
- 115,000 (1.6TB)
- 230,000 (3.2TB)
- Power Consumption
- 12W to 25W (1.6TB)
- 25W to 55W (3.2TB)
- Endurance: 3 DWPD, 5 years
Design and Build
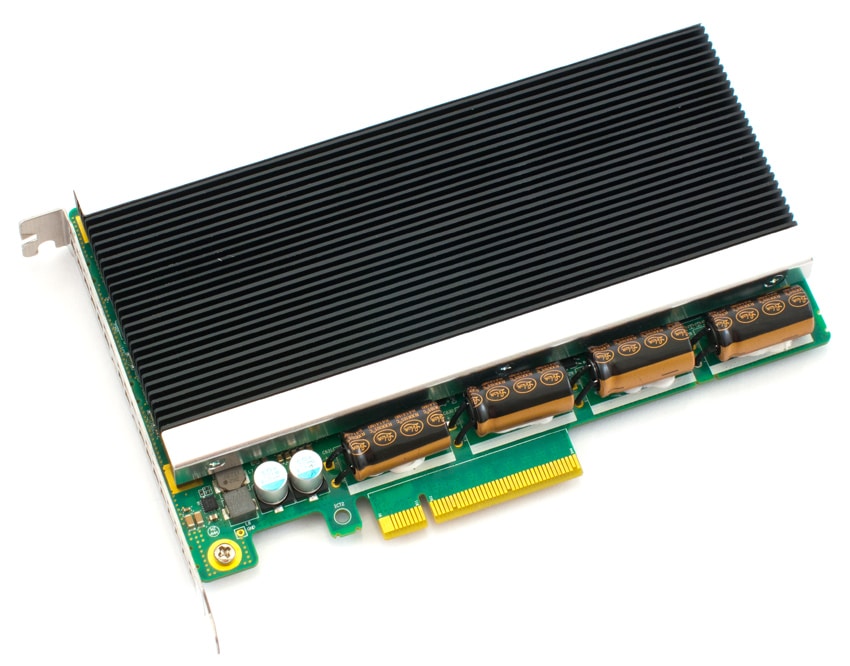
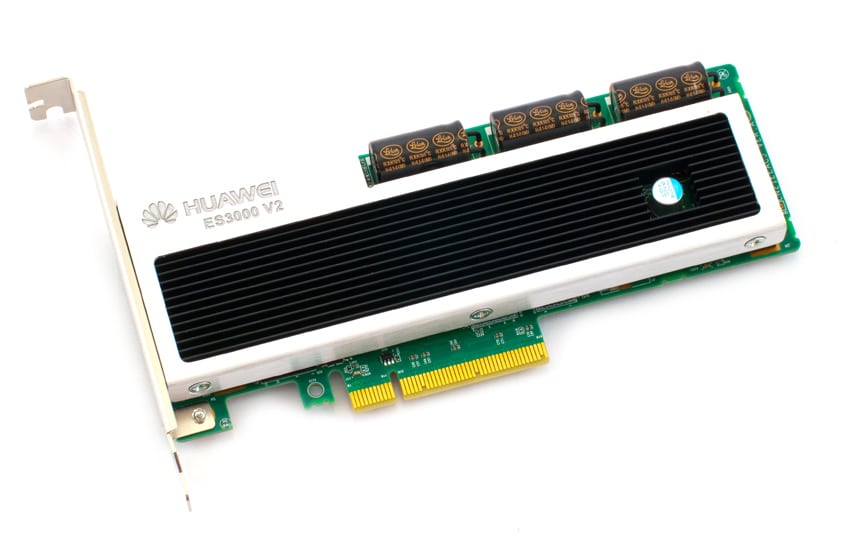
One side of the drives is a large black heat sink with Huawei branding near the top. The full height has branding on both corners and the half-height has branding in the upper left hand corner. The full-height drive has 4 capacitors near the bottom by the PCIe interface and the half-height drive has 3 capacitors at the top of the drive.
On the opposite side of the drive is an exposed circuit board where one can see the Micron NAND packs and SK Hynix DRAM chips. Both form factors have stickers on them with information such as model number and power rating.
Testing Background and Comparables
The StorageReview Enterprise Test Lab provides a flexible architecture for conducting benchmarks of enterprise storage devices in an environment comparable to what administrators encounter in real deployments. The Enterprise Test Lab incorporates a variety of servers, networking, power conditioning, and other network infrastructure that allows our staff to establish real-world conditions to accurately gauge performance during our reviews.
We incorporate these details about the lab environment and protocols into reviews so that IT professionals and those responsible for storage acquisition can understand the conditions under which we have achieved the following results. None of our reviews are paid for or overseen by the manufacturer of equipment we are testing. Additional details about the StorageReview Enterprise Test Lab and an overview of its networking capabilities are available on those respective pages.
We tested the Huawei while comparing it to the following other AIC NVMe SSDs:
- Memblaze PBlaze4 3.2TB
- Intel DC P3608 1.6TB
- HGST Ultrastar EN150
Application Workload Analysis
In order to understand the performance characteristics of enterprise storage devices, it is essential to model the infrastructure and the application workloads found in live production environments. Our first benchmarks for the Memblaze PBlaze4 are therefore the MySQL OLTP performance via SysBench and Microsoft SQL Server OLTP performance with a simulated TCP-C workload. For our application workloads each drive will be running 2-4 identically configured VMs.
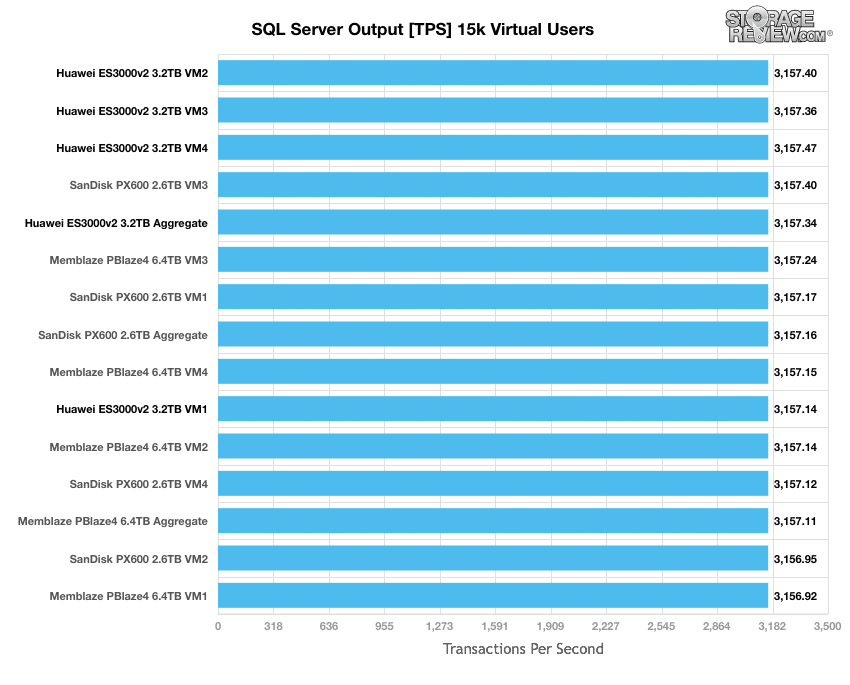
StorageReview’s Microsoft SQL Server OLTP testing protocol employs the current draft of the Transaction Processing Performance Council’s Benchmark C (TPC-C), an online transaction processing benchmark that simulates the activities found in complex application environments. The TPC-C benchmark comes closer than synthetic performance benchmarks to gauging the performance strengths and bottlenecks of storage infrastructure in database environments. Each instance of our SQL Server VM for this review uses a 333GB (1,500 scale) SQL Server database and measures the transactional performance and latency under a load of 15,000 virtual users.
When looking at SQL Server Output, the Huawei drive posted the best results with a top TPS of 3,157.40 with an aggregate of 3,157.34 TPS.
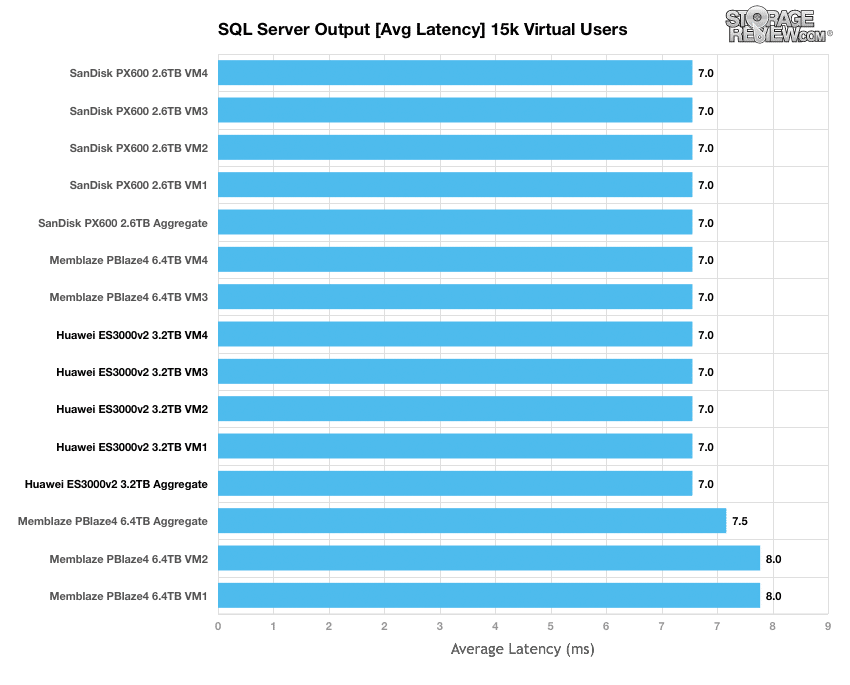
Average latency results during the 15k user SQL Server benchmark showed the Huawei drive at the top of the leaderboard with three other drives: the SanDisk, Memblaze and HGST SSDs; all of which posted 7.0ms.
The next application benchmark consists of a Percona MySQL OLTP database measured via SysBench. This test measures average TPS (Transactions Per Second), average latency, as well as average 99th percentile latency. Percona and MariaDB are using the Fusion-io flash-aware application APIs in the most recent releases of their databases, although for the purposes of this comparison we test each device in their "legacy" block-storage modes.
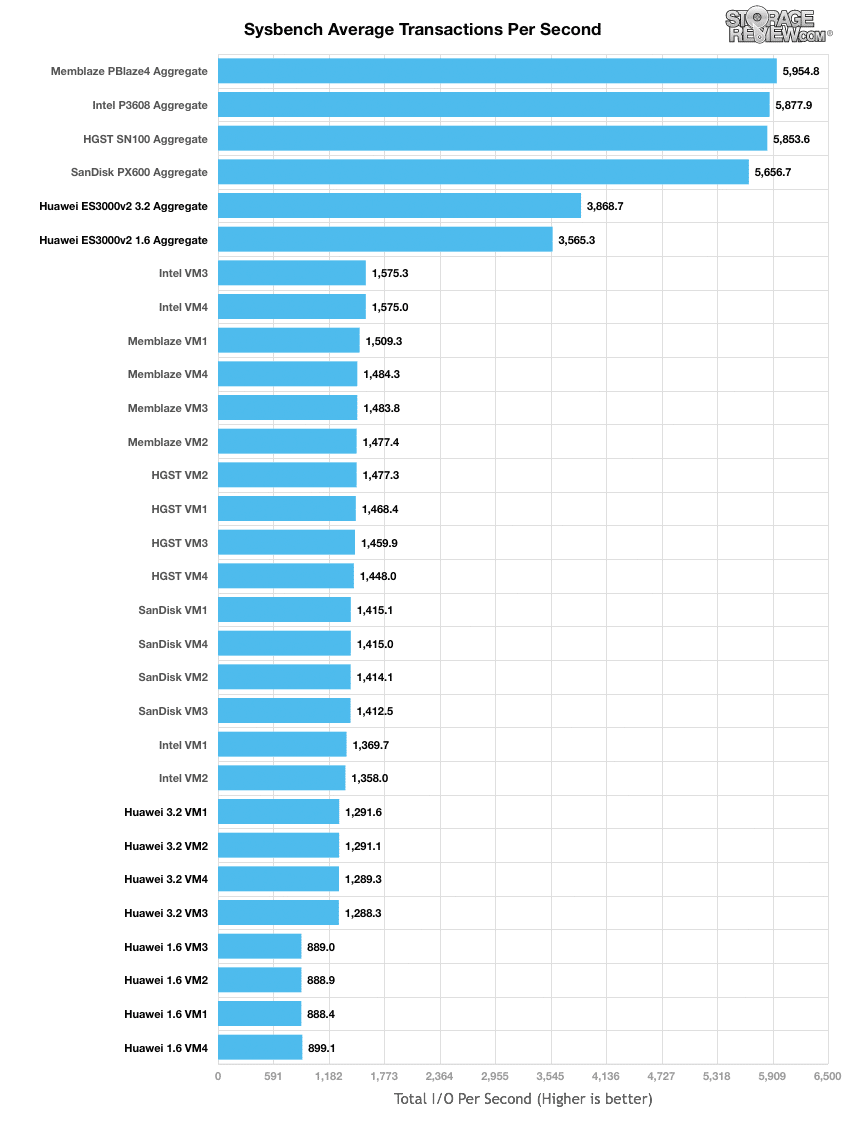
In the average transactions per second benchmark, both Huawei capacities placed at the bottom of the leaderboard with aggregate of 3,868.7 TPS (3.2TB) and 3,565.3 TPS.
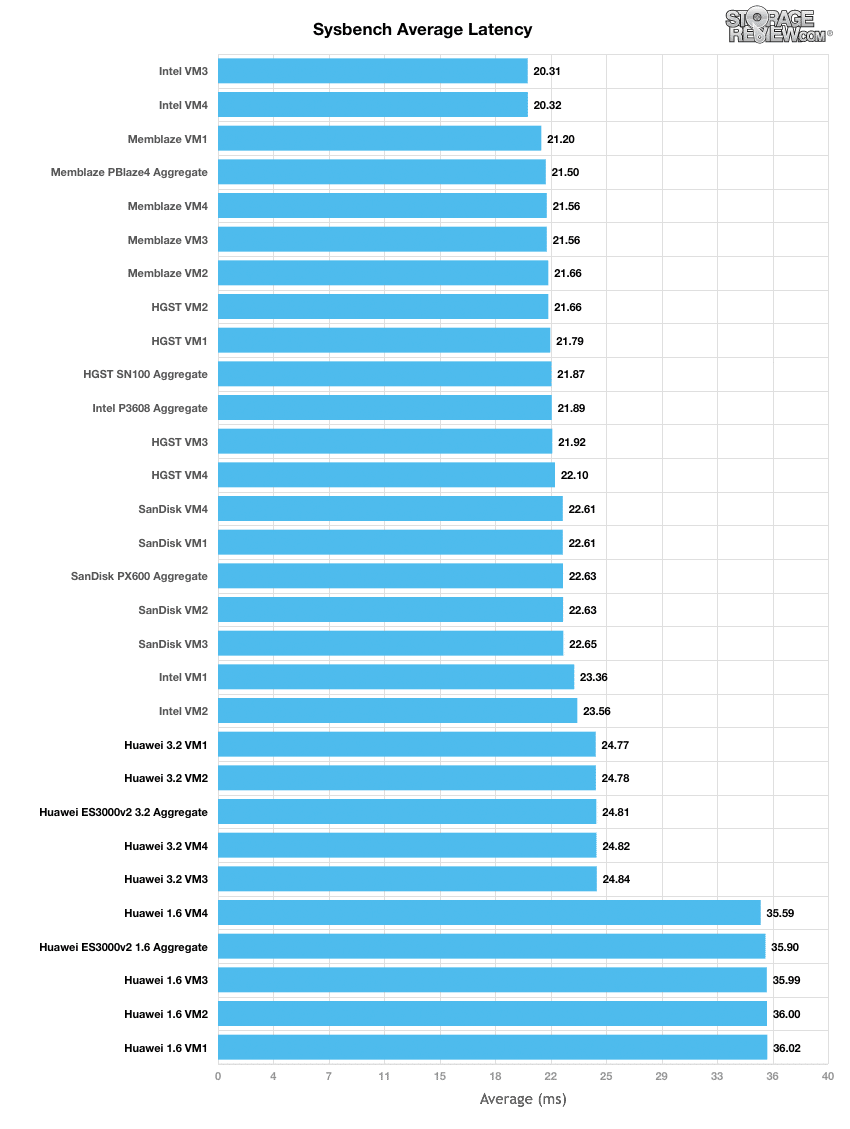
When looking at average latency results, the HGST boasted fairly good results, with individual VMs running between 21.66ms through 22.10ms and aggregate latency of 21.87ms.
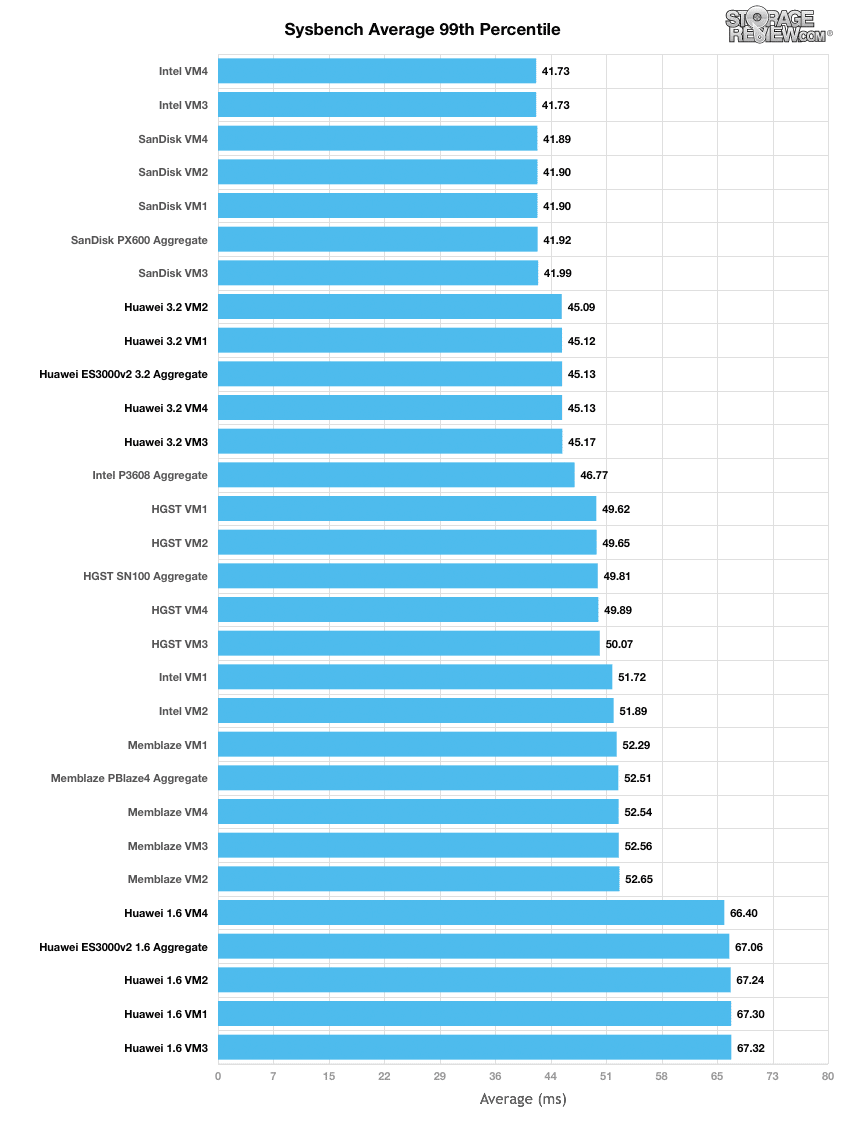
In terms of our worst-case MySQL latency scenario (99th percentile latency), both Huawei capacities placed at the bottom of the pack. The top performing drive was the SanDisk, which boasted an impressive aggregate of just 41.92ms.
Enterprise Synthetic Workload Analysis
Flash performance varies as the drive becomes conditioned to its workload, meaning that flash storage must be preconditioned before each of thefio synthetic benchmarks in order to ensure that the benchmarks are accurate. Each of the comparable drives are secure erased using the vendor's tools and preconditioned into steady-state with a heavy load of 16 threads and an outstanding queue of 16 per thread.
- Preconditioning and Primary Steady-State Tests:
- Throughput (Read+Write IOPS Aggregate)
- Average Latency (Read+Write Latency Averaged Together)
- Max Latency (Peak Read or Write Latency)
- Latency Standard Deviation (Read+Write Standard Deviation Averaged Together)
Once preconditioning is complete, each device is then tested in intervals across multiple thread/queue depth profiles to show performance under light and heavy usage. Our synthetic workload analysis for the Memblaze PBlaze4 uses two profiles, which are widely used in manufacturer specifications and benchmarks. It is important to take into consideration that synthetic workloads will never 100% represent the activity seen in production workloads, and in some ways inaccurately portray a drive in scenarios that wouldn't occur in the real world.
- 4k
- 100% Read and 100% Write
- 8k
- 70% Read/30% Write
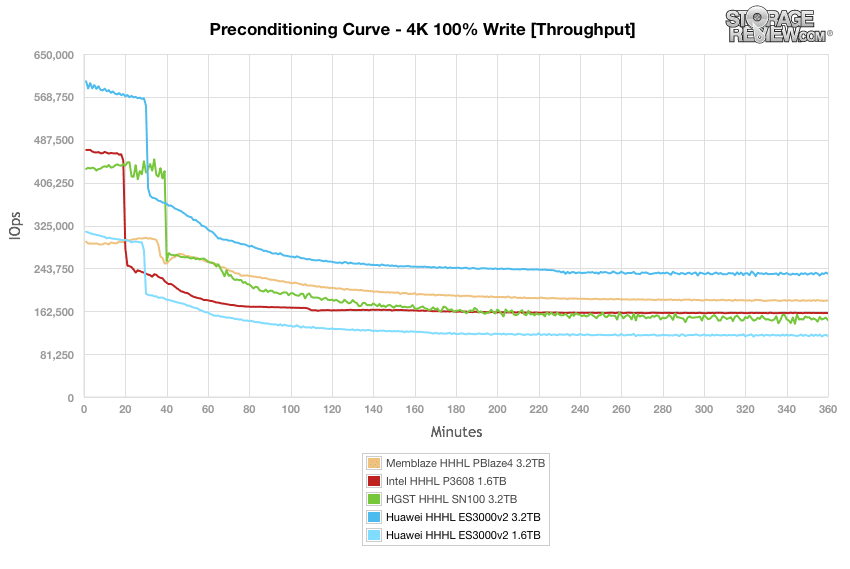
In our throughput 4k write preconditioning test, top overall performing drive here was the Huawei 3.2TB drive. The 1.6TB model started at roughly 320,000 IOPS while hitting somewhat of a steady-state around 120,000 IOPS mark.
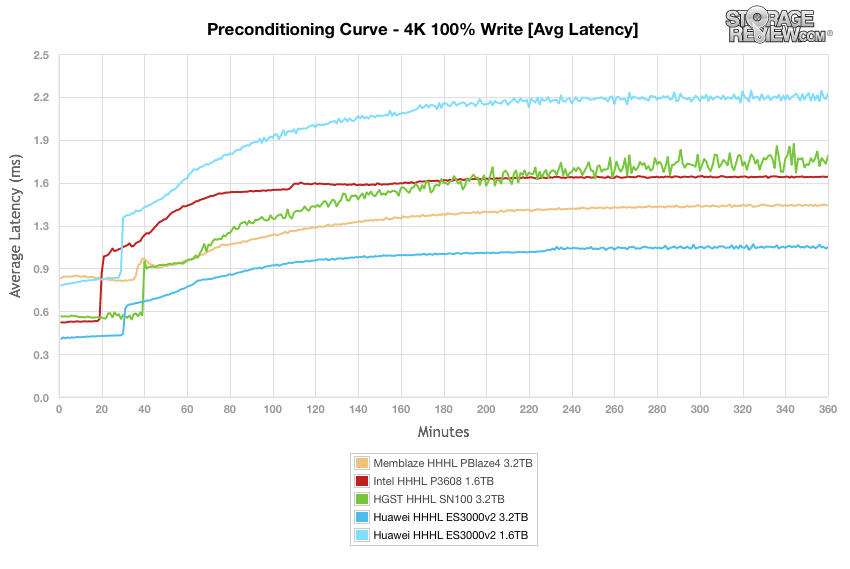
Next we look at average latency where the top drive was the Huawei 3.2TB once again, which had a steady state that measured just over 1.0ms. The 1.6TB drive was on the other side of the spectrum at the bottom of the leaderboard.
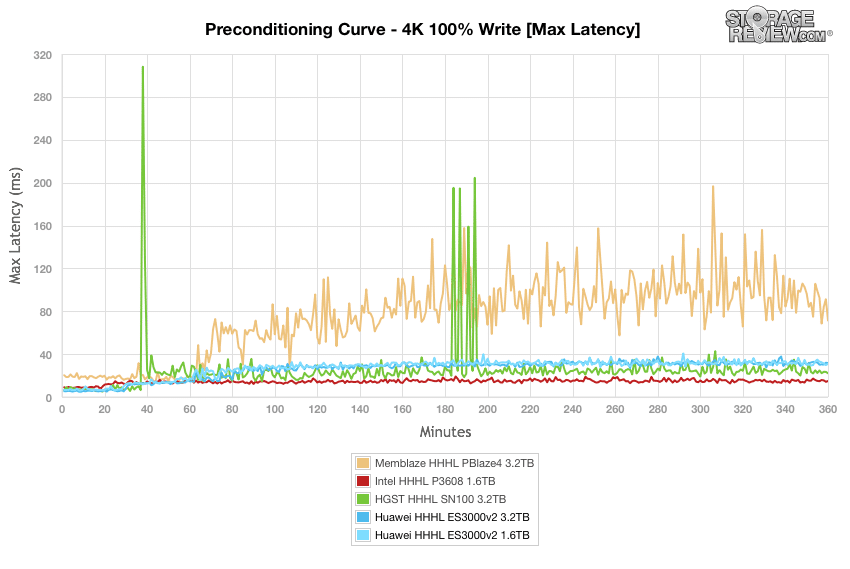
When measuring max latency, the both Huawei capacities had near identical results throughout the test, only peaking over the 40ms mark on one occasion. Overall, the Intel drive showed the best performance.
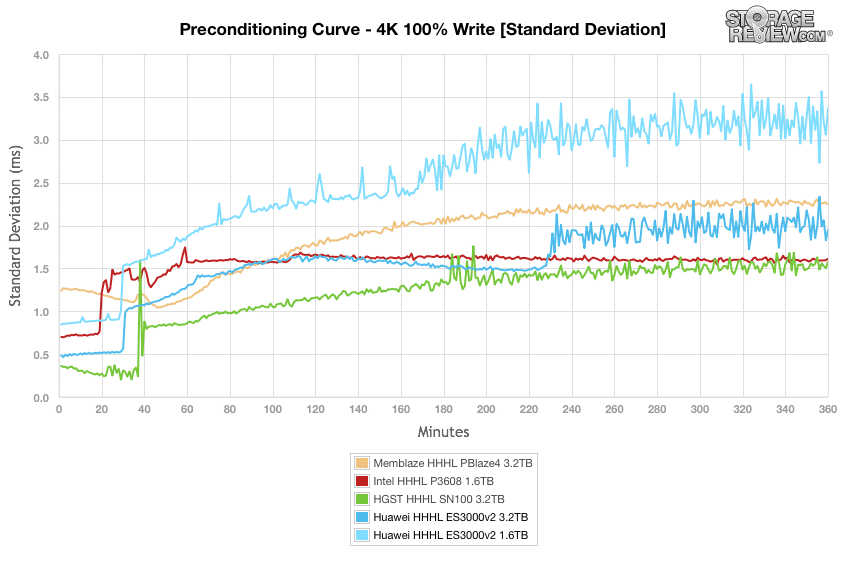
In essence, standard deviation calculations is designed make it easier for us to visualize the consistency of the SSD latency. Here, both Huawei drives posted inconsistent results, particularly the 1.6TB model (reaching over 3.5ms). While the HGST had the best latency by the end of the test, the Intel had the most stable results overall, hovering under 1.6ms in its stable-state.
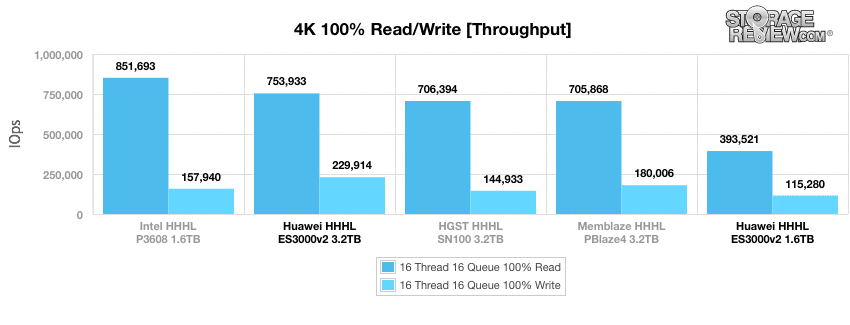
Now that the drives have been pre-conditioned, we will look the primary 4k synthetic benchmark. In throughput, the 3.2TB Huawei showed excellent results with 753,933 IOPS read and a leading 229,914 IOPS write; however, the 1.6TB model recorded results that placed it at the bottom of the pack. Intel drive was the top performer in the read column with an impressive 851,693 IOPS.
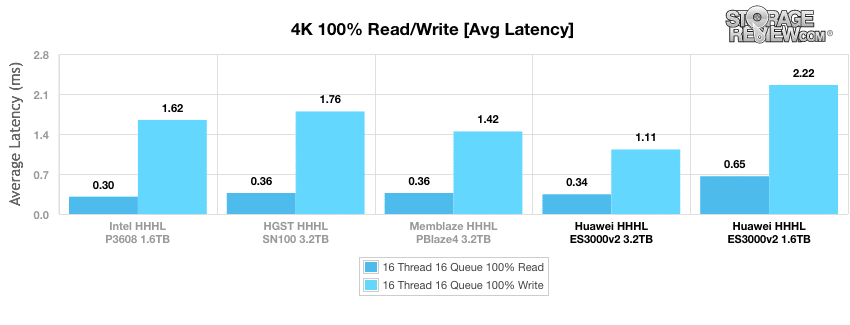
Looking at average latency showed both Huawei drives at the bottom of the leaderboard; however, the Huawei 3.2TB drive posted the best write latency with 1.11ms. The Intel recorded the best average latency in reads with 0.03ms.
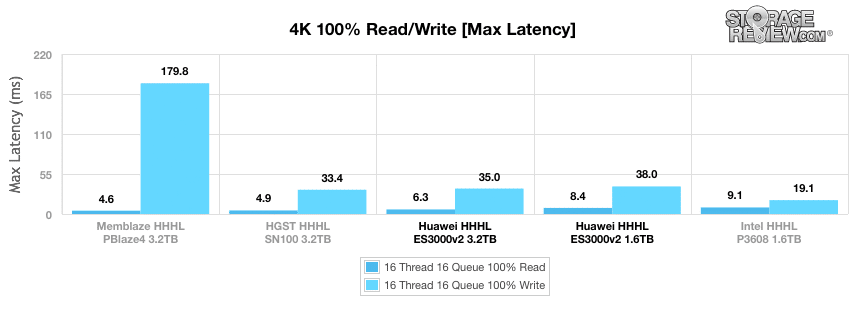
In max latency, the Huawei drives boasted fairly good results, with 4.9ms read/33.4ms write and 8.4ms read and 38.0ms write for the 3.2TB and 1.6TB, respectively. The top performer in reads was the Memblaze drive with 4.6ms though it had slowest write latency.
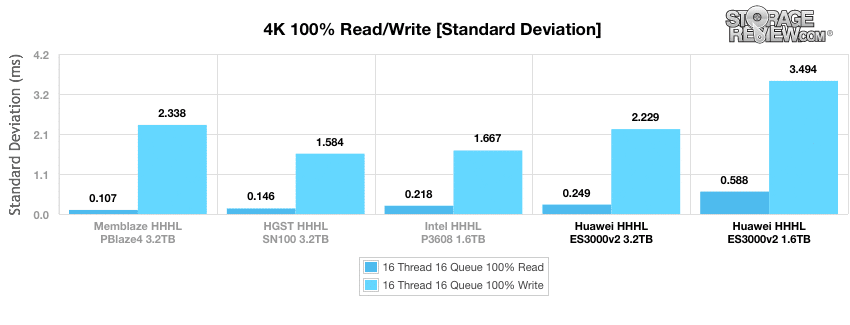
Looking at standard deviation shows the Huawei drives at the bottom of the leaderboard again, with the 3.2TB model posting 0.249ms read and 2.229ms write. The top performer in reads was the Memblaze drive, which boasted an impressive 0.107ms.
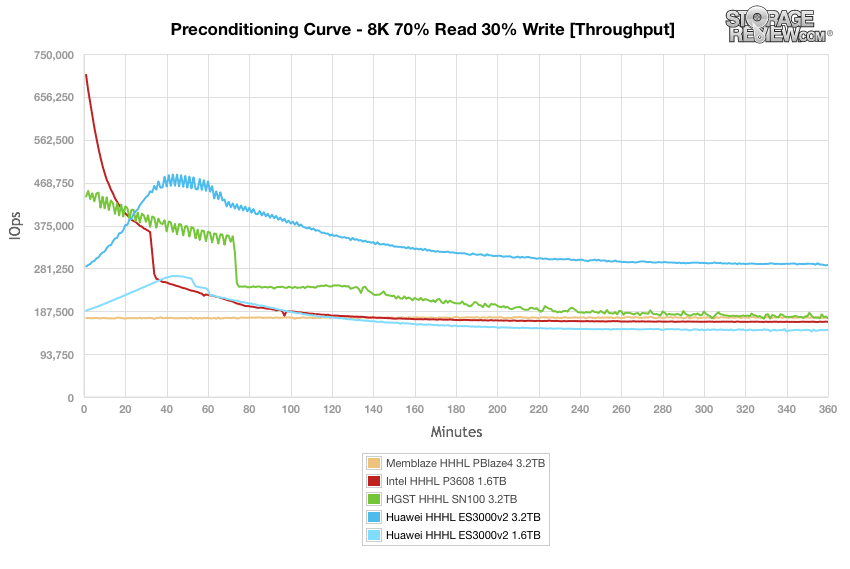
Our next workload uses 8k transfers with a ratio of 70% read operations and 30% write operations. That being said, we will start off with the preconditioning results before switching to the main tests. In throughput, the Huawei 3.2TB drive showed the best performance by once its reached steady-state around 282,000 IOPS, though it had a bit of a rough, inconsistent start. The 1.6TB model finished at the bottom of the leaderboard.
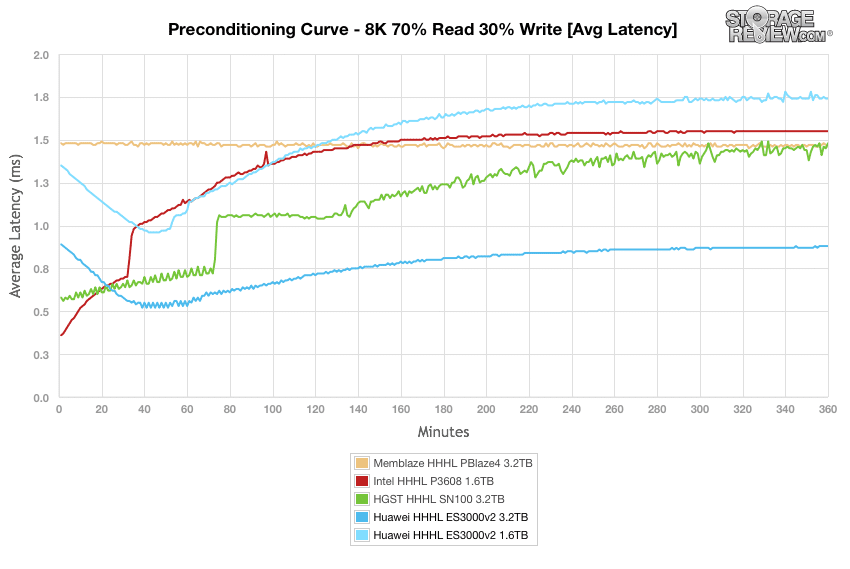
Next we look at average latency where the 3.2TB Huawei drive demonstrated the same trend as throughout: a weaker start but ending very strong. That said, it had a steady at just under 1.0ms.
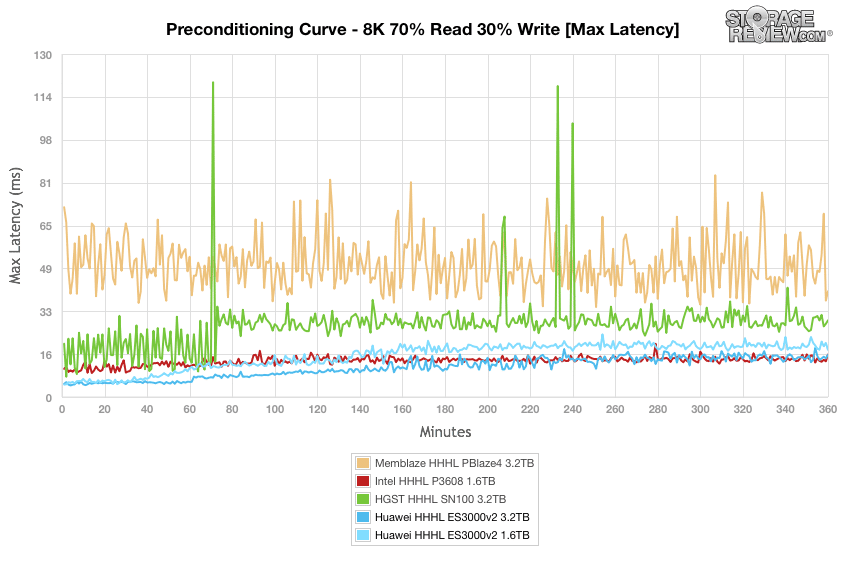
When measuring max latency, both Huawei capacities were two of the most consistent drives, as both showed no major spikes throughout the test. The top performer was the 3.2TB model, which hovered around the 16ms mark by the end.
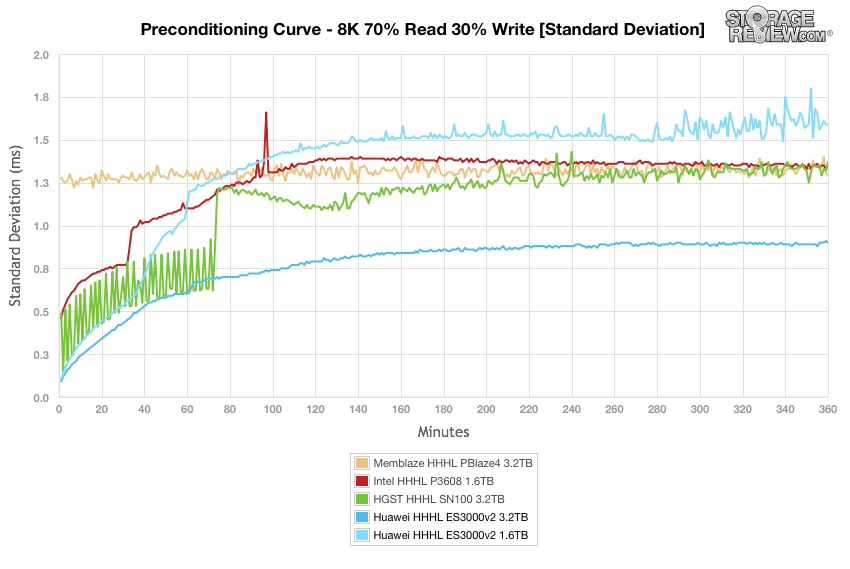
In standard deviation calculations, the 3.2TB Huawei drive had the best latency by a significant margin, recording an impressive stable state under 1.0ms. The 1.6TB, unfortunately, had the opposite result, placing at the bottom of the leaderboard.
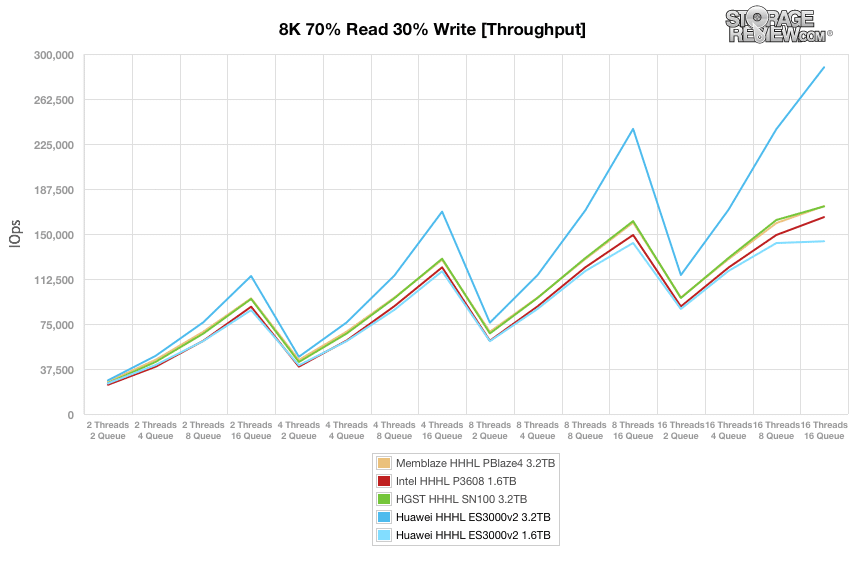
After we fully preconditioned the drive, we put it through our main 8k 70/30 test. In throughput, most of the drive boasted near identical performance with the exception of the Huawei 3.2TB, which pulled away from the pack quite early on and ended up with an incredible 280,000 IOPS in the terminal.
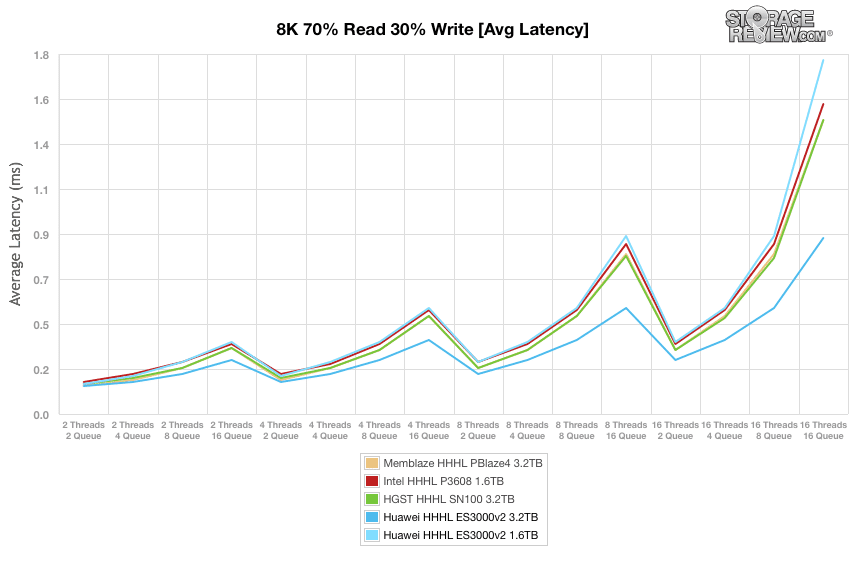
Results were mirrored when looking at average latency, with the Intel, Memblaze, HGST, and 1.6TB Huawei drives performing boasting near identical performance. Again, the top performing drive was the 3.2TB Huawei drive, which ended up just under 0.9ms in the terminal queue depths.
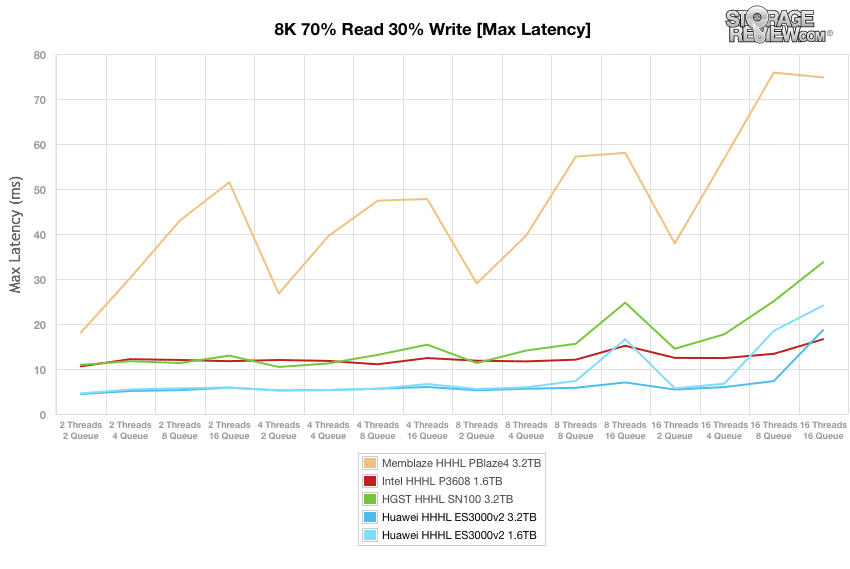
Looking at max latency showed both Huawei drives with very little latency, though it did begin to spike near the end of the test. Overall, the Intel drive showed the best results.
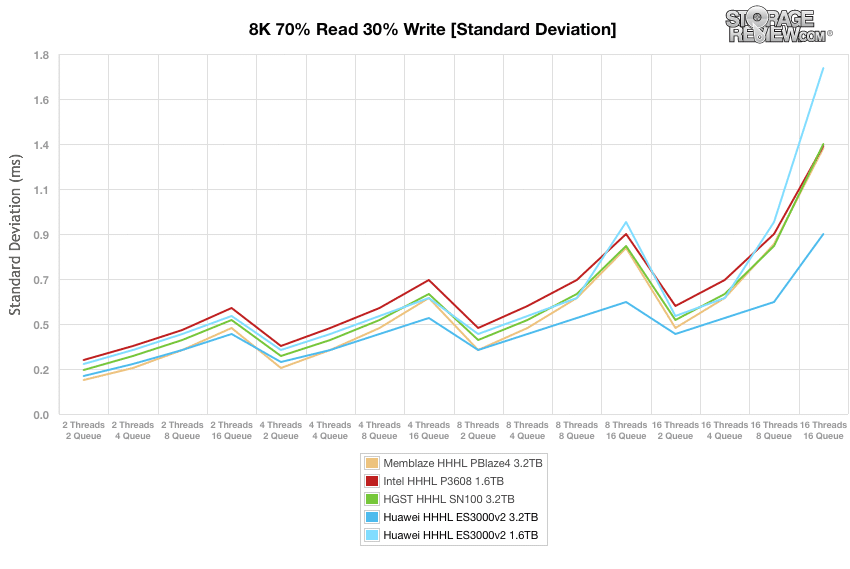
Standard deviation showed performance very similar to that of the max and average latency readings. Here, the Huawei 3.2TB drive pulled away around the 8T8Q mark, recording the best overall results with roughly 0.9ms.
Conclusion
Huawei’s AIC NVMe SSDs come in two form factors both full-height and half-height and a variety of capacities ranging from 600GB all the way up to 3.2TB. As with all the new NVMe AIC SSDs, the Huawei ES3000 v2 drives come with claims of high performance (up to 770K IOPS read and 230K IOPS write, for stable performance) and very low latency (31µs read and 9µs write). As with most of the recently introduced NVMe AIC SSDs, Huawei’s drives are also aimed at databases, HPC, and cloud computing.
Looking at performance, the Huawei drives we tested performed well in our SQL Server application tests (however all of the drives we tested came very close to one another). The 3.2TB drive had enough capacity for our SQL tests as the 1.6TB drive did not. The ES3000 3.2TB should an aggregate performance of 3,157.34 TPS putting it near the top of the pack, though individual VMs did run in the top spots. Average SQL server latency was at 7ms across the board tying the Huawei for top spot. Moving on to Sysbench the Huawei Drives didn’t perform as well. In the transactions per second benchmark both drives had the lowest scores in individual VMs that led to the lowest aggregate scores. With average latency we saw the same placement with the 3.2TB model performing slightly better than the 1.6TB model. With the 99th percentile Sysbench the 3.2TB model pulled itself up into second place with an aggregate score of 45.13ms but the 1.6TB model fell to the bottom of the pack.
Switching over to our synthetic tests, the Huawei drives showed fairly consistent performance in most of our preconditioning benchmarks. Getting into the main benchmarks the 3.2TB ES3000v2 showed a better performance than in the Sysbench tests. In our 4K throughput the 3.2TB Huawei had the best write performance at 229, 914 IOPS and the second bet read performance at 753,933 IOPS. With 4K average and max latency the 3.2TB ran in the middle to top end of the pack. In our 8K 70/30 tests the Huawei 3.2TB drive really shined coming out as the top performer in every test.
Pros
- Strong SQL performance
- Best performance overall in 8K (3.2TB version)
- Most consistent overall in preconditioning benchmarks
Cons
- Poor Sysbench performance
- 1.6TB version trailed in most benchmarks
The Bottom Line
The Huawei ES3000v2 is an AIC NVMe SSD family that offers two form factors, multiple capacity choices, and enough performance for most workloads.


 Amazon