

|
 Though its been shipping for a bit, IBM’s Ultrastar 73LZX undeniably hit the scene much later than competing products from Seagate, Maxtor, and even Fujitsu. The drive was announced on October 24th 2000. One year later at Comdex 2001 I lamented to an IBM representative that we could not obtain the drive from Big Blue itself or from any other distributors. Ironically, in our link to IBM’s press release, we commented that a lower areal density than the competition may perhaps allow the 73LZX to hit the channel sooner. Oops!
The Ultrastar 73LZX is IBM’s entry into the contemporary 73 GB low-profile 10k RPM drive sweeps. Unlike the competition that features 18 GB platters, the 73LZX utilizes platters storing 12 GB each, requiring six disks to reach its flagship 73 GB capacity. IBM specifies the drive’s seek time at 4.9 milliseconds. A four-megabyte buffer rounds out the offering.
 As a 10,000 RPM drive available in Ultra160/320 LVD/SCA and FCAL interfaces, the Ultrastar 73LZX squarely target’s today’s high-performance server market in addition to high-end workstations with heavy disk access. A 5-year warranty backs the drive.
Let’s see how this long-awaited unit stacks up against the competition.
Low-Level ResultsFor diagnostic purposes only, StorageReview measures the following low-level parameters: Average Read Access Time– An average of 25,000 random accesses of a single sector each conducted through IPEAK SPT’s AnalyzeDisk suite. The high sample size permits a much more accurate reading than most typical benchmarks deliver and provides an excellent figure with which one may contrast the claimed access time (claimed seek time + the drive spindle speed’s average rotational latency) provided by manufacturers. WB99 Disk/Read Transfer Rate – Begin– The sequential transfer rate attained by the outermost zones in the hard disk. The figure typically represents the highest sustained transfer rate a drive delivers. WB99 Disk/Read Transfer Rate – End– The sequential transfer rate attained by the innermost zones in the hard disk. The figure typically represents the lowest sustained transfer rate a drive delivers. |
For more information, please click here.
|
Note: Scores on top are better. |
|
|||||||||||||||||||||||||||
|
|
||||||||||||||||||||||||||
IC35L073UWD210 Average Read Service Time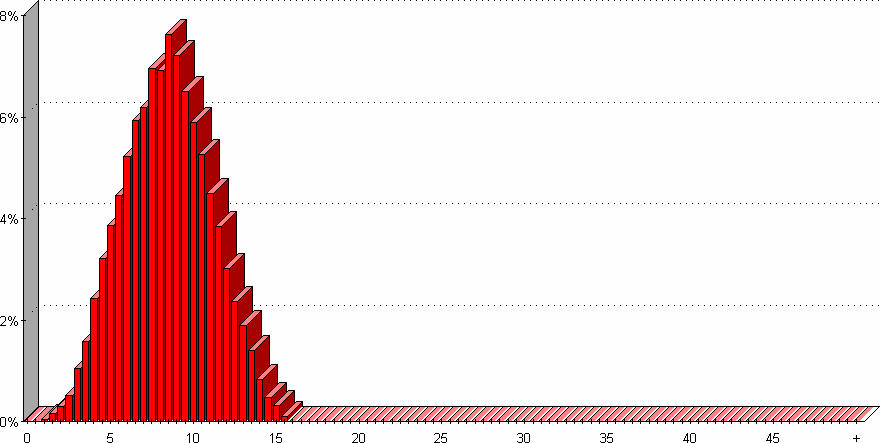 |
IC35L073UWD210 Average Write Service Time |
||||||||||||||||||||||||||
At 8.6 milliseconds, the 73LZX features an access time equivalent to Seagate’s Cheetah 73LP and as a result trails offerings from Maxtor and Fujitsu. Subtracting 3 milliseconds to account for the rotational latency of a 10,000 RPM drive yields a measured seek time of 5.6 milliseconds, a bit off of IBM’s 4.9 ms claim. Writes weigh in at 8.9 milliseconds, in line with the competition and significantly trailing only the Fujitsu MAN.
|
Note: Scores on top are better. |
|
|||||||||||||||||||||||||||
|
|
||||||||||||||||||||||||||
IC35L073UWD210 Transfer Rate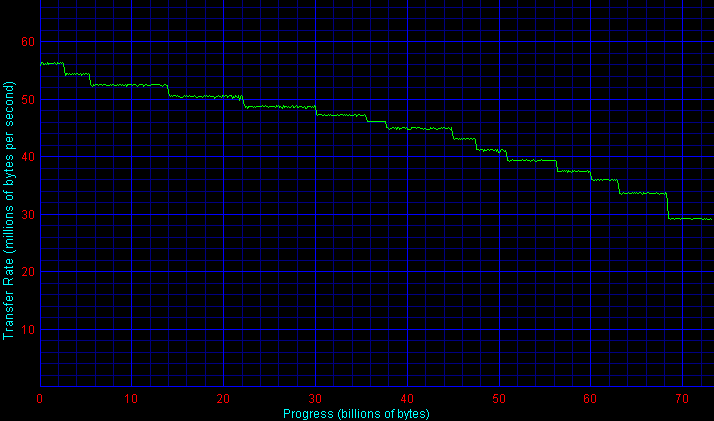 |
|||||||||||||||||||||||||||
Outer-zone transfer rates measure in at 54.5 MB/sec. Thus, despite its higher platter count, the 73LZX turns in rates similar to that of the competition. An inner-track rate of 30.5 MB/sec, while on the low side, still paces the score of the Maxtor Atlas 10k III.
Single-User PerformanceStorageReview uses the following tests to assess non-server use: StorageReview.com Office DriveMark 2002– A capture of 30 minutes of actual computer productivity use that exactingly recreates a typical office-style multitasking environment. The applications include: Outlook XP, Word XP, Excel XP, PowerPoint XP, Calypso (a freeware e-mail client), SecureCRT v3.3 (a telnet/SSH client), CuteFTP Pro v1.0 (an FTP/SSH client), ICQ 2000b), Palm Hotsync 4.0, Gravity 2.3 (a Usenet/newsgroups client), PaintShop Pro v7.0, Media Player v8 for the occasional MP3, and Internet Explorer 6.0. StorageReview.com High-End DriveMark 2002– A capture of VeriTest’s Content Creation Winstone 2001 suite. Applications include Adobe Photoshop v5.5, Adobe Premiere v5.1, Macromedia Director v8.0, Macromedia Dreamweaver v3.0, Netscape Navigator v4.73, and Sonic Foundry Sound Forge v4.5. Unlike typical productivity applications, high-end audio- and video- editing programs are run in a more serial and less multitasked manner. The High-End DriveMark includes significantly more sequential transfers and write (as opposed to read) operations. |
StorageReview.com Bootup DriveMark 2002– A capture of the rather unusual Windows XP bootup process. Windows XP’s boot procedure involves significantly different access patterns and queue depths than those found in other disk accesses. This test recreates Windows XP’s boot up from the initial bootstrap load all the way to initialization and loading of the following memory-resident utilities: Dimension4 (a time synchronizer), Norton Antivirus 2002 AutoProtect, Palm Hotsync v4.0, and ICQ 2000b.
StorageReview.com Gaming DriveMark 2002– A weighted average of the disk accesses featured in five popular PC games: Lionhead’s Black & White v1.1, Valve’s Half-Life: Counterstrike v1.3, Blizzard’s Diablo 2: Lord of Destruction v1.09b, Maxis’s The Sims: House Party v1.0, and Epic’s Unreal Tournament v4.36. Games, of course, are not multitasked- all five titles were run in a serial fashion featuring approximately half an hour of play time per game.
For more information, please click here.
|
Note: Scores on top are better. |
|
|||||||||||||||||||||||||||
|
|
||||||||||||||||||||||||||
|
|
||||||||||||||||||||||||||
The Ultrastar 73LZX scores 376 I/Os per second in the StorageReview.com Office DriveMark 2002, quite good compared to Seagate and Fujitsu’s drive but trailing the Atlas’ indomitable lead. In the SR High-End DriveMark 2002, a somewhat more STR-intensive test, the 73LZX again scores similarly to the Cheetah and MAN yet significantly trails Maxtor’s drive.
SR’s Bootup DriveMark 2002 throws a twist in with queue depths that differ significantly from other patterns. While the IBM matches Seagate’s performance here, both the Fujitsu and Quantum remain beyond reach. Finally, when it comes to our Gaming DriveMark, the Ultrastar along with the MAN bests the Cheetah… but the Atlas again remains far ahead.
Multi-User PerformanceStorageReview uses the following tests to assess server performance: StorageReview.com File Server DriveMark 2002– A mix of synthetically-created reads and writes through IOMeter that attempts to model the heavily random access that a dedicated file server experiences. Individual tests are run under loads with 1 I/O, 4 I/Os, 16 I/Os, and 64 I/Os outstanding. The Server DriveMark is a convenient at-a-glance figure derived from the weighted average of results obtained from the four different loads. StorageReview.com Web Server DriveMark 2002– A mix of synthetically-created reads through IOMeter that attempts to model the heavily random access that a dedicated web server experiences. Individual tests are run under loads with 1 I/O, 4 I/Os, 16 I/Os, and 64 I/Os outstanding. The Server DriveMark is a convenient at-a-glance figure derived from the weighted average of results obtained from the four different loads. For more information click here. |
|
Note: Scores on top are better. |
|
|||||||||||||||||||||||||||
|
|
||||||||||||||||||||||||||
Margins are much narrower in the SR File Server DriveMark. The Ultrastar places in the middle of a pack led by Fujitsu’s MAN3735. The same hierarchy replays itself within the Web Server DriveMark- the IBM again remains in the middle while Fujitsu’s drive leads.
Legacy PerformanceeTesting Lab’s WinBench 99 Disk WinMark tests are benchmarks that attempt to measure desktop performance through a rather dated recording of high-level applications. Despite their age, the Disk WinMarks are somewhat of an industry standard. The following results serve only as a reference; SR does not factor them into final judgments and recommends that readers do the same. |
|
Note: Scores on top are better. |
|
|||||||||||||||||||||||||||
|
|
||||||||||||||||||||||||||
Heat and NoiseIdle Noise– The sound pressure emitted from a drive measured at a distance of 18 millimeters. The close-field measurement allows for increased resolution between drive sound pressures and eliminates interactions from outside environmental noise. Note that while the measurement is an A-weighted decibel score that weighs frequencies in proportion to human ear sensitivity, a low score does not necessarily predict whether or not a drive will exhibit a high-pitch whine that some may find intrusive. Conversely, a high score does not necessarily indicate that the drive exhibits an intrusive noise envelope. Net Drive Temperature– The highest temperature recorded from a 16-point sample of a drive’s top plate after it has been under heavy load for 80 minutes. The figures provided are net temperatures representing the difference between the measured drive temperature and ambient temperature. For more information, please click here. |
|
Note: Scores on top are better. |
|
|||||||||||||||||||||||||||
|
|
||||||||||||||||||||||||||
The 73LZX’s higher platter count unfortunately asserts itself when it comes to our heat measurements. Turning in a net temperature of 32.4 degrees Celsius, the Ultrastar’s temperature is the highest we’ve yet measured save only that from IBM’s own 15k RPM unit. As is the case with most 10k RPM drives, careful cooling should be considered.
IBM’s drive is also among the loudest we’ve measured. Objective measurements place the 73LZX at 52.8 dB/A, again the loudest recorded next to IBM’s 36Z15. More noticeable, however, is a screeching noise that occurs approximately every 70 seconds. This sound occurs only when the drive is idle- note that performance is in line with expectations and that the drive’s STR graph features no odd dips. An IBM representative indicates that this is a normal period of rapid seeking and re-calibration that occurs every minute or so during idle time. Though IBM states that it should not be noticeable when the drive is mounted in an enclosure, the noise was very noticeable within our testbed’s case. This noise was much more intrusive than that of normal seeks. Standard seek sounds, like that of all other 10k-15k drives, rumbled away.
ConclusionWhen it comes to high-performance desktop situations, the Ultrastar performs as expected from a 10k drive. No drive has been able to match Maxtor’s Atlas 10k III in these scenarios. Likewise, in server setups, the 73LZX joins other contenders in trailing the category-leading MAN3735. When it comes to performance, the Ultrastar is decidedly average. The 73LZX unfortunately also turns in the highest noise and heat readings in its class. These drawbacks are significant when it comes to desktop settings. And even in server situations, Fujitsu’s MAN delivers better performance with less heat and noise. As much as we want to like the 73LZX, better options exist no matter what the application. |


 Amazon