

The Kingston SSDNow mS200 is an mSATA SSD that is built specifically for system builders, OEMs, and enthusiasts. Roughly eight times smaller than a 2.5” drive, the SSDNow mS200 claims sequential read/write speeds of 550MB/s and 530MB/s. The device is fully compliant with mSATA interface, uses NAND based flash memory and supports Intel’s SRT, S.M.A.R.T., and TRIM. The mS200 comes in 30GB, 60GB, 120GB, 240GB, and 480GB capacities.
The Kingston SSDNow mS200 mSATA is basically a barebones SSD aimed at OEMs and users who want to update their ultra thin notebook or tablets. It features a high performance for a low price point. It also comes with a relatively high endurance spec. For example, the 240GB we’ll be testing has a projected TBW of 585TB.
The Kingston SSDNow mS200 mSATA is available in 30GB to 480GB capacities. The device comes with a 3-year warranty (2-year for the 30GB) and has a street price ranging from $45.00 to $460.00.
Kingston SSDNow mS200 mSATA specifications:
- Capacities: 30GB, 60GB, 120GB, 240GB, 480GB
- Memory: NAND flash memory based
- Controller: LSI SandForce 2281
- NAND: Tohiba
- Interface: SATA Rev. 3.0 (6Gb/s), SATA Rev. 2.0 (3Gb/s), SATA Rev. 1.0 (1.5Gb/s)
- Form Factor: mSATA
- Power Consumption
- 1.2 (TYP) read / 1.8W (TYP) write
- Idle: 0.4W
- Dimensions: 50.88mm x 30mm
- Weight: 6.86 grams
- Warranty: 3-year (30GB – 2-year warranty)
Design And Build
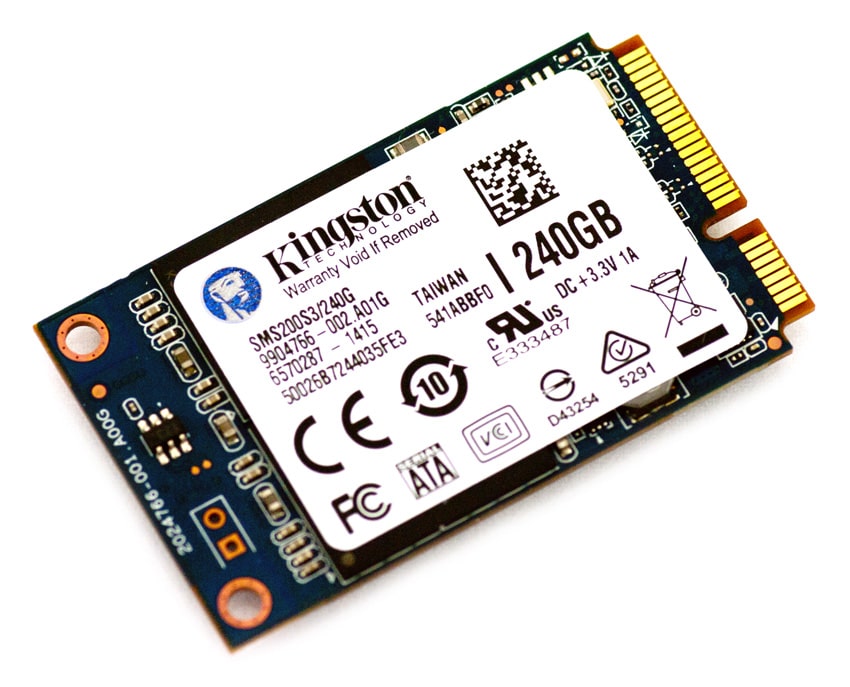
The Kingston SSDNow mS200 mSATA is about 40 percent smaller and 12 times lighter than the standard HDD or in other words about 1/3 the size of a standard business card.
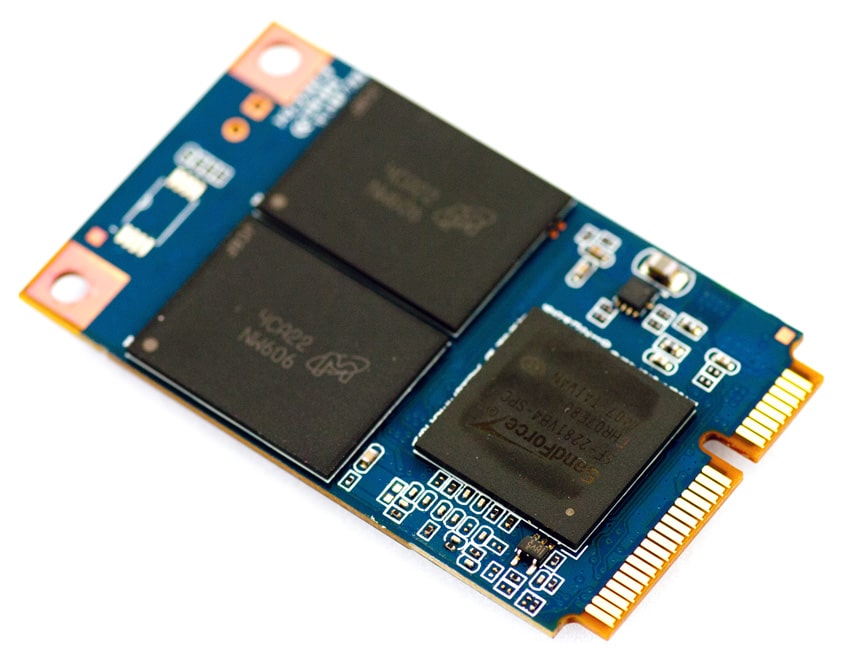
On the device itself is a large sticker that covers the components. The sticker has part number, serial number, and storage size. Flipping the device over reveals two NAND packages and the LSI SandForce 2281 controller.
Performance:
For our test we will be using the 240GB version of the Kingston mS200, testing both random and repeating data.
All consumer SSD benchmarks are conducted with the StorageReview Consumer Testing Platform. The comparables used for this review include:
- Intel 310 mSATA 80GB SSD
- OCZ Nocti mSATA 120GB SSD Repeating
- OCZ Nocti mSATA 120GB SSD Random
- Micron RealSSD C400 mSATA 128GB
- Plextor M5M mSATA 256GB
- Intel SSD 525 Repeating
- Intel SSD 525 Random
- Samsung 840 EVO mSATA 1TB
In our first benchmark we tested straight-line sequential performance using a 2MB transfer size. The Kingston m200 performed near the bottom of the pack with repeating coming in with read performance at 191MB/s read and 208MB/s write while the random had stronger read performance at 326MB/s read and 196MB/s write. The 840 EVO performed best overall.
Our next test maintains the 2MB transfer size, but this time we are measuring random transfer speeds. We see similar results to the above. The Kingston m200 repeating had a read performance at 169MB/s read and 210MB/s write while the random had stronger read performance at 377MB/s read and a slightly lower write performance at 193MB/s. The 840 EVO performed best write performance at 484MB/s and the Intel 525 repeating had the best read performance at 504MB/s.
In our next test, we measure low queue depth random 4k read and write performance. Here, we see the Kingston mS200 random comes out on top with write performance at 78.1MB/s. And the 840 EVO came out on top for read performance at 38.4MB/s.
Next we measured random 4K throughput. We see similar results to above. The Kingston mS200 random comes out on top for write throughput with 19,993IOPS. While the 840 EVO comes out on top for read throughput with 9,826IOPS.
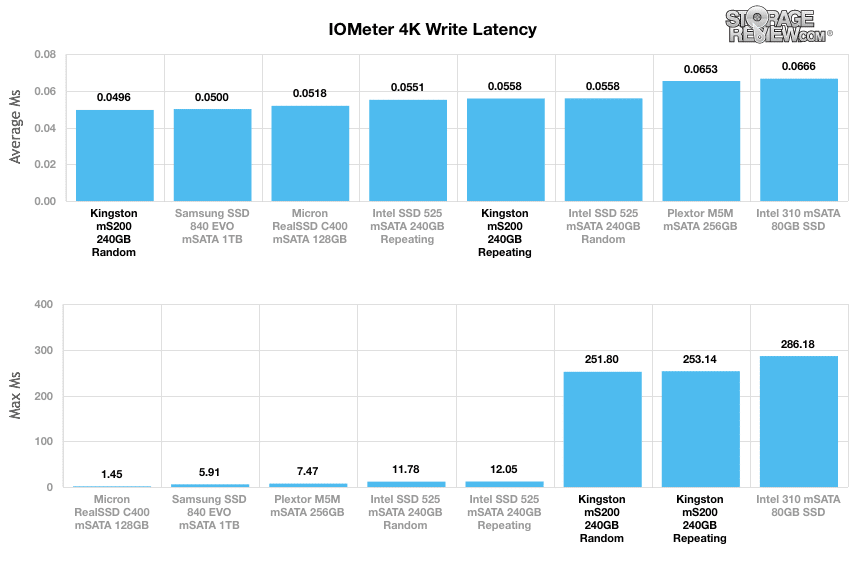
Expanding our 4k test, we look at write latency of each SSD. Max latency is also important, although that number can change as the NAND experiences wear over time. The Kingston mS200 random eeked out the lowest average latency at 0.0496ms while the Micron RealSSD had the lowest max latency at 1.454ms.
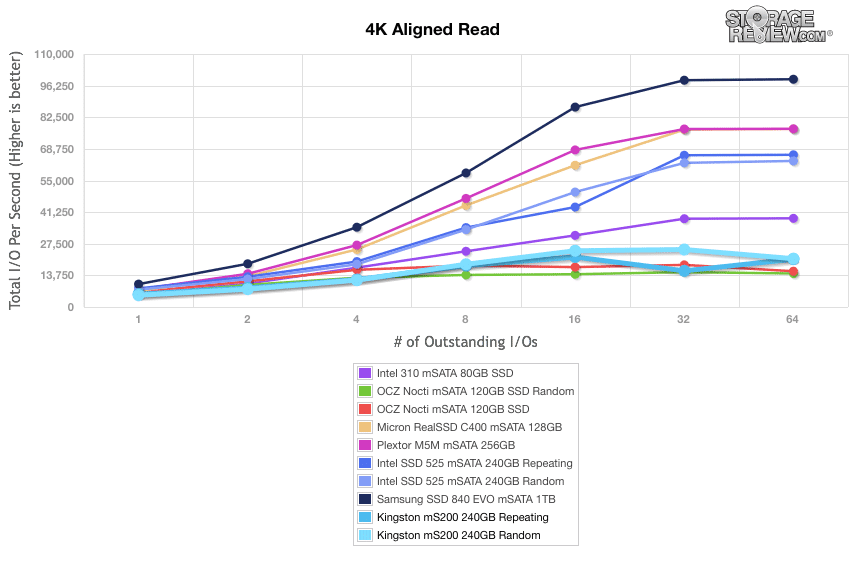
In our next test, we shift to a smaller 4k random workload with 100% read activity that scales from 1QD to 64QD. In this setting, the Kingston mS200 repeating ran near the bottom of the pack, the overall leader was the 840 EVO.
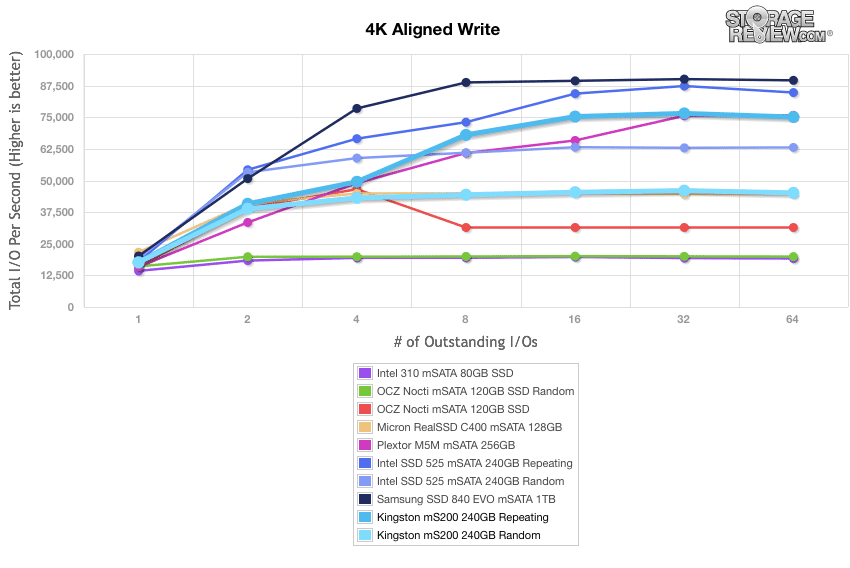
Shifting focus to write activity, the Kingston mS200 repeating ran near the top but the overall leader was again the 840 EVO.
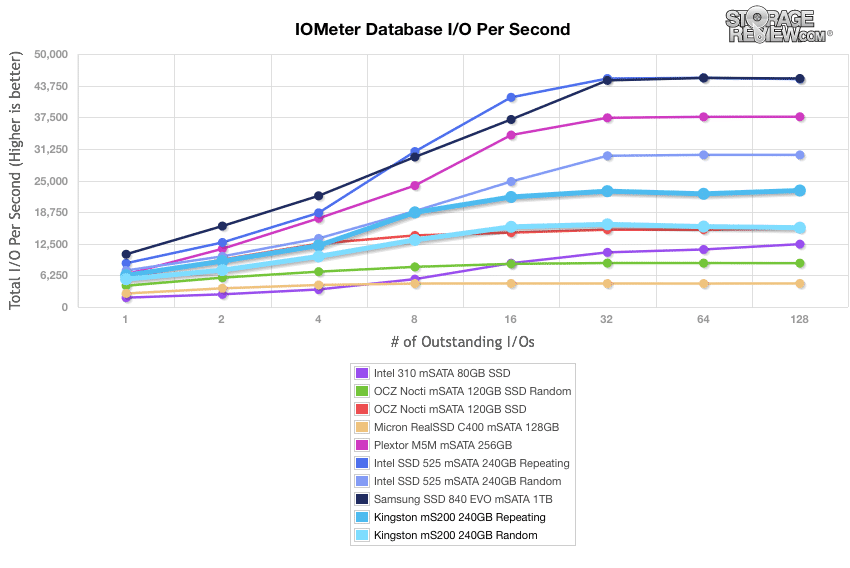
Our last series of synthetic benchmarks compare the hard drives in a series of server mixed-workloads with a queue depth of ranging from 1 to 128. Each of our server profile tests has a strong preference towards read activity, ranging from 67% read with our database profile to 100% read in our web server profile.
The first is our database profile; with a 67% read and 33% write workload mix primarily centered on 8K transfer sizes. In the test, both Kingstons ran near the middle to bottom of the pack while the 840 EVO and Intel 525 repeating battled it out for the top spot.
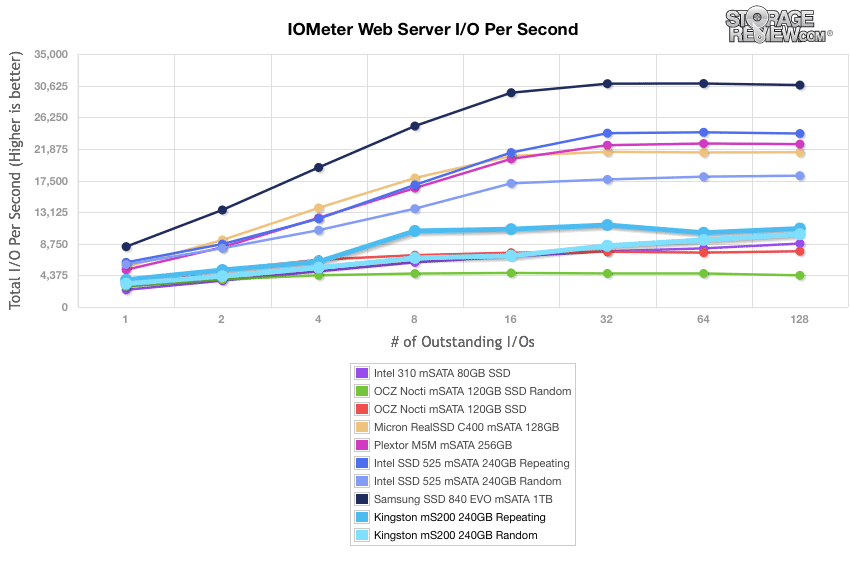
Our web server profile is read-only with a spread of transfer sizes from 512-byte to 512KB. Again the Kingston mS200s hung around the bottom hovering around the 10,000IOPS mark in later queue depths. While the 840 EVO crushed the other drives.
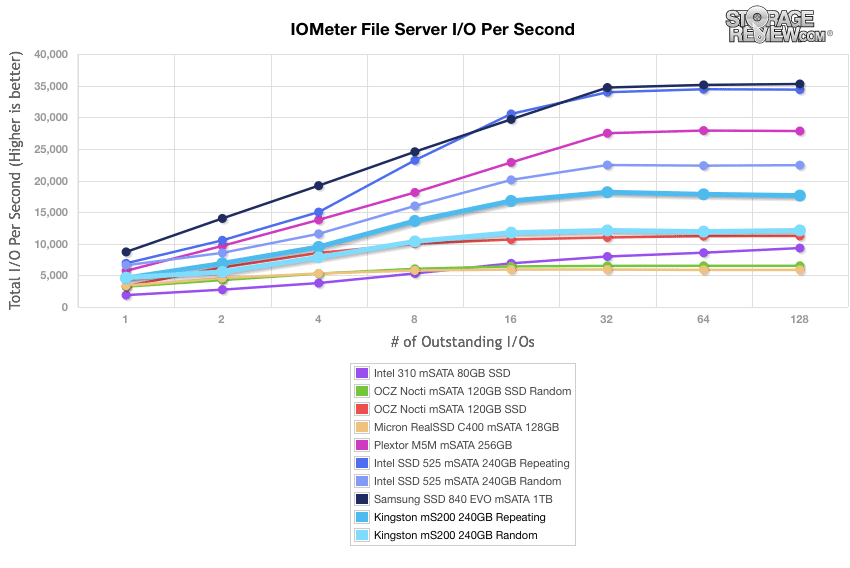
The next profile looks at a file server, with 80% read and 20% write workload spread out over multiple transfer sizes ranging from 512-byte to 64KB. The Kingston mS200 was about the same as the previous test. Again the 840 EVO and the Intel 525 repeating were duking it out for the top spot.
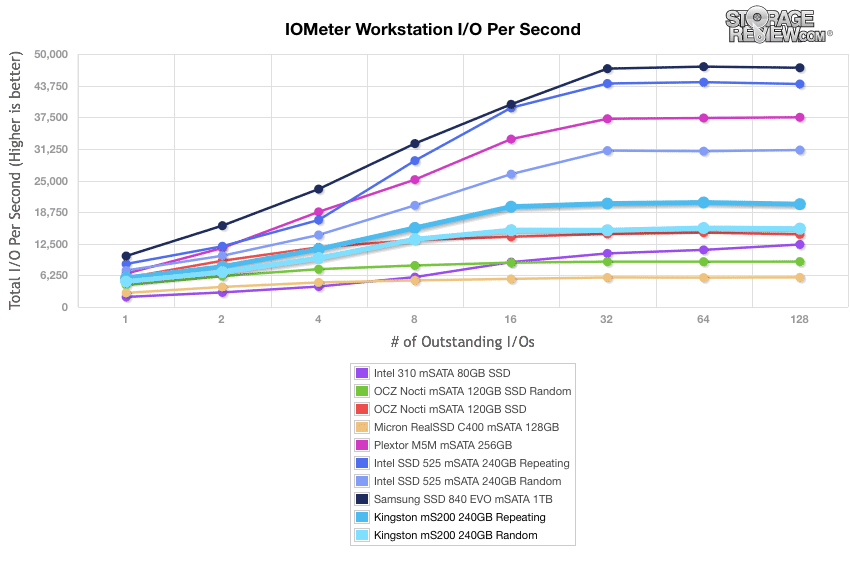
The last profile looks at workstation activity, with a 20% write and 80% read mixture using 8K transfers. While the Kingston mS200s were higher in this test they maintained their spot within the rest of the pack. And again the 840 EVO stood out on top.
Consumer Real-World Benchmarks
For the average consumer, trying to translate random 4K write speeds into an everyday situation is pretty difficult. It helps when comparing drives in every setting possible, but it doesn’t exactly work out into faster everyday usage or better game loading times. For this reason we turned to our StorageMark 2010 traces, which include HTPC, Productivity, and Gaming traces to help readers find out how a drive might rank under these conditions.
The first real-life test is our HTPC scenario. In this test we include: playing one 720P HD movie in Media Player Classic, one 480P SD movie playing in VLC, three movies downloading simultaneously through iTunes, and one 1080i HDTV stream being recorded through Windows Media Center over a 15-minute period. Higher IOps and MB/s rates with lower latency times are preferred. In this trace we recorded 2,986MB being written to the drive and 1,924MB being read.
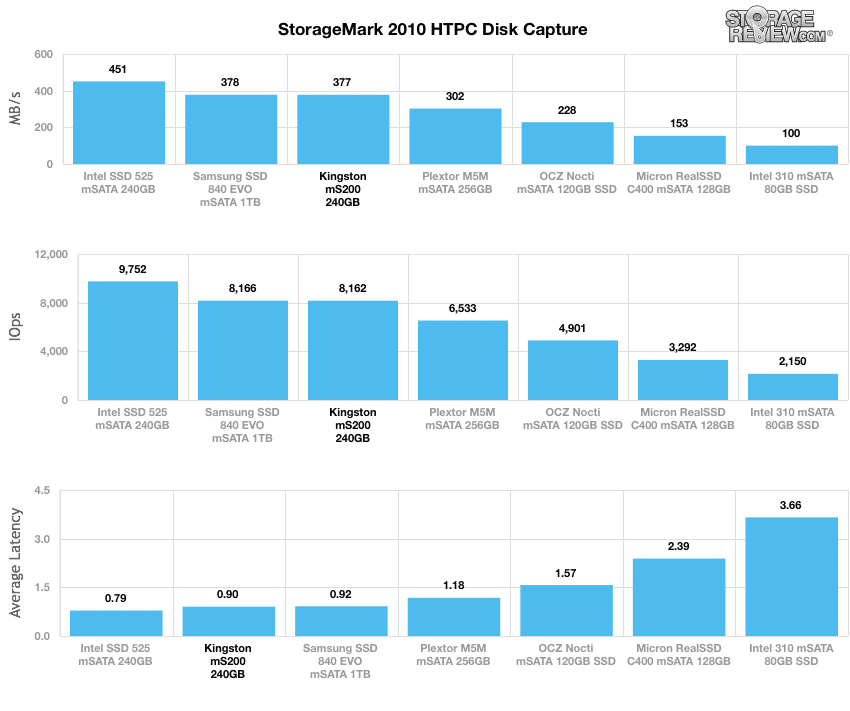
Though the Kingston mS200 didn’t come out on top it did run neck and neck with the 840 EVO that had been coming out on top on several of the previous tests.
Our second real-life test covers disk activity in a productivity scenario. For all intents and purposes this test shows drive performance under normal daily activity for most users. This test includes: a three hour period operating in an office productivity environment with 32-bit Vista running Outlook 2007 connected to an Exchange server, web browsing using Chrome and IE8, editing files within Office 2007, viewing PDFs in Adobe Reader, and an hour of local music playback with two hours of additional online music via Pandora. In this trace we recorded 4,830MB being written to the drive and 2,758MB being read.
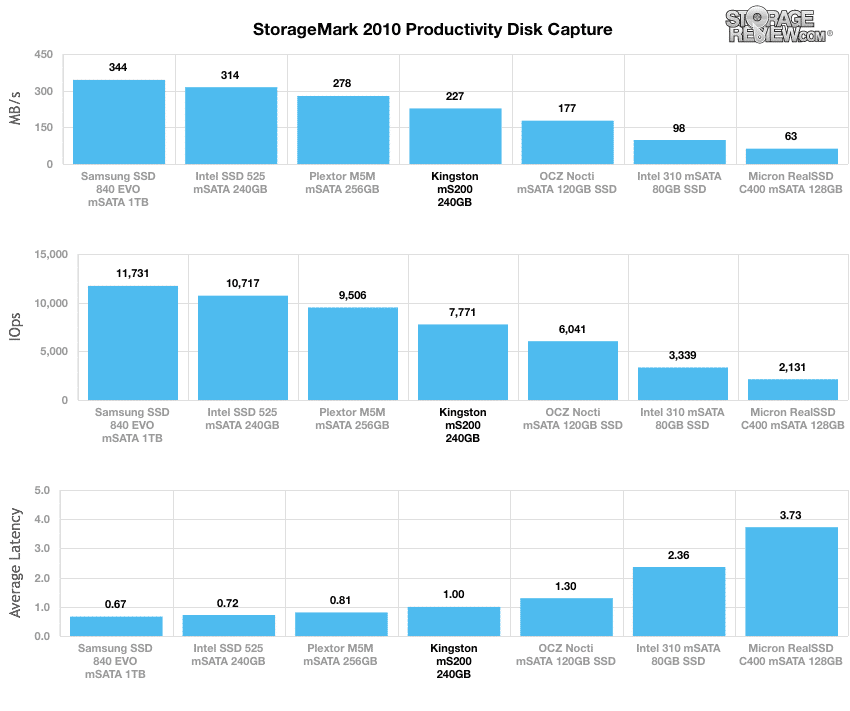
The Kingston mS200 finished in the middle in the productivity scenario, with a throughput of 7,771IOPS, an average latency of 0.999ms, and a speed of 227.25MB/s.
Our third real-life test covers disk activity in a gaming environment. Unlike the HTPC or Productivity trace, this one relies heavily on the read performance of a drive. To give a simple breakdown of read/write percentages, the HTPC test is 64% write, 36% read, the Productivity test is 59% write and 41% read, while the gaming trace is 6% write and 94% read. The test consists of a Windows 7 Ultimate 64-bit system pre-configured with Steam, with Grand Theft Auto 4, Left 4 Dead 2, and Mass Effect 2 already downloaded and installed. The trace captures the heavy read activity of each game loading from the start, as well as textures as the game progresses. In this trace we recorded 426MB being written to the drive and 7,235MB being read.
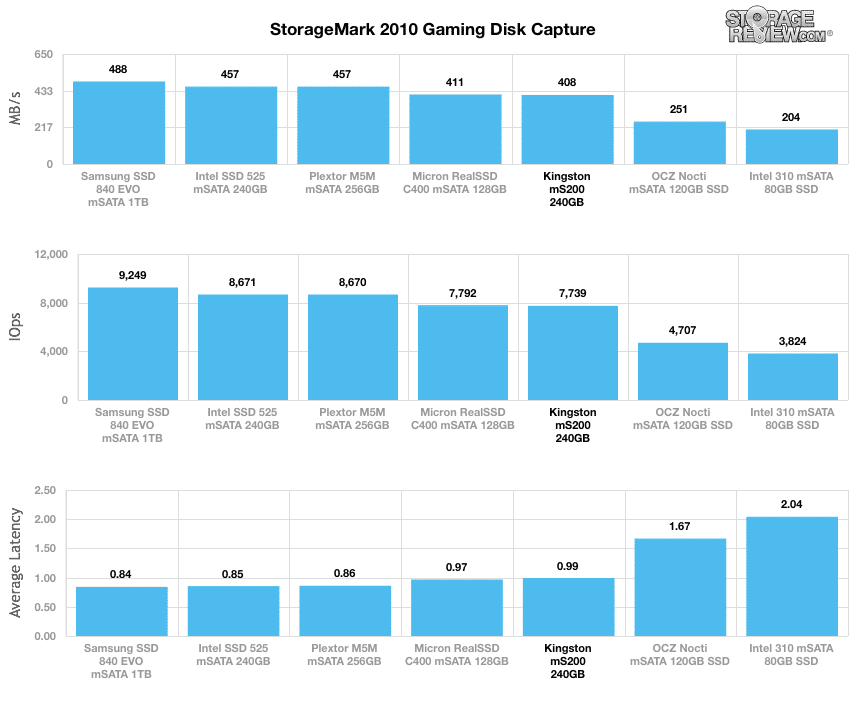
The Kingston mS200 ran about in the middle this go round, with a throughput of 7739IOPS, a speed of 408MB/s, and an average latency of 0.99ms.
Conclusion
The Kingston SSDNow mS200 is an mSATA SSD with OEMs and enthusiasts in mind. It comes in multiple capacities from 30GB up to 480GB, uses Toshiba MLC NAND and SandForce controller. The mS200 comes with a 3-year warranty (2-year for the 30GB).
From a performance perspective, the Kingston mS200 had a few strong showings throughout. It even ran pretty well with the 840 EVO, which was one of the top performers in the consumer real-world benchmark tests. The mS200 didn’t achieve its claimed sequential read/write speeds of 550MB/s and 530MB/s; it hit a 326MB/s read and 196MB/s write in our 2MB sequential test. The Kingston mS200 random did come out on top with the 4K write performance and it had the lowest average write latency, but it slumped behind in 4K read performance. Overall the main competing factor for the Kingston SSDNow mS200 is its low price, coming in with street prices below the Intel SSD 525 and Samsung EVO mSATA.
Pros
- Low price point
- Can easily be used to upgrade a ultra-thin laptop or tablet of desktop board with mSATA support
Cons
- Did not perform as well as the other drives our synthetic mixed workloads
- Fell short of claimed sequential performance in tests
The Bottom Line
The Kingston SSDNow mS200 is an mSATA SSD that posts good performance, new higher capacities and aggressive price points making for a good upgrade choice for budget-centric buyers who want more out of their mSATA port.


 Amazon