
We’ve seen numerous enterprise SSDs from Memblaze over the years, they’re often on the leading edge when it comes to both technology and performance. Recently they’ve launched a new set of SSDs in the Memblaze PBlaze5 family, the Memblaze PBlaze5 920 Series. The the 916 Series before it, the PBlaze5 920 Series comes in U.2 and Add-in-Card (AIC) form factors. The biggest difference with the 920 Series is that it uses a new set of NAND, moving to 96-layer 3D TLC NAND from 64-layer in the prior model. At the top end, the new Memblaze SSDs are quoted to deliver 5.9GB/s and 970,000 IOPS at the top end of the performance spectrum.
We’ve seen numerous enterprise SSDs from Memblaze over the years, they’re often on the leading edge when it comes to both technology and performance. Recently they’ve launched a new set of SSDs in the Memblaze PBlaze5 family, the Memblaze PBlaze5 920 Series. The the 916 Series before it, the PBlaze5 920 Series comes in U.2 and Add-in-Card (AIC) form factors. The biggest difference with the 920 Series is that it uses a new set of NAND, moving to 96-layer 3D TLC NAND from 64-layer in the prior model. At the top end, the new Memblaze SSDs are quoted to deliver 5.9GB/s and 970,000 IOPS at the top end of the performance spectrum.
The 920 Series comes in two endurance ratings, either 1 drive write per day (DWPD) or 3 DWPD. This creates four distinct drives, segmented on form factor and endurance. The AIC form factors are designated as C920 and C926, with the C920 being the more read centric drive and the C926 carrying that 3 DWPD endurance rating. Similarly, the U.2 drives are the D920 and D926, matching up the same way on endurance. The lower endurance drives come in 3.84TB and 7.68TB capacities in both farm factors. Similarly the 3 DWPD SSDs come in 3.2TB and 6.4TB capacities across both families. The prior 916 Series drives did have a higher capacity model, that Memblaze has dropped this time around, likely due to lack of volume.
Memblaze has a number of key features embedded in these SSDs. On of our favorites is the ability to upgrade drive firmware without reset. This means drives can be updated without having to reboot the server. Memblaze has also added what they call “Quota by Namespace.” The drives now support 32 namespaces, that each have a different AES-256 key to encrypt data. Within these namespaces, non-critical applications can be limited to ensure QoS of more important applications. The drives also support a number of featured to ensure data reliability including; LDPC error correction, AES-256 bit data encryption, full data path protection, T10 PI end-to-end protection, and enhanced power fail protection.
Here is our video overview:
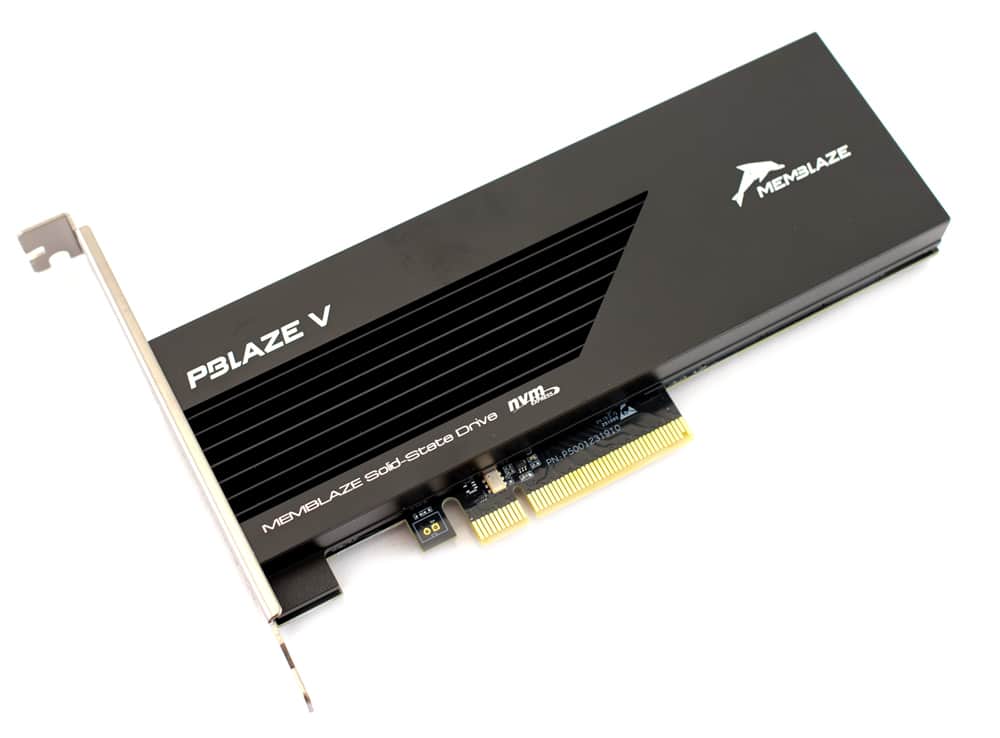
Our review model is the 6.4TB C926.
Memblaze PBlaze 920 Series Specifications
| Model | D920 | C920 | D926 | C926 | ||||
| User Capacity (TB) | 3.84 | 7.68 | 3.84 | 7.68 | 3.2 | 6.4 | 3.2 | 6.4 |
| Interface | PCIe 3.0 x 4 | PCIe 3.0 x 8 | PCIe 3.0 x 4 | PCIe 3.0 x 8 | ||||
| Form Factor | 2.5-inch U.2 | HHHL AIC | 2.5-inch U.2 | HHHL AIC | ||||
| 128KB Sequential Read (GB/s) | 3.5 | 3.5 | 5.6 | 5.9 | 3.5 | 3.5 | 5.6 | 5.9 |
| 128KB Sequential Write (GB/s) | 3.3 | 3.5 | 3.3 | 3.7 | 3.3 | 3.5 | 3.3 | 3.7 |
| Sustained Random Read (4KB) IOPS | 825K | 840K | 835K | 970K | 825K | 835K | 835K | 970K |
| Sustained Random Write(4KB) IOPS (Steady State) | 140K | 150K | 140K | 150K | 280K | 300K | 280K | 300K |
| Latency Read/Write(μs) | 90 / 12 | |||||||
| Lifetime Endurance | 1DWPD | 3DWPD | ||||||
| Uncorrectable Bit Error Rate | < 10 -17 | |||||||
| Mean Time Between Failures | 2 million hours | |||||||
| Protocol | NVMe 1.2a | |||||||
| NAND Flash Memory | 3D eTLC NAND | |||||||
| Operation System | RHEL, SLES, CentOS, Ubuntu, Windows Server, VMware ESXi | |||||||
| Power Consumption | 7~ 25w | |||||||
| Basic Feature Support | Power Failure Protection, Hot Pluggable, Full Data Path Protection, S.M.A.R.T, Flexible Power Management | |||||||
| Advanced Feature Support | TRIM, Multi-namespace, AES 256 Data Encryption & Crypto Erase, Dual Port & Reservation (U.2 only), EUI64/NGUID Variable Sector Size Management & T10 PI (DIF/DIX), Firmware Upgrade without Reset, Quota by Namespace | |||||||
| Software Support | Open source management tool, CLI debug tool OS in-box driver (Easy system integration) | |||||||
Memblaze PBlaze5 C926 Performance
Testbed
Our Enterprise SSD reviews leverage a Lenovo ThinkSystem SR850 for application tests and a Dell PowerEdge R740xd for synthetic benchmarks. The ThinkSystem SR850 is a well-equipped quad-CPU platform, offering CPU power well in excess of what’s needed to stress high-performance local storage. Synthetic tests that don’t require a lot of CPU resources use the more traditional dual-processor server. In both cases, the intent is to showcase local storage in the best light possible that aligns with storage vendor maximum drive specs.
Lenovo ThinkSystem SR850
- 4 x Intel Platinum 8160 CPU (2.1GHz x 24 Cores)
- 16 x 32GB DDR4-2666Mhz ECC DRAM
- 2 x RAID 930-8i 12Gb/s RAID Cards
- 8 NVMe Bays
- VMware ESXI 6.5
Dell PowerEdge R740xd
- 2 x Intel Gold 6130 CPU (2.1GHz x 16 Cores)
- 4 x 16GB DDR4-2666MHz ECC DRAM
- 1x PERC 730 2GB 12Gb/s RAID Card
- Add-in NVMe Adapter
- Ubuntu-16.04.3-desktop-amd64
Testing Background and Comparables
The StorageReview Enterprise Test Lab provides a flexible architecture for conducting benchmarks of enterprise storage devices in an environment comparable to what administrators encounter in real deployments. The Enterprise Test Lab incorporates a variety of servers, networking, power conditioning, and other network infrastructure that allows our staff to establish real-world conditions to accurately gauge performance during our reviews.
We incorporate these details about the lab environment and protocols into reviews so that IT professionals and those responsible for storage acquisition can understand the conditions under which we have achieved the following results. None of our reviews are paid for or overseen by the manufacturer of equipment we are testing. Additional details about the StorageReview Enterprise Test Lab and an overview of its networking capabilities are available on those respective pages.
Comparables for this review:
Application Workload Analysis
In order to understand the performance characteristics of enterprise storage devices, it is essential to model the infrastructure and the application workloads found in live-production environments. Our benchmarks for the Memblaze PBlaze5 916 are therefore the MySQL OLTP performance via SysBench and Microsoft SQL Server OLTP performance with a simulated TCP-C workload. For our application workloads, each drive will be running 2-4 identically configured VMs.
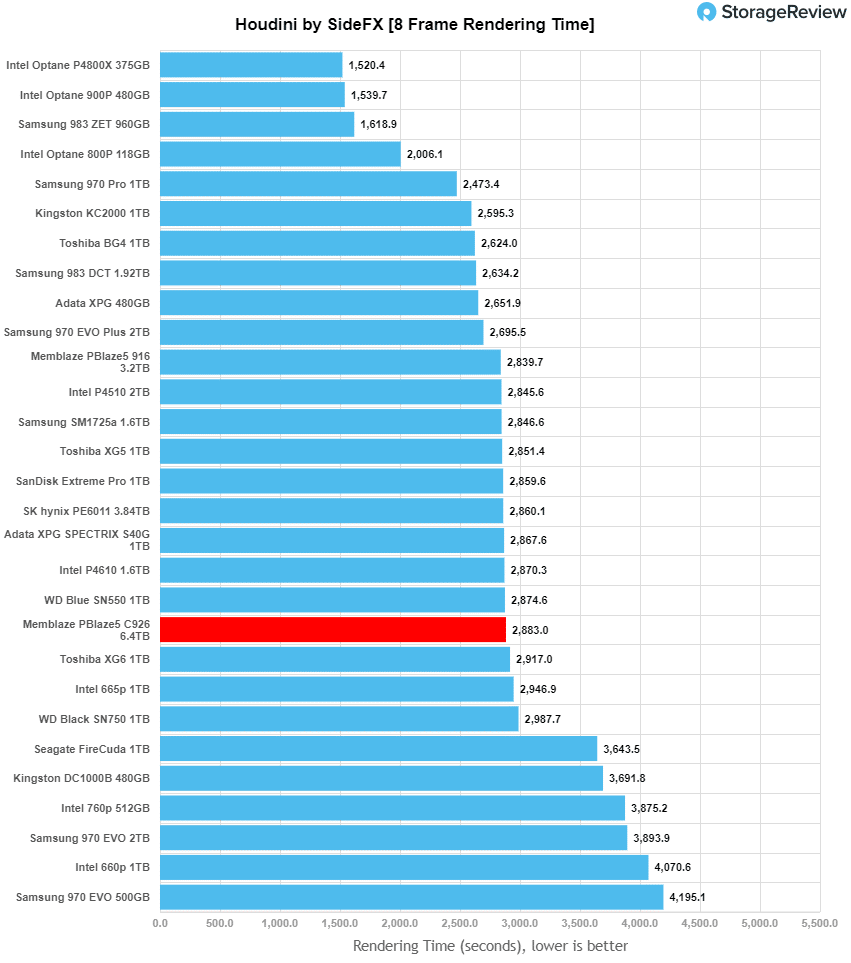
Houdini by SideFX
The Houdini test is specifically designed to evaluate storage performance as it relates to CGI rendering. The test bed for this application is a variant of the core Dell PowerEdge R740xd server type we use in the lab with dual Intel 6130 CPUs and 64GB DRAM. In this case, we installed Ubuntu Desktop (ubuntu-16.04.3-desktop-amd64) running bare metal. Output of the benchmark is measured in seconds to complete, with fewer being better.
The Maelstrom demo represents a section of the rendering pipeline that highlights the performance capabilities of storage by demonstrating its ability to effectively use the swap file as a form of extended memory. The test does not write out the result data or process the points in order to isolate the wall-time effect of the latency impact to the underlying storage component. The test itself is composed of five phases, three of which we run as part of the benchmark, which are as follows:
- Loads packed points from disk. This is the time to read from disk. This is single threaded, which may limit overall throughput.
- Unpacks the points into a single flat array in order to allow them to be processed. If the points do not have dependency on other points, the working set could be adjusted to stay in-core. This step is multi-threaded.
- (Not Run) Processes the points.
- Repacks them into bucketed blocks suitable for storing back to disk. This step is multi-threaded.
- (Not Run) Writes the bucketed blocks back out to disk.
Here, we see the Memblaze PBlaze5 C926 land in the bottom third of the “middle” performers with a rendering of 2,883 seconds, down about 44 seconds from the 916.
SQL Server Performance
Each SQL Server VM is configured with two vDisks: 100GB volume for boot and a 500GB volume for the database and log files. From a system-resource perspective, we configured each VM with 16 vCPUs, 64GB of DRAM and leveraged the LSI Logic SAS SCSI controller. While our Sysbench workloads tested previously saturated the platform in both storage I/O and capacity, the SQL test is looking for latency performance.
This test uses SQL Server 2014 running on Windows Server 2012 R2 guest VMs, and is stressed by Quest’s Benchmark Factory for Databases. StorageReview’s Microsoft SQL Server OLTP testing protocol employs the current draft of the Transaction Processing Performance Council’s Benchmark C (TPC-C), an online transaction-processing benchmark that simulates the activities found in complex application environments. The TPC-C benchmark comes closer than synthetic performance benchmarks to gauging the performance strengths and bottlenecks of storage infrastructure in database environments. Each instance of our SQL Server VM for this review uses a 333GB (1,500 scale) SQL Server database and measures the transactional performance and latency under a load of 15,000 virtual users.
SQL Server Testing Configuration (per VM)
- Windows Server 2012 R2
- Storage Footprint: 600GB allocated, 500GB used
- SQL Server 2014
-
- Database Size: 1,500 scale
- Virtual Client Load: 15,000
- RAM Buffer: 48GB
- Test Length: 3 hours
- 2.5 hours preconditioning
- 30 minutes sample period
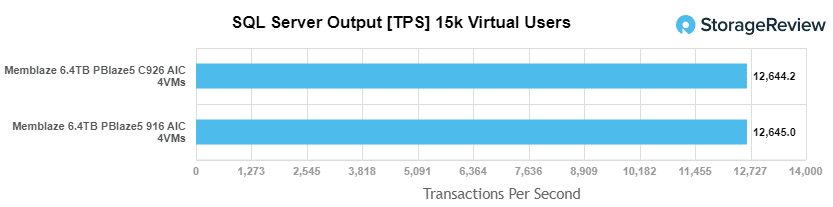
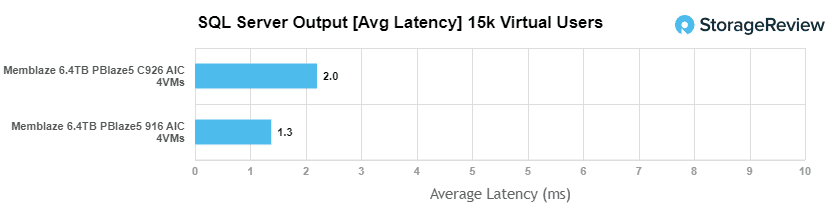
For our SQL Server transactional benchmark, the Memblaze PBlaze5 C926 had an aggregate score of 12,644.2 TPS with individual VMs ranging between 3,161 to 3,161.09 TPS. This is just under the 916 that had an aggregate of 12,645 TPS.
Average latency saw the C926 to have 2ms across the board. Again, slightly under the 916’s 1.25ms.
Sysbench Performance
The next application benchmark consists of a Percona MySQL OLTP database measured via SysBench. This test measures average TPS (Transactions Per Second), average latency, and average 99th percentile latency as well.
Each Sysbench VM is configured with three vDisks: one for boot (~92GB), one with the pre-built database (~447GB), and the third for the database under test (270GB). From a system-resource perspective, we configured each VM with 16 vCPUs, 60GB of DRAM and leveraged the LSI Logic SAS SCSI controller.
Sysbench Testing Configuration (per VM)
- CentOS 6.3 64-bit
- Percona XtraDB 5.5.30-rel30.1
-
- Database Tables: 100
- Database Size: 10,000,000
- Database Threads: 32
- RAM Buffer: 24GB
- Test Length: 3 hours
- 2 hours preconditioning 32 threads
- 1 hour 32 threads
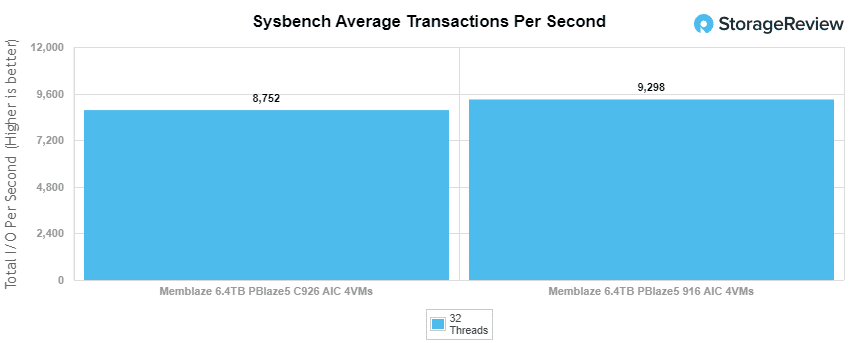
With the Sysbench transactional benchmark, the Memblaze PBlaze5 C926 had an aggregate score of 8,751.6 TPS compared to the previous 916’s 9,298 TPS aggregate score.
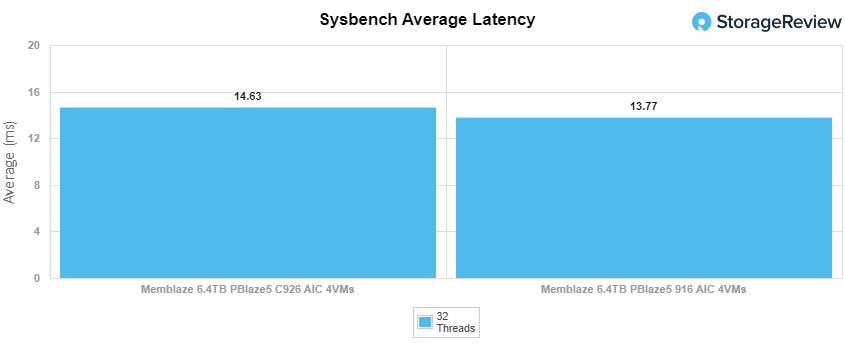
Sysbench average latency saw the C926 with an aggregate latency of 14.6ms versus the 916’s 13.8ms.
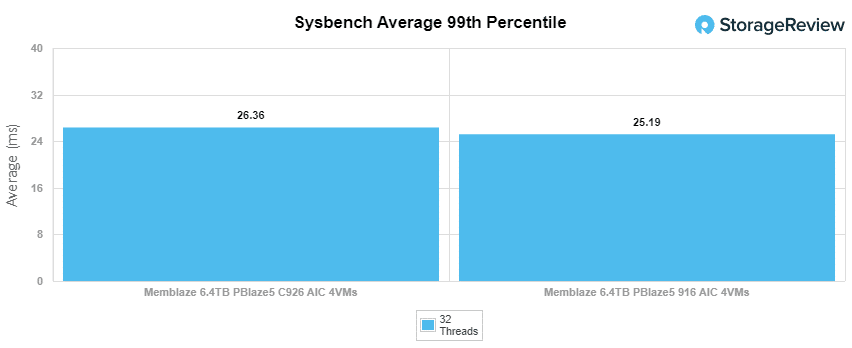
For our worst case scenario latency (99th percentile) the C926 showed us a latency of 26.4ms compared to the latency of the 916 that was 25.2ms.
VDBench Workload Analysis
When it comes to benchmarking storage devices, application testing is best, and synthetic testing comes in second place. While not a perfect representation of actual workloads, synthetic tests do help to baseline storage devices with a repeatability factor that makes it easy to do apples-to-apples comparison between competing solutions. These workloads offer a range of different testing profiles ranging from “four corners” tests, common database transfer size tests, to trace captures from different VDI environments. All of these tests leverage the common vdBench workload generator, with a scripting engine to automate and capture results over a large compute testing cluster. This allows us to repeat the same workloads across a wide range of storage devices, including flash arrays and individual storage devices. Our testing process for these benchmarks fills the entire drive surface with data, then partitions a drive section equal to 25% of the drive capacity to simulate how the drive might respond to application workloads. This is different than full entropy tests which use 100% of the drive and takes them into steady state. As a result, these figures will reflect higher-sustained write speeds.
Profiles:
- 4K Random Read: 100% Read, 128 threads, 0-120% iorate
- 4K Random Write: 100% Write, 64 threads, 0-120% iorate
- 64K Sequential Read: 100% Read, 16 threads, 0-120% iorate
- 64K Sequential Write: 100% Write, 8 threads, 0-120% iorate
- Synthetic Database: SQL and Oracle
- VDI Full Clone and Linked Clone Traces
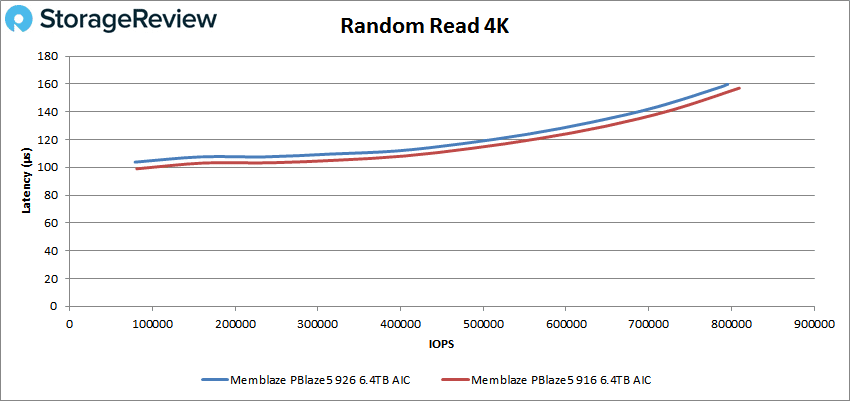
In our first VDBench Workload Analysis, Random 4K Read, the Memblaze PBlaze5 C926 AIC ran fairly close to the 916 throughout but finished just behind with a peak score of 789,134 IOPS with a latency of 159.8µs.
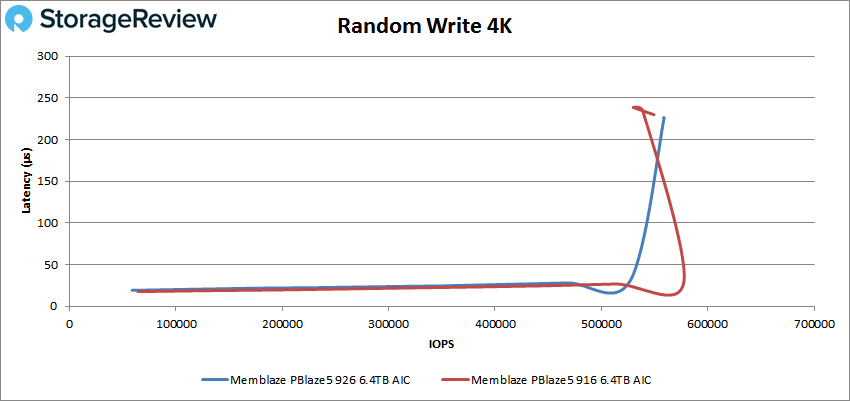
For 4K random write again the C926 followed the 916 a bit before trailing off and peaking at 558,945 IOPS at a latency of 226.3µs.
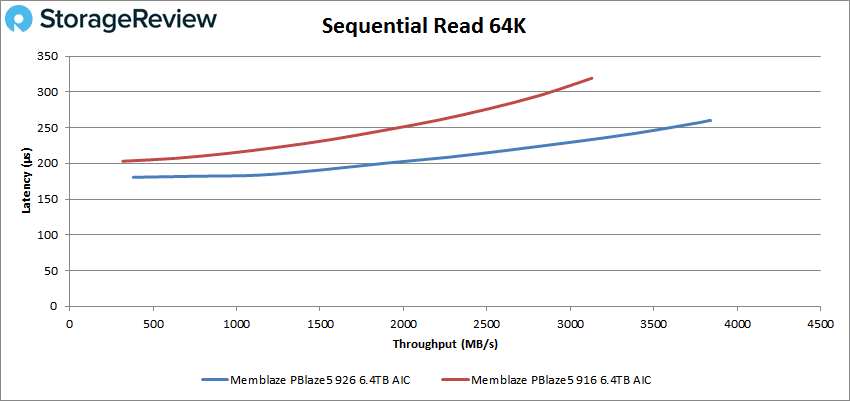
Switching over to sequential workloads we see the C926 run with lower latency and peak higher than the 916 in the 64K read. The peak score for the C926 was 61,356 IOPS or 3.83GB/s at a latency of 260µs.
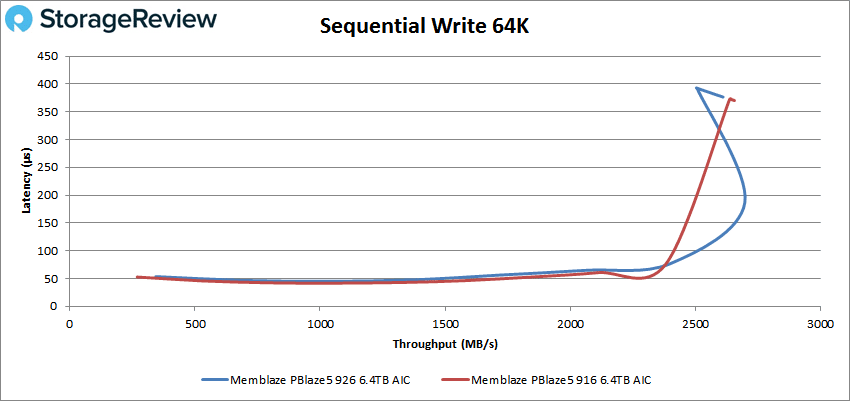
For 64K sequential write the C926 again tracked with the 916 for the most part before going on to peak higher (at about 43K IOPS or 2.7GB/s at a latency of roughly 200µs) before falling off some and dropping below the other drive.
Our next set of tests are our SQL workloads: SQL, SQL 90-10, and SQL 80-20. Starting with SQL, the Memblaze PBlaze5 C926 start at a little higher latency and stayed there throughout to peak second with 238,861 IOPS at a latency of 133.5µs.
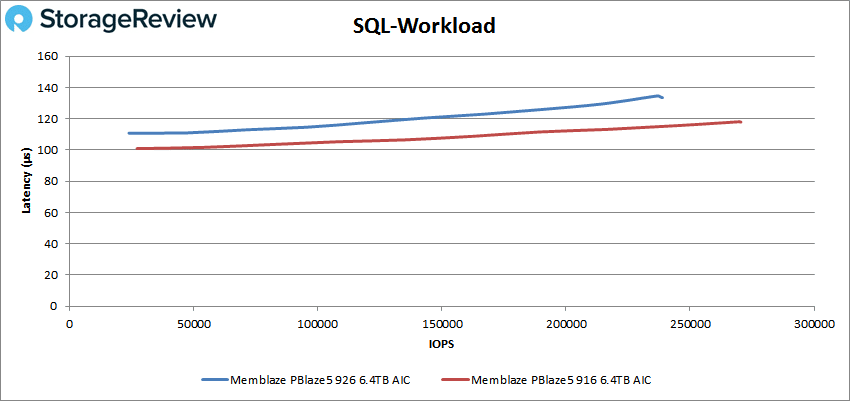
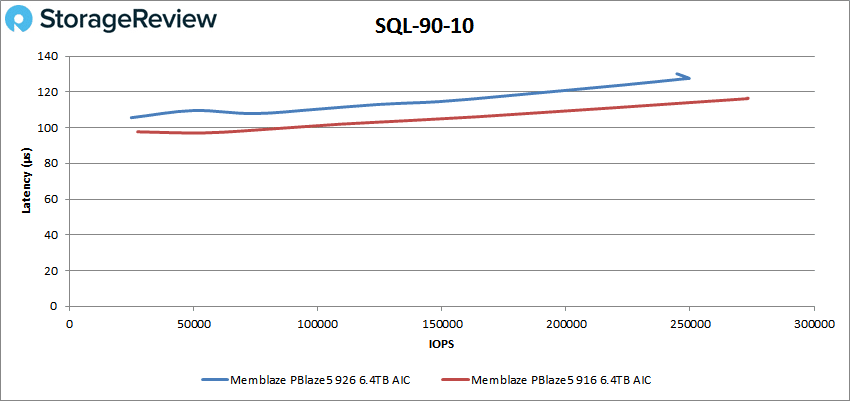
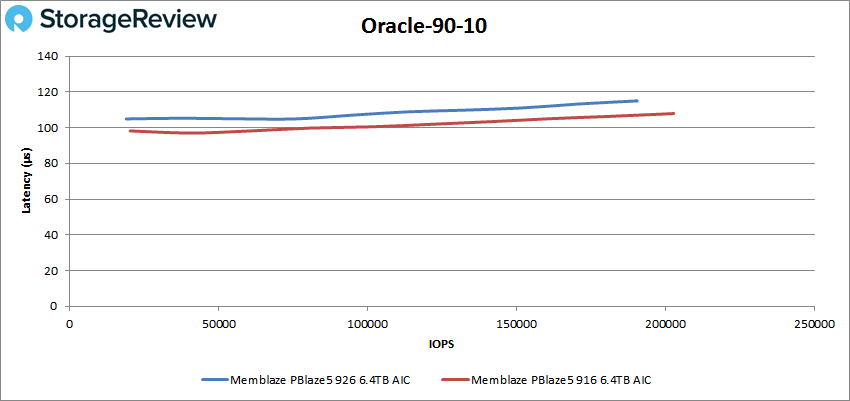
SQL 90-10 painted a similar picture with the C926 again taking second to the 916 with a peak performance of 249,682 IOPS with a latency of 127.6µs before falling off some.
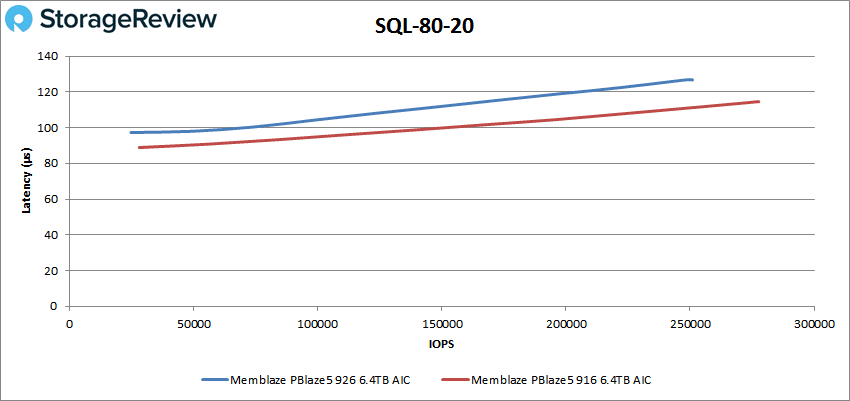
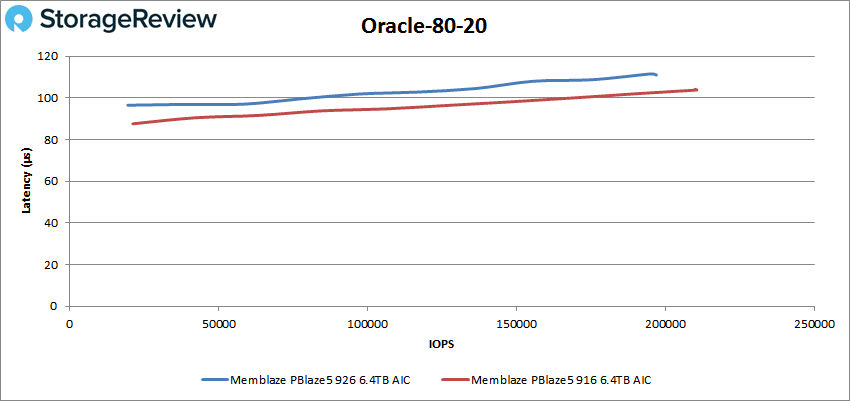
With the SQL 80-20 the drives continued the trend with the C926 peaking second at 250,990 IOPS with a latency 126.7µs.
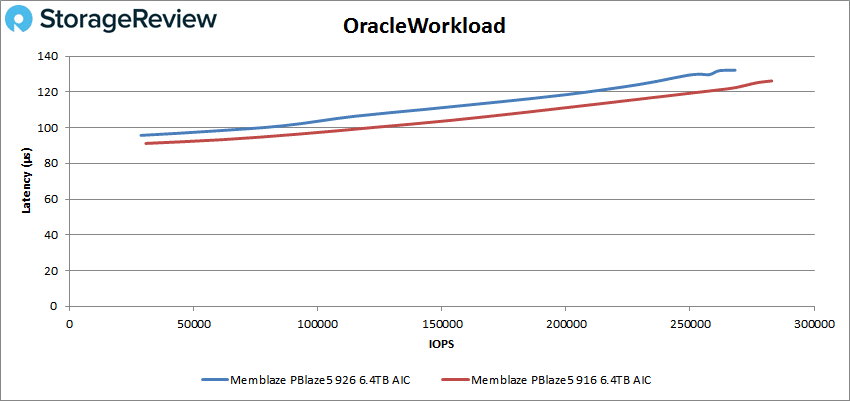
Next up are our Oracle workloads: Oracle, Oracle 90-10, and Oracle 80-20. Starting with Oracle, the Memblaze PBlaze5 C926 peaked second with 268,147 IOPS with a latency of 132.2µs.
Oracle 90-10 showed us more of the above, the C926 ran right behind the 916 and peaked at 190,557 IOPS 114.9µs.
With Oracle 80-20 the C926 peaked behind the 916 at 197,016 IOPS with a latency of 111µs.
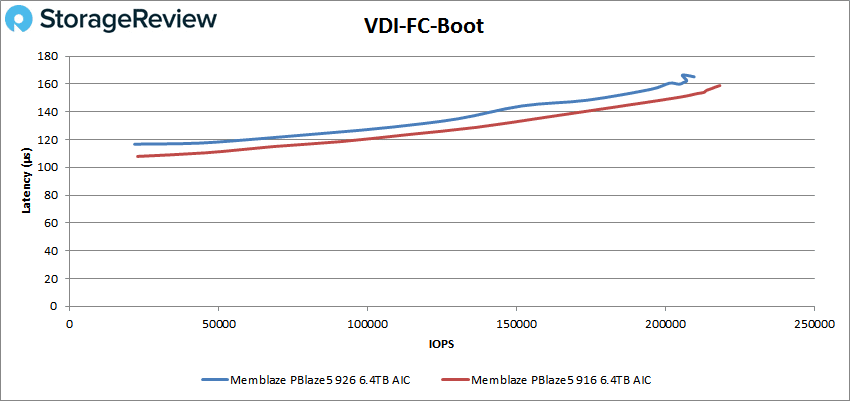
Next, we switched over to our VDI clone test, Full and Linked. For VDI Full Clone (FC) Boot, the Memblaze PBlaze5 C926 had a peak of 209,687 IOPS at a latency of 165.2µs falling short of the 916.
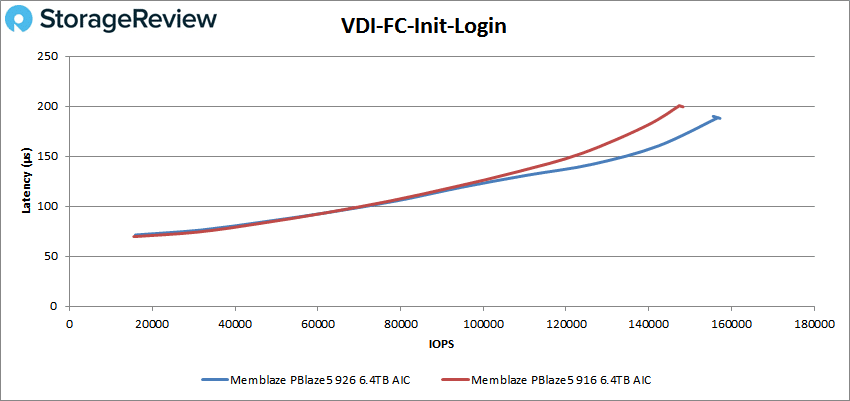
VDI FC Initial Login saw the C926 overtake the 916 and finish first with a peak of 157,217 IOPS with a latency of 188.2µs.
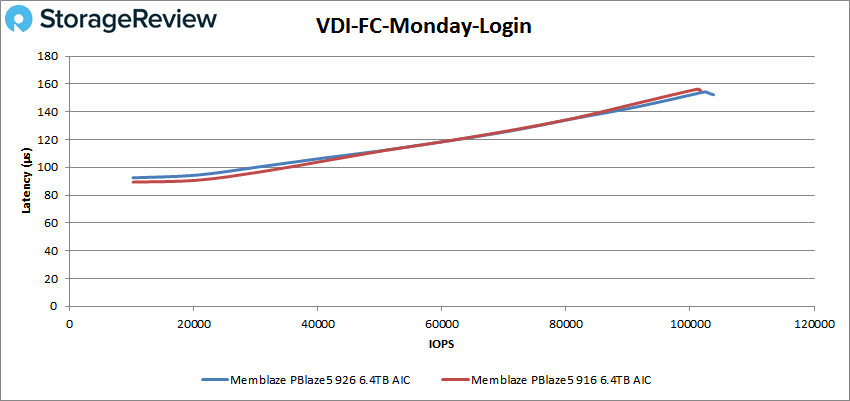
For VDI FC Monday Login, the C926 and 916 ran neck and neck throughout with either giving up the lead and retaking it before the C926 eeked ahead with a peak finish of 103,780 IOPS at a latency of 152.8µs.
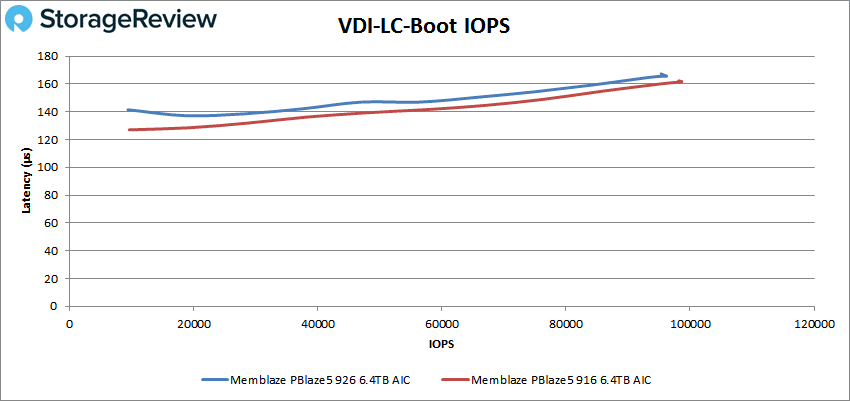
For VDI Linked Clone (LC) Boot, the C926 fell back to its familiar place of second with a peak score of 96,226 IOPS with a latency of 165.7µs.
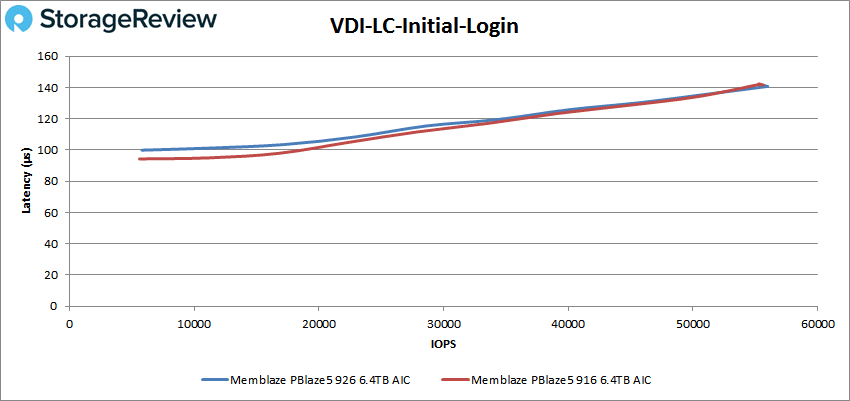
VDI LC Initial Login showed the same as the FC test above, the C926 pulled ahead to take the top spot with a peak score of 55,977 IOPS at a latency of 141µs.
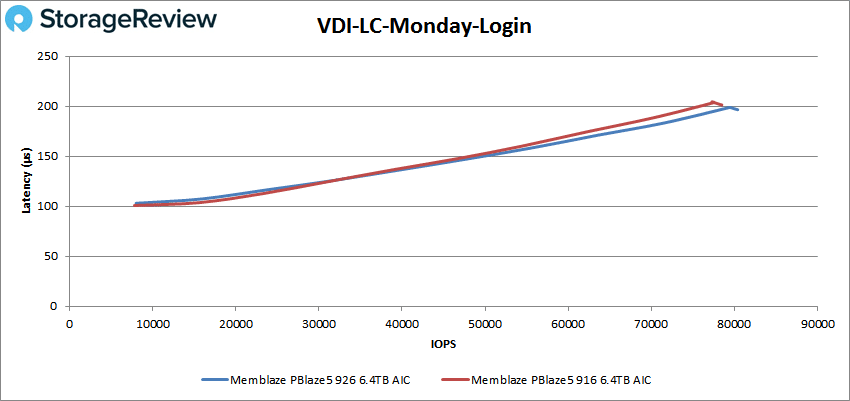
Finally with VDI LC Monday Login the C926 once again barely came out on top with 80,393 IOPS with a latency of 196.6µs.
Conclusion
Memblaze expanded the PBlaze5 line with the introduction of the 920 Series. The primary difference in the new line of drives is the NAND moving from 64-layer to 96-layer. The new series in broken into two type by DWPD, either 1 or 3. It is further sub-divided by form factor and capacity. For this particular review we looked at the Memblaze PBlaze5 C926 HHHL AIC form factor aimed at those that need higher performance and higher endurance storage.
For performance we compared the drive to another Membalze AIC SSD, the Memblaze PBlaze5 916 AIC. While the newer drive is typically expected to performance better, especially with a company like Memblaze. However, the previous 916 beat out the C926 in nearly every category. Not but much, but it did pull ahead. For Application Workload Analysis, we saw the C926 hit 2,644.2 TPS with an average latency of 2ms in SQL Server. Just under the 916 in both cases. For Sysbench the drive hit 8,751.6 TPS, 14.6ms average latency, and 26.4ms worst-case scenario latency, again trailing the 916 by a bit in each test.
Our VDbench test saw more or less similar to the above. In most, but not all, cases the newer C926 trailed slightly behind the 916. Highlights include: 789K IOPS in 4K read, 559K IOPS in 4K write, 3.83GB/s in 64K read, and 2.7GB/s in 64K write where it beat out the older drive. SQL workloads saw 239K IOPS, 250K IOPS for SQL 90-10, and 251K IOPS in SQL 80-20, second to the 916 each time. The same close placement was seen in Oracle workloads with 268K IOPS, 191K IOPS in Oracle 90-10, and 197K IOPS in Oracle 80-20. In our VDI Clone tests the newer drive was able to beat out the older drive in the Initial and Monday Login in both Full and Linked Clone tests.
While trailing an older drive in the PBlaze 5 series, the new Memblaze PBlaze5 920 series still puts up good numbers. The edge-card model works well in legacy server platforms without 2.5″ NVMe bays, or servers that need the added bandwidth from a single drive that U.2 PCIe Gen3 SSDs can’t match. Overall Memblaze continues to put out quality enterprise SSDs that are built to meet the needs of the mainstream market.
Engage with StorageReview
Newsletter | YouTube | Podcast iTunes/Spotify | Instagram | Twitter | Facebook | RSS Feed